solution Use Case
Mastering tx core orchestration with DataMiner
The Techex tx core platform, formerly known as MWCore, has been a cornerstone in managing tx edges (previously MWEdge) and capturing telemetry data for real-time monitoring. With the integration of DataMiner through the REST API, you can manage monitored devices, channels, MWEdges, streams, sources, and outputs seamlessly.
Additionally, configuring a statistics connection provides telemetry data for sources and outputs, including ETR290 statistics.
A comprehensive solution for end-to-end monitoring
We are excited to introduce the Techex tx core orchestration package. This solution offers end-to-end monitoring and orchestration of the tx core platform and tx edges from a single pane of glass. Although this network orchestration solution package is still a first version and may not yet cover the full feature set of the tx core and tx edge products, it enables off-the-shelf monitoring and orchestration of the Techex tx core platform.
What’s new?
You may have seen this previous use case about our Tech Partner integration with Techex, where an initial integration with tx core was showcased. This new solution package builds upon that initial demo and includes several key improvements and features:
- Support for the latest Techex MWCore DataMiner connector: The app has been revamped to integrate the latest main range of the corresponding connector (1.0.4.x), bringing significant performance and resiliency improvements.
- Thumbnails retrieval: The app now leverages enhancements in the latest DataMiner connector version.
- Infrastructure management: Managing and overseeing the tx core cluster has never been easier.
- End-to-end flow diagrams: The computation process has been enhanced to handle larger infrastructure scales more efficiently.
- Monitoring page: Checking the system’s health is now easier than ever.
Beyond the capabilities of the Techex platform
The Techex tx core platform efficiently manages tx edges and captures telemetry data for real-time monitoring. However, it was never designed to provide a high-level overview of stream interconnections across the edges or to analyze historical trends in stream telemetry. This gap presents an opportunity for DataMiner to excel in its orchestration capabilities and offer a comprehensive, single-pane-of-glass solution for end-to-end monitoring and orchestration.
In this context, the tx core package solution is designed to be a valuable asset for anyone using Techex tx core, simplifying the orchestration of end-to-end services on a tx core cluster.
This package is part of Skyline’s solution initiative and will be continuously improved with new features. Stay tuned for future updates and let us know any suggestions for valuable features to facilitate your daily operations with tx core.
USE CASE DETAILS
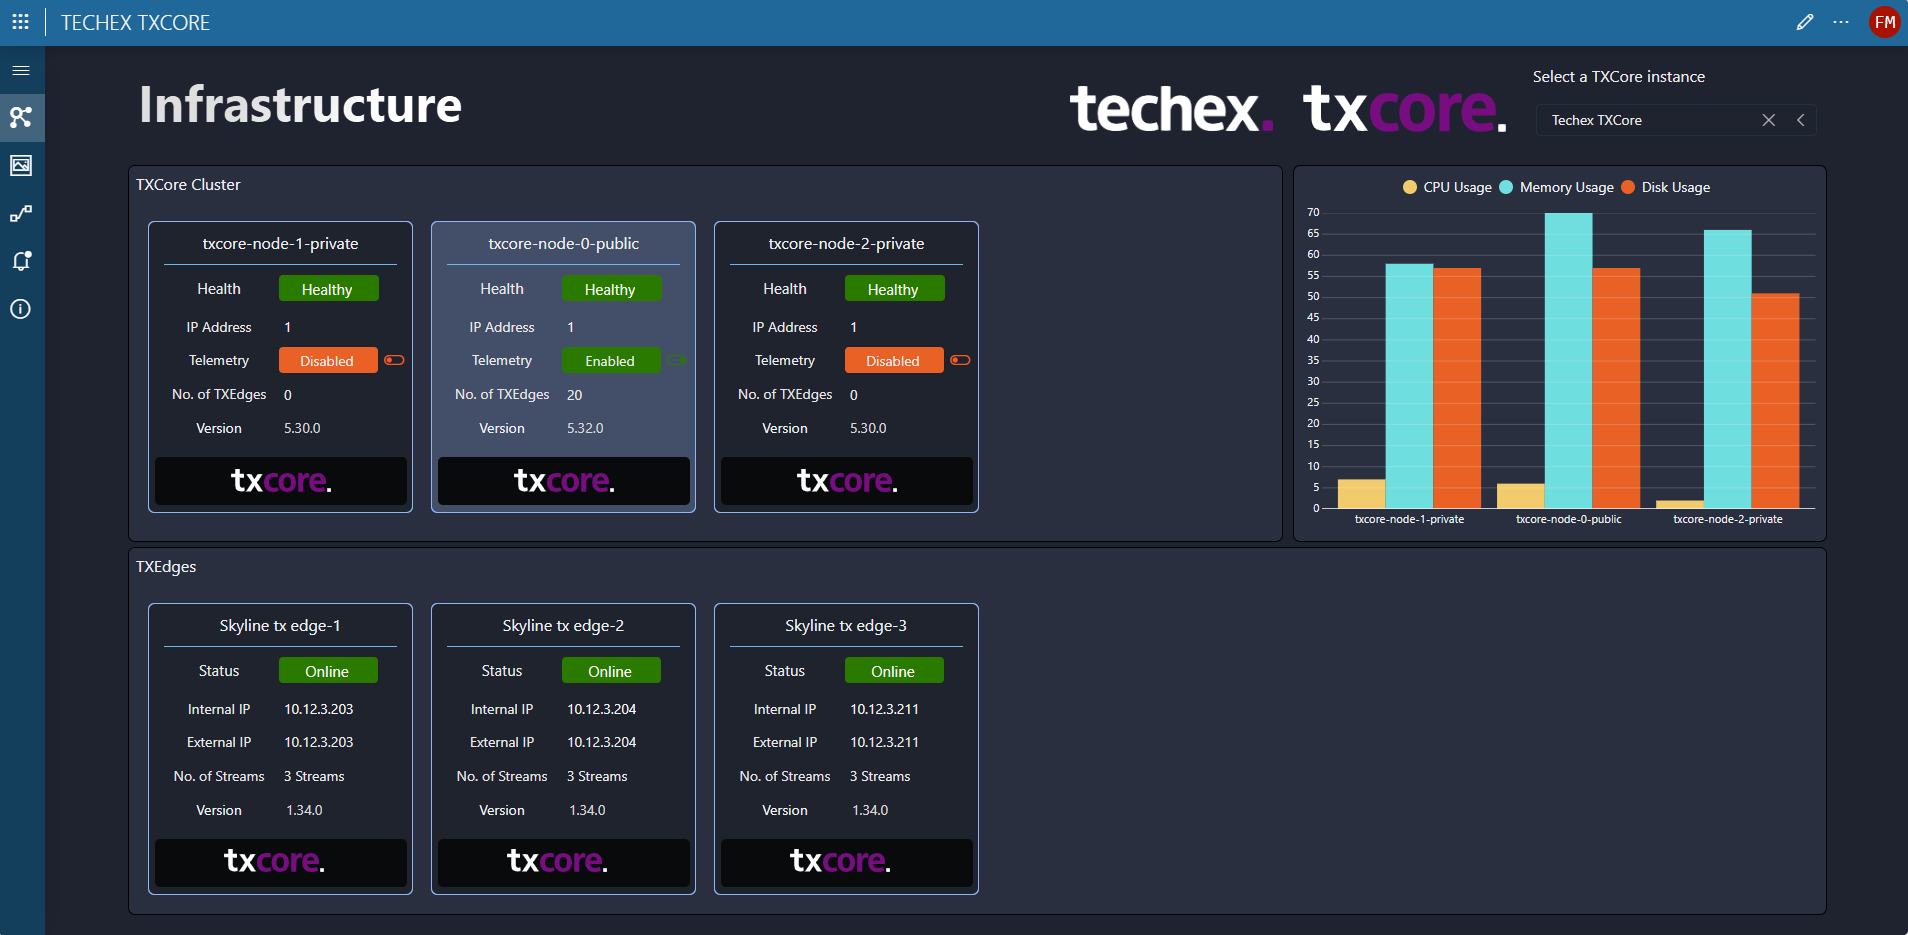
On the landing page of the app, you can see the total number of tx core and tx edge instances, along with the health status of each instance. You can select a tx core instance to filter the displayed tx edges. From this page, you can monitor the cluster infrastructure, verify system uptime, and ensure proper connectivity between DataMiner and tx core.
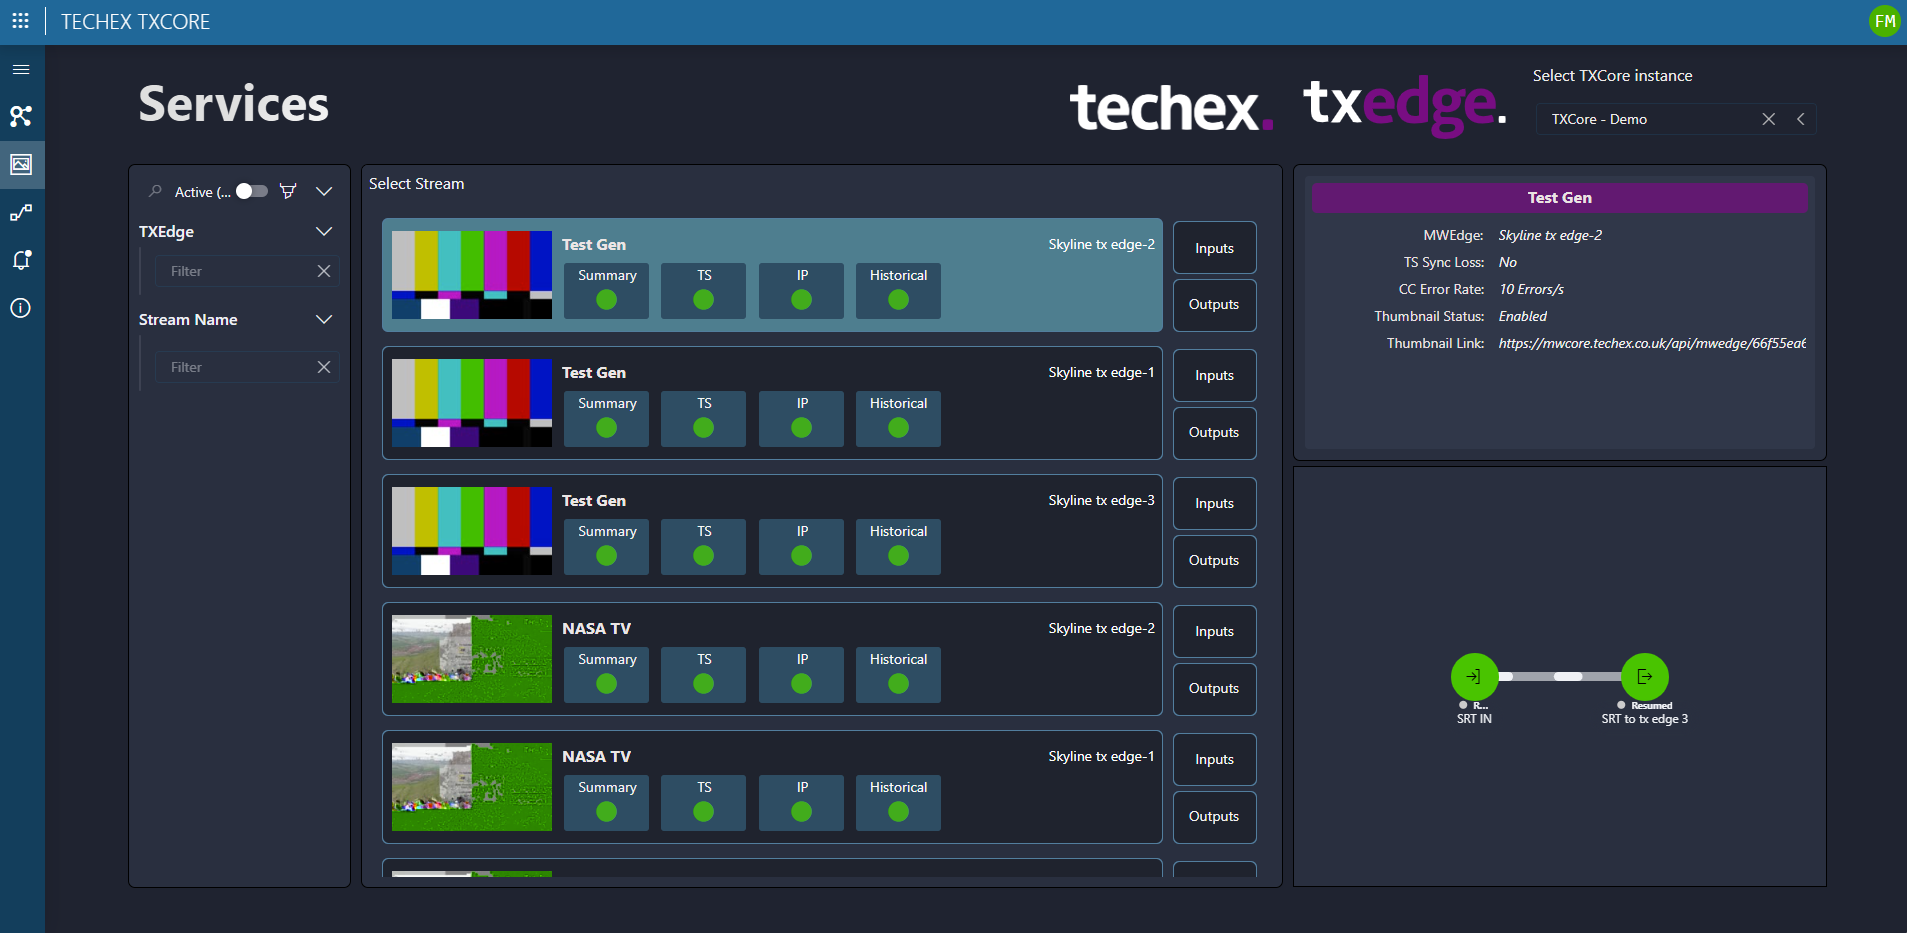 On the Services page, you can find more details about each service across all tx edge instances. This includes a summary of alarms across different layers, such as those related to the transport stream and IP layer. In the lower right corner, the DataMiner node edge component has been used for a visual representation of the connectivity.
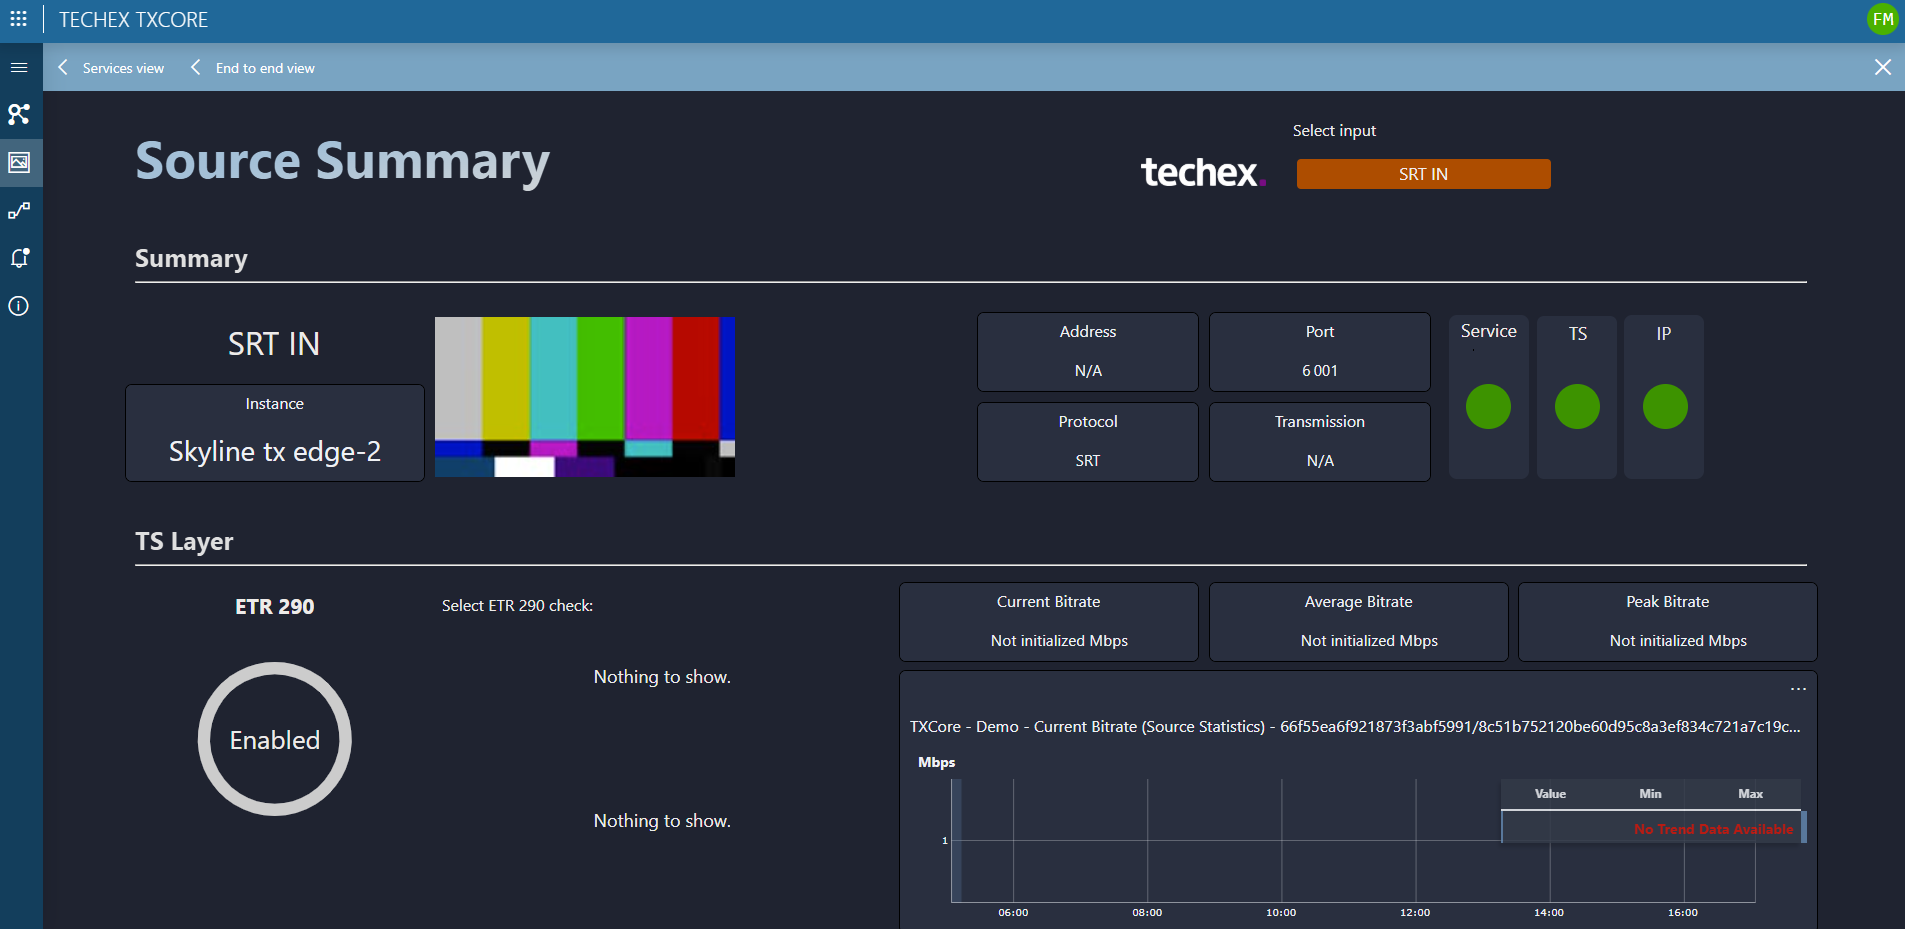 By double-clicking any source or destination, you will be redirected to the Node Summary page, which displays key parameters and metrics for input or output streams.
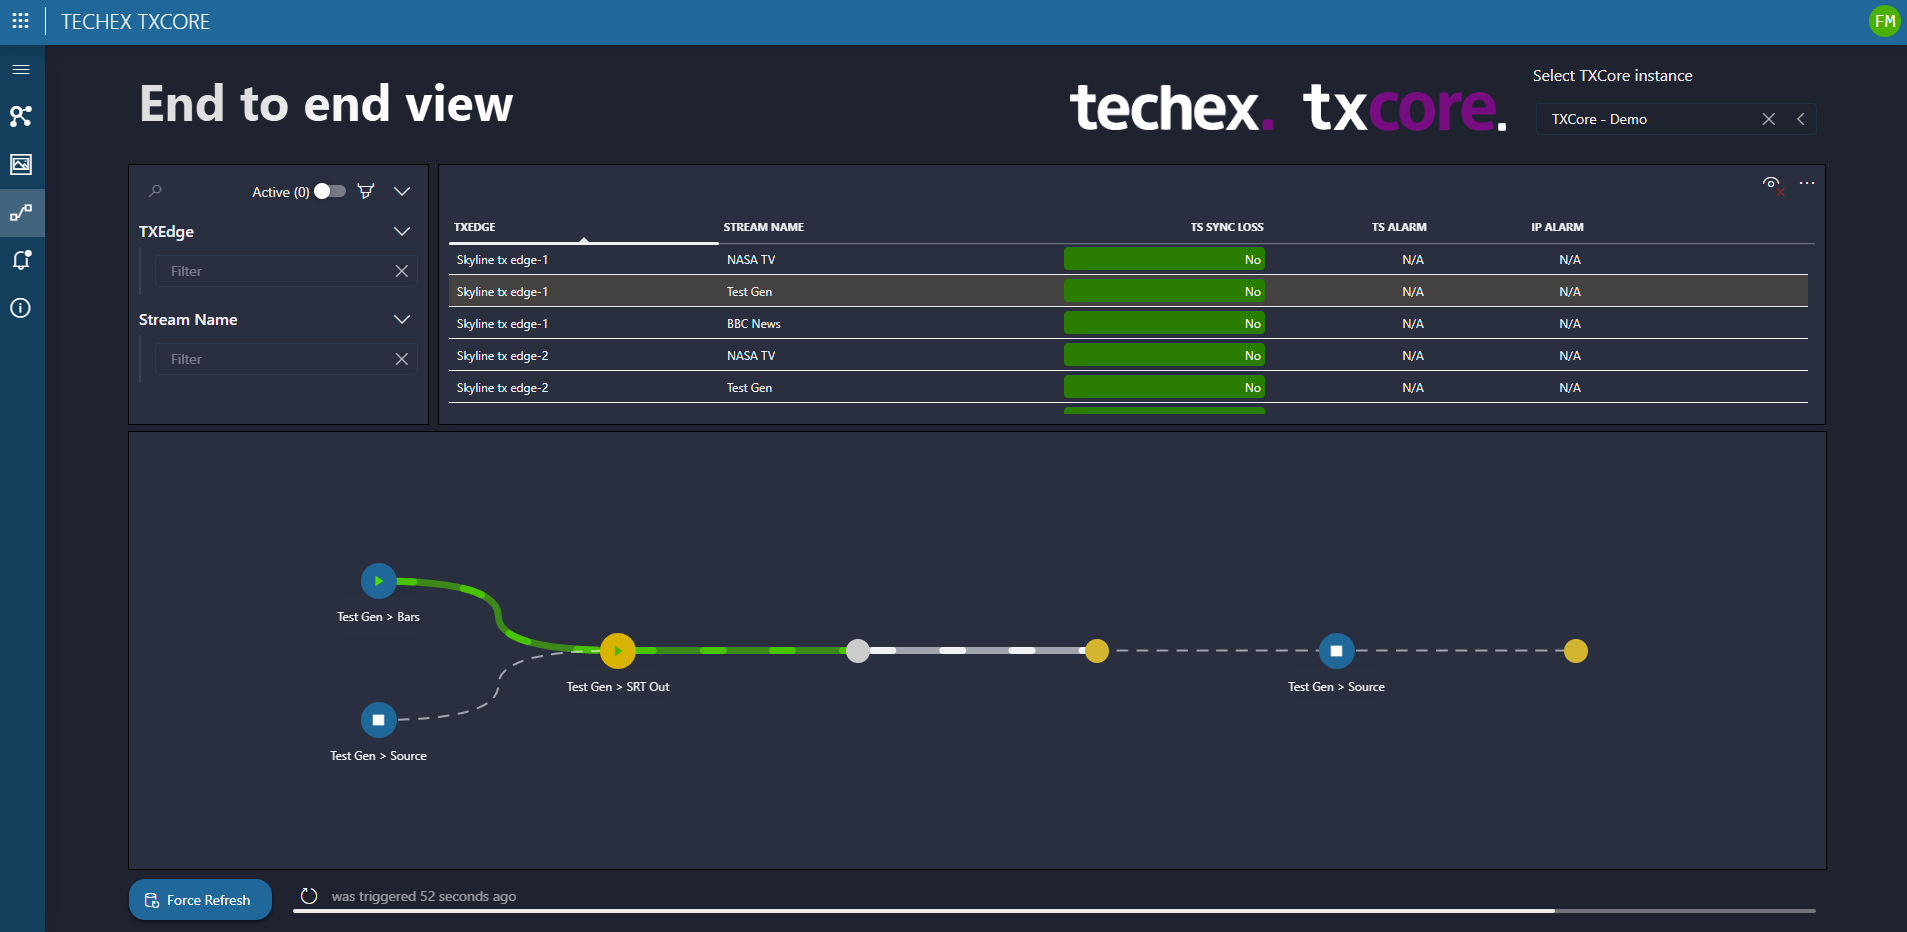 What sets this app apart is the end-to-end view. DataMiner automatically calculates the connectivity of each service across multiple tx edge instances, making it incredibly convenient to track your streams from their source all the way to their final destination. Additionally, we've incorporated controls to stop and resume streams or trigger failovers.
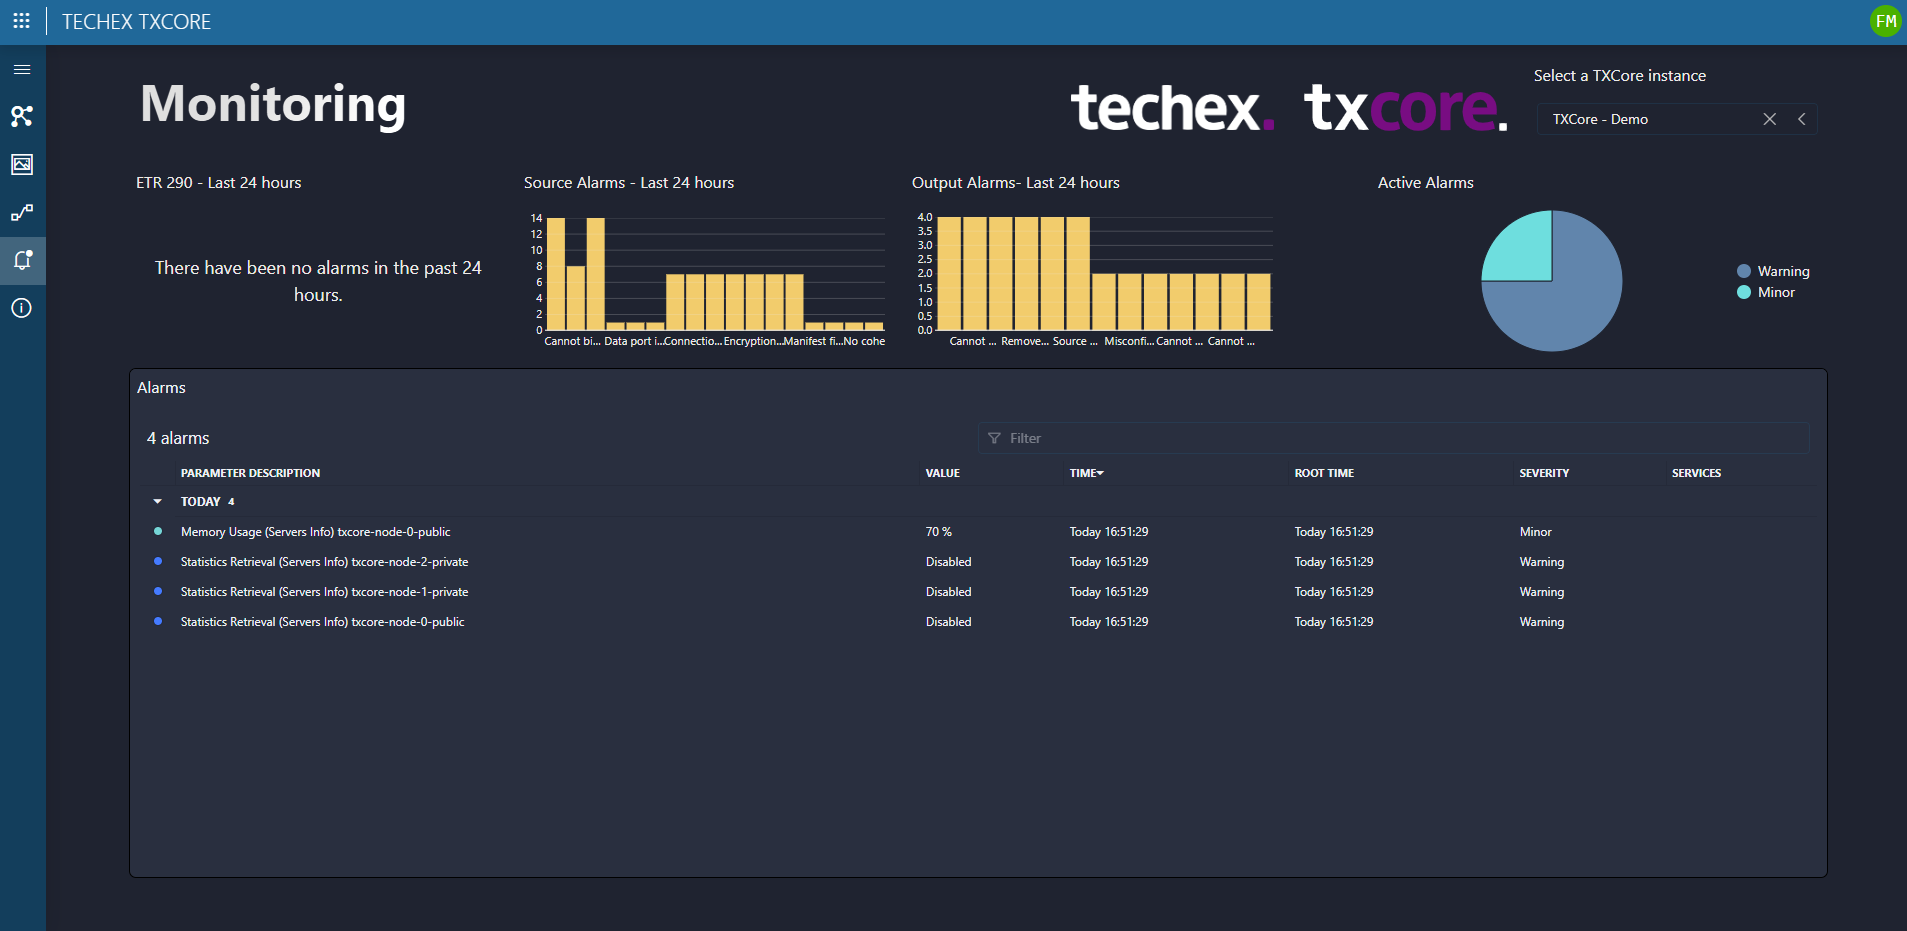 The Monitoring page provides a comprehensive overview of all existing alarms, including those from the past 24 hours for ETR290, sources, and outputs.
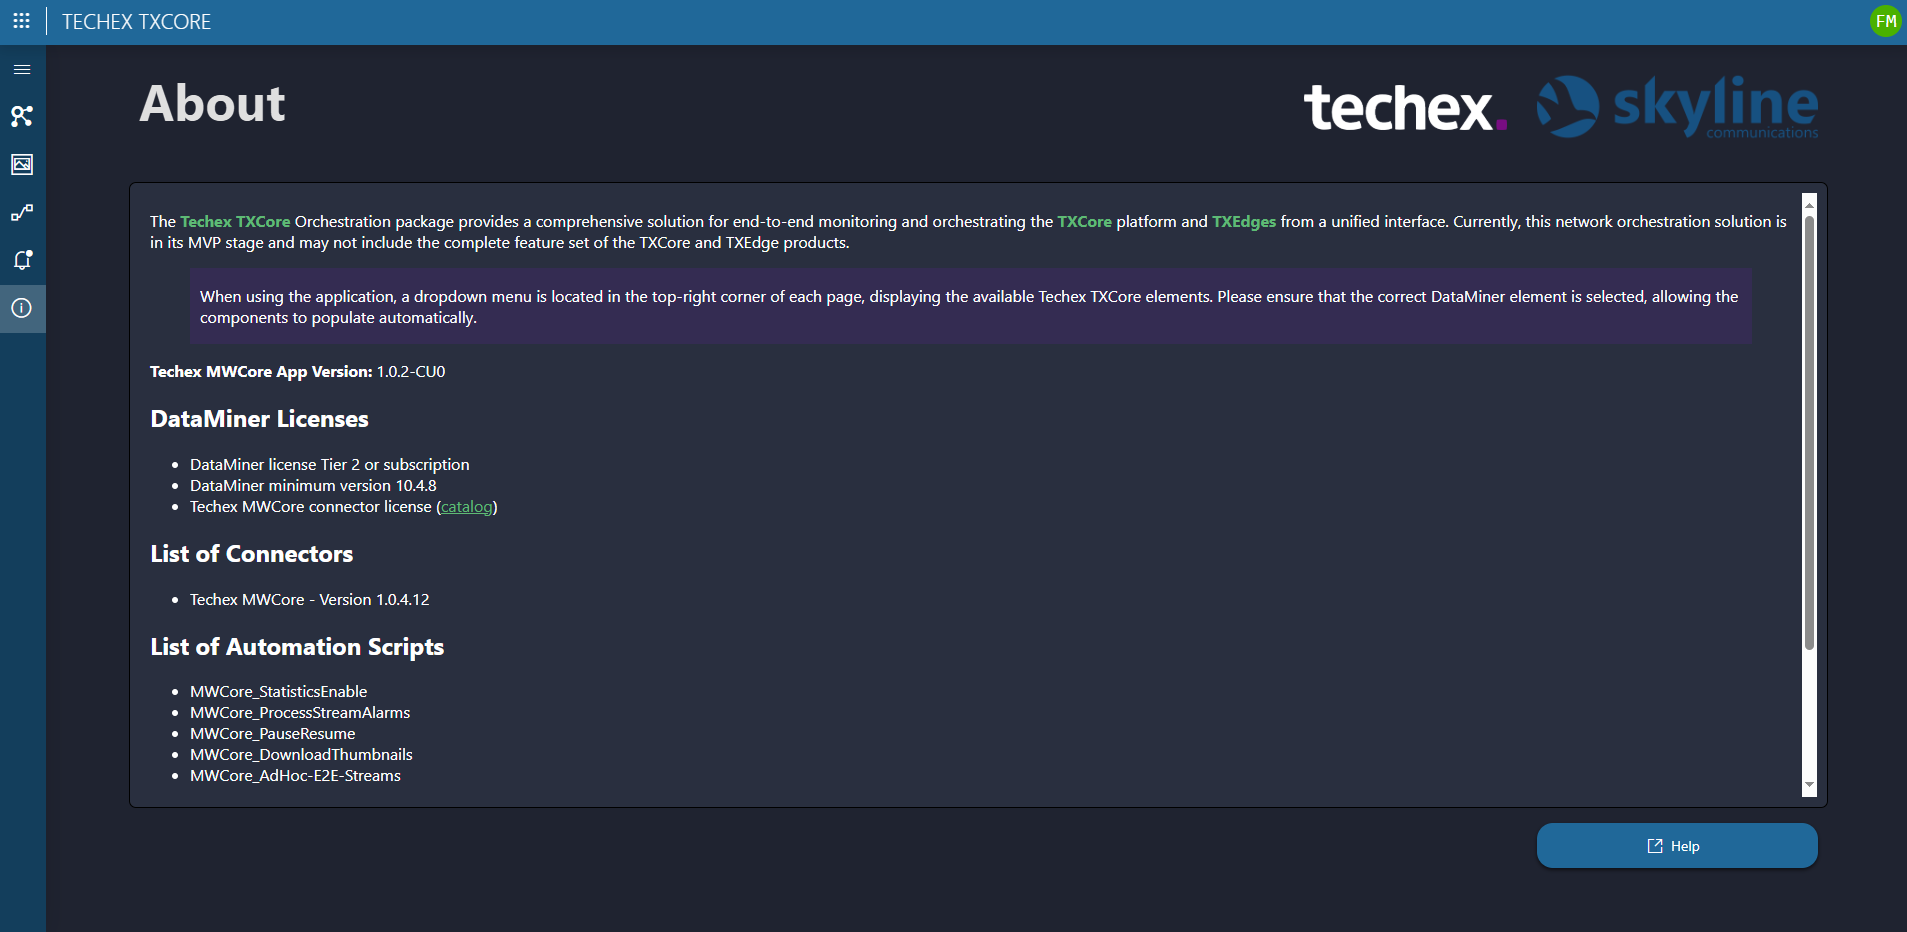 The About page offers a concise overview of the app's requirements and initial setup process.