example Use Case
Live Dashboard Sharing (Skyline Tech Partners)
Cloud
Arista
Cisco
Telestream
Riedel
AviWest
NetInsight
AppearTV

With DataMiner Live Dashboard Sharing, it has never been easier to share live data with just about anybody—instantly, effortlessly, and on the fly through an end-to-end secured connection. This use case shows examples of dashboards shared by our technology partners, for example from their labs across the world or straight from a trade show. How can you share dashboards too? Just connect your DataMiner System to the cloud! Skyline offers multiple tiers of Cloud Platform Services, from a basic to a full enterprise license.
USE CASE DETAILS
 Telestream: Summary dashboard showing the overall health state of a Telestream ecosystem, e.g. Inspector Live, Prism, SPG8000, IVMS & Surveyor.
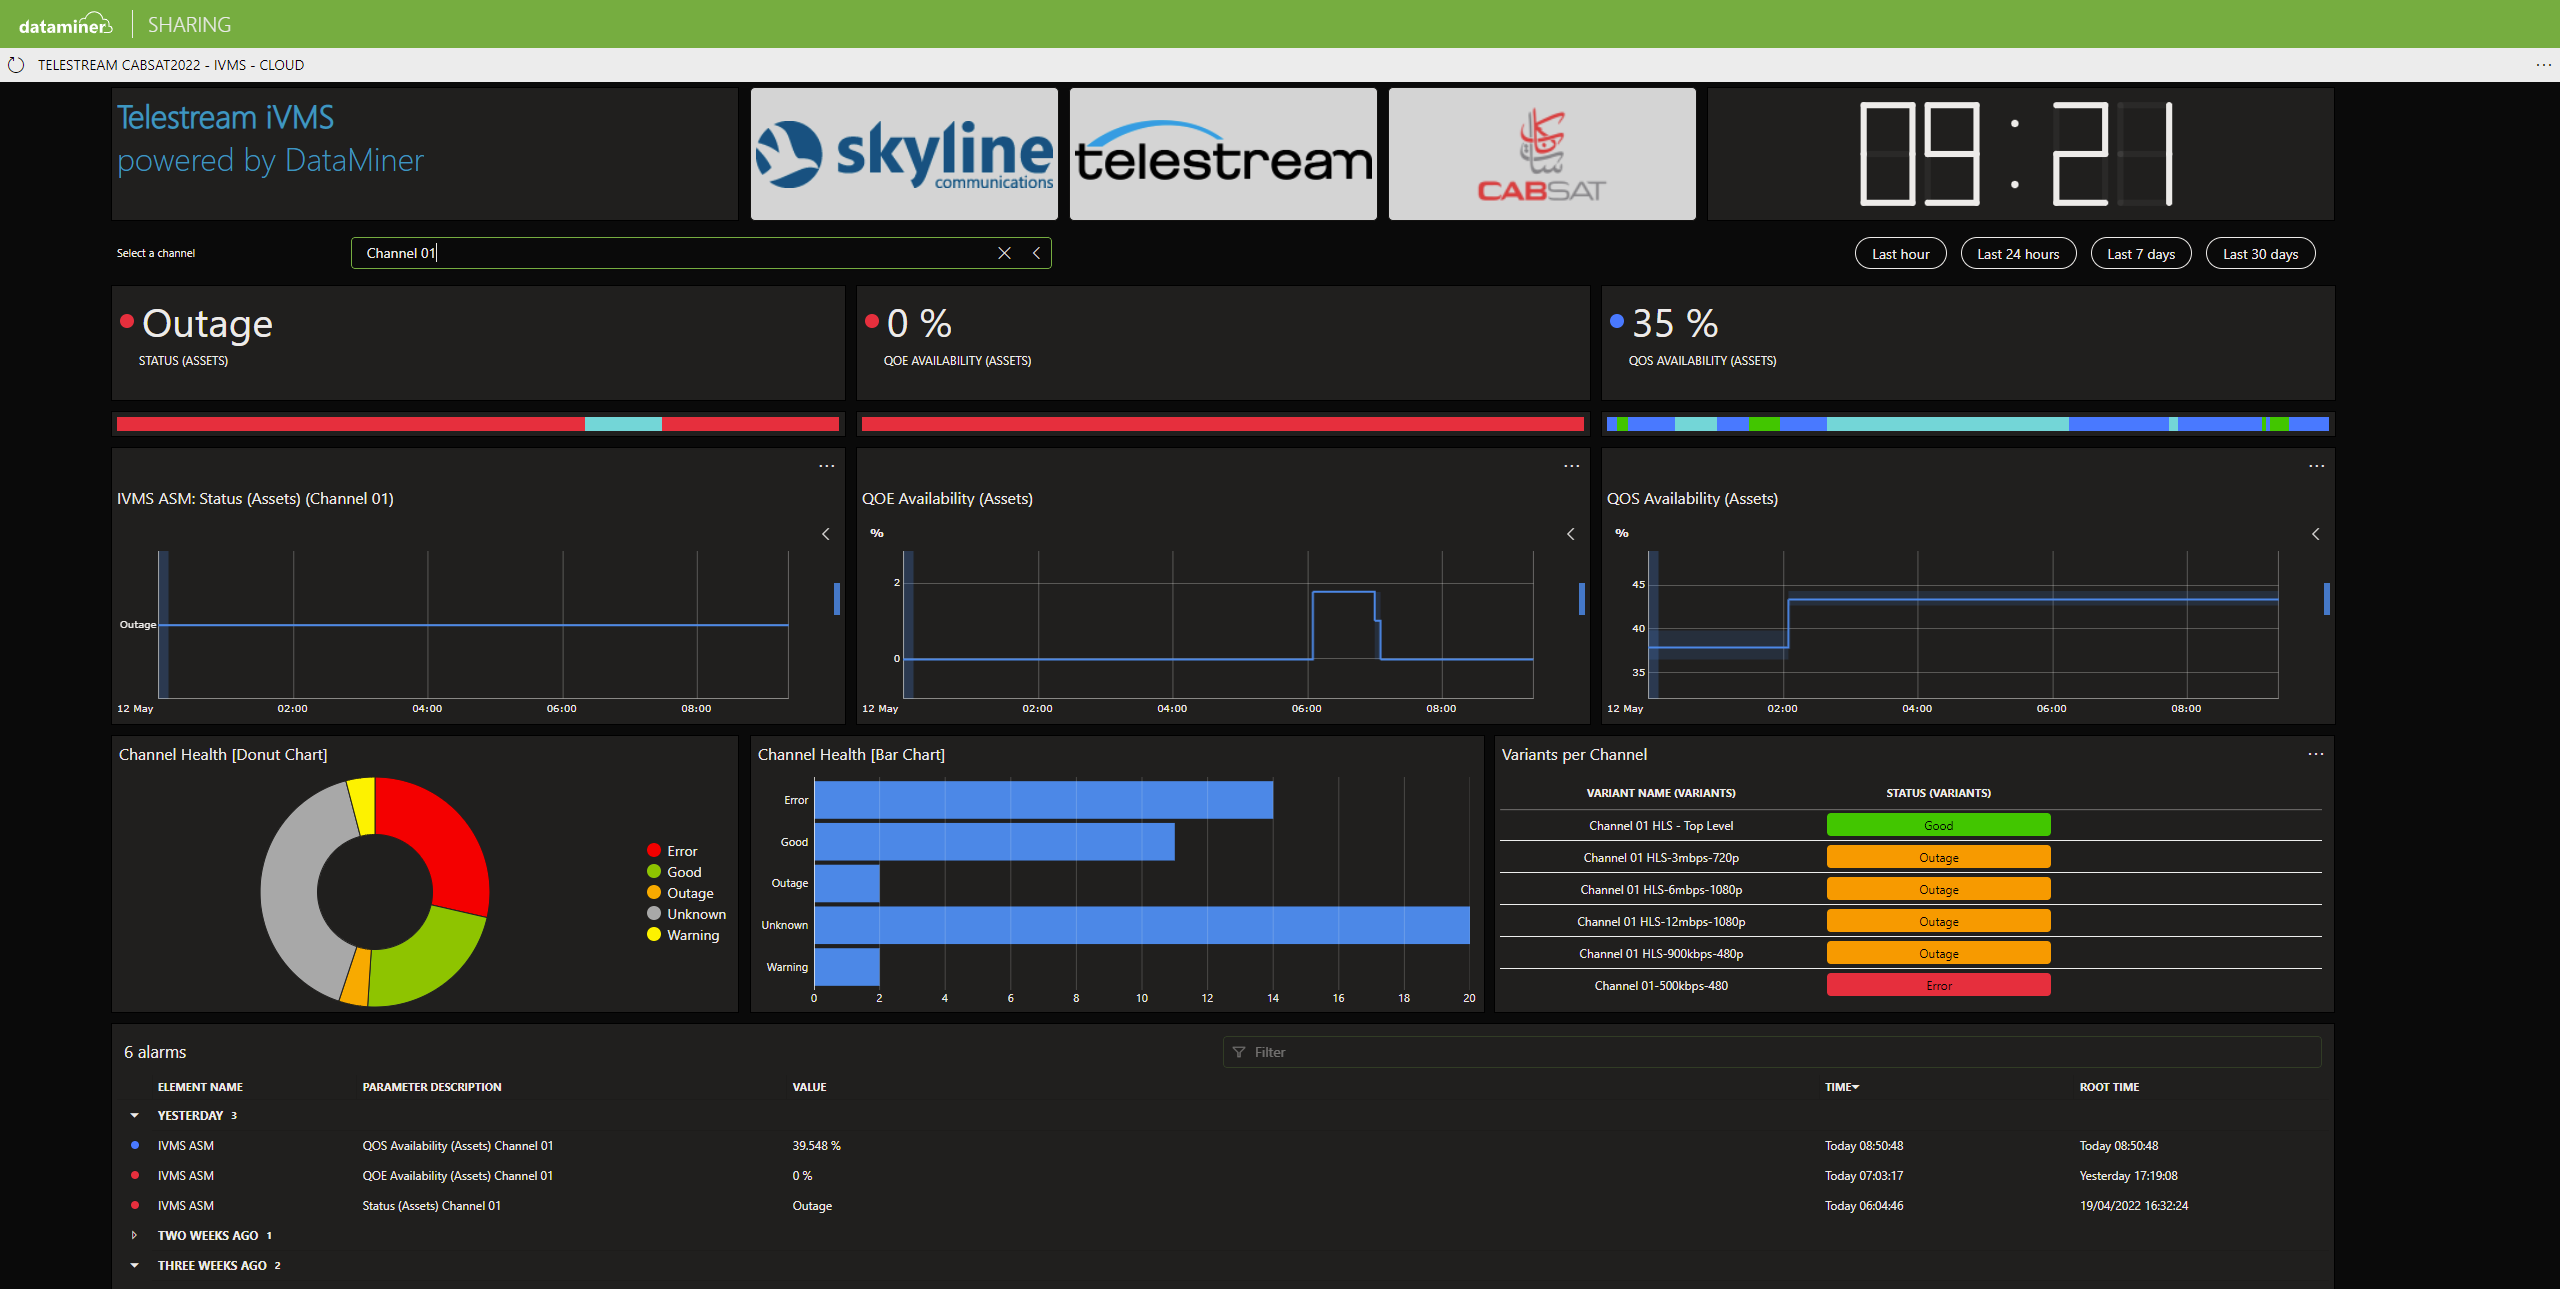 Telestream IVMS ASM: Select a channel and immediately get the most important metrics and KPIs, such as overall channel state, QoE and QoS availability, alarm details, and the health state of each variant per channel.
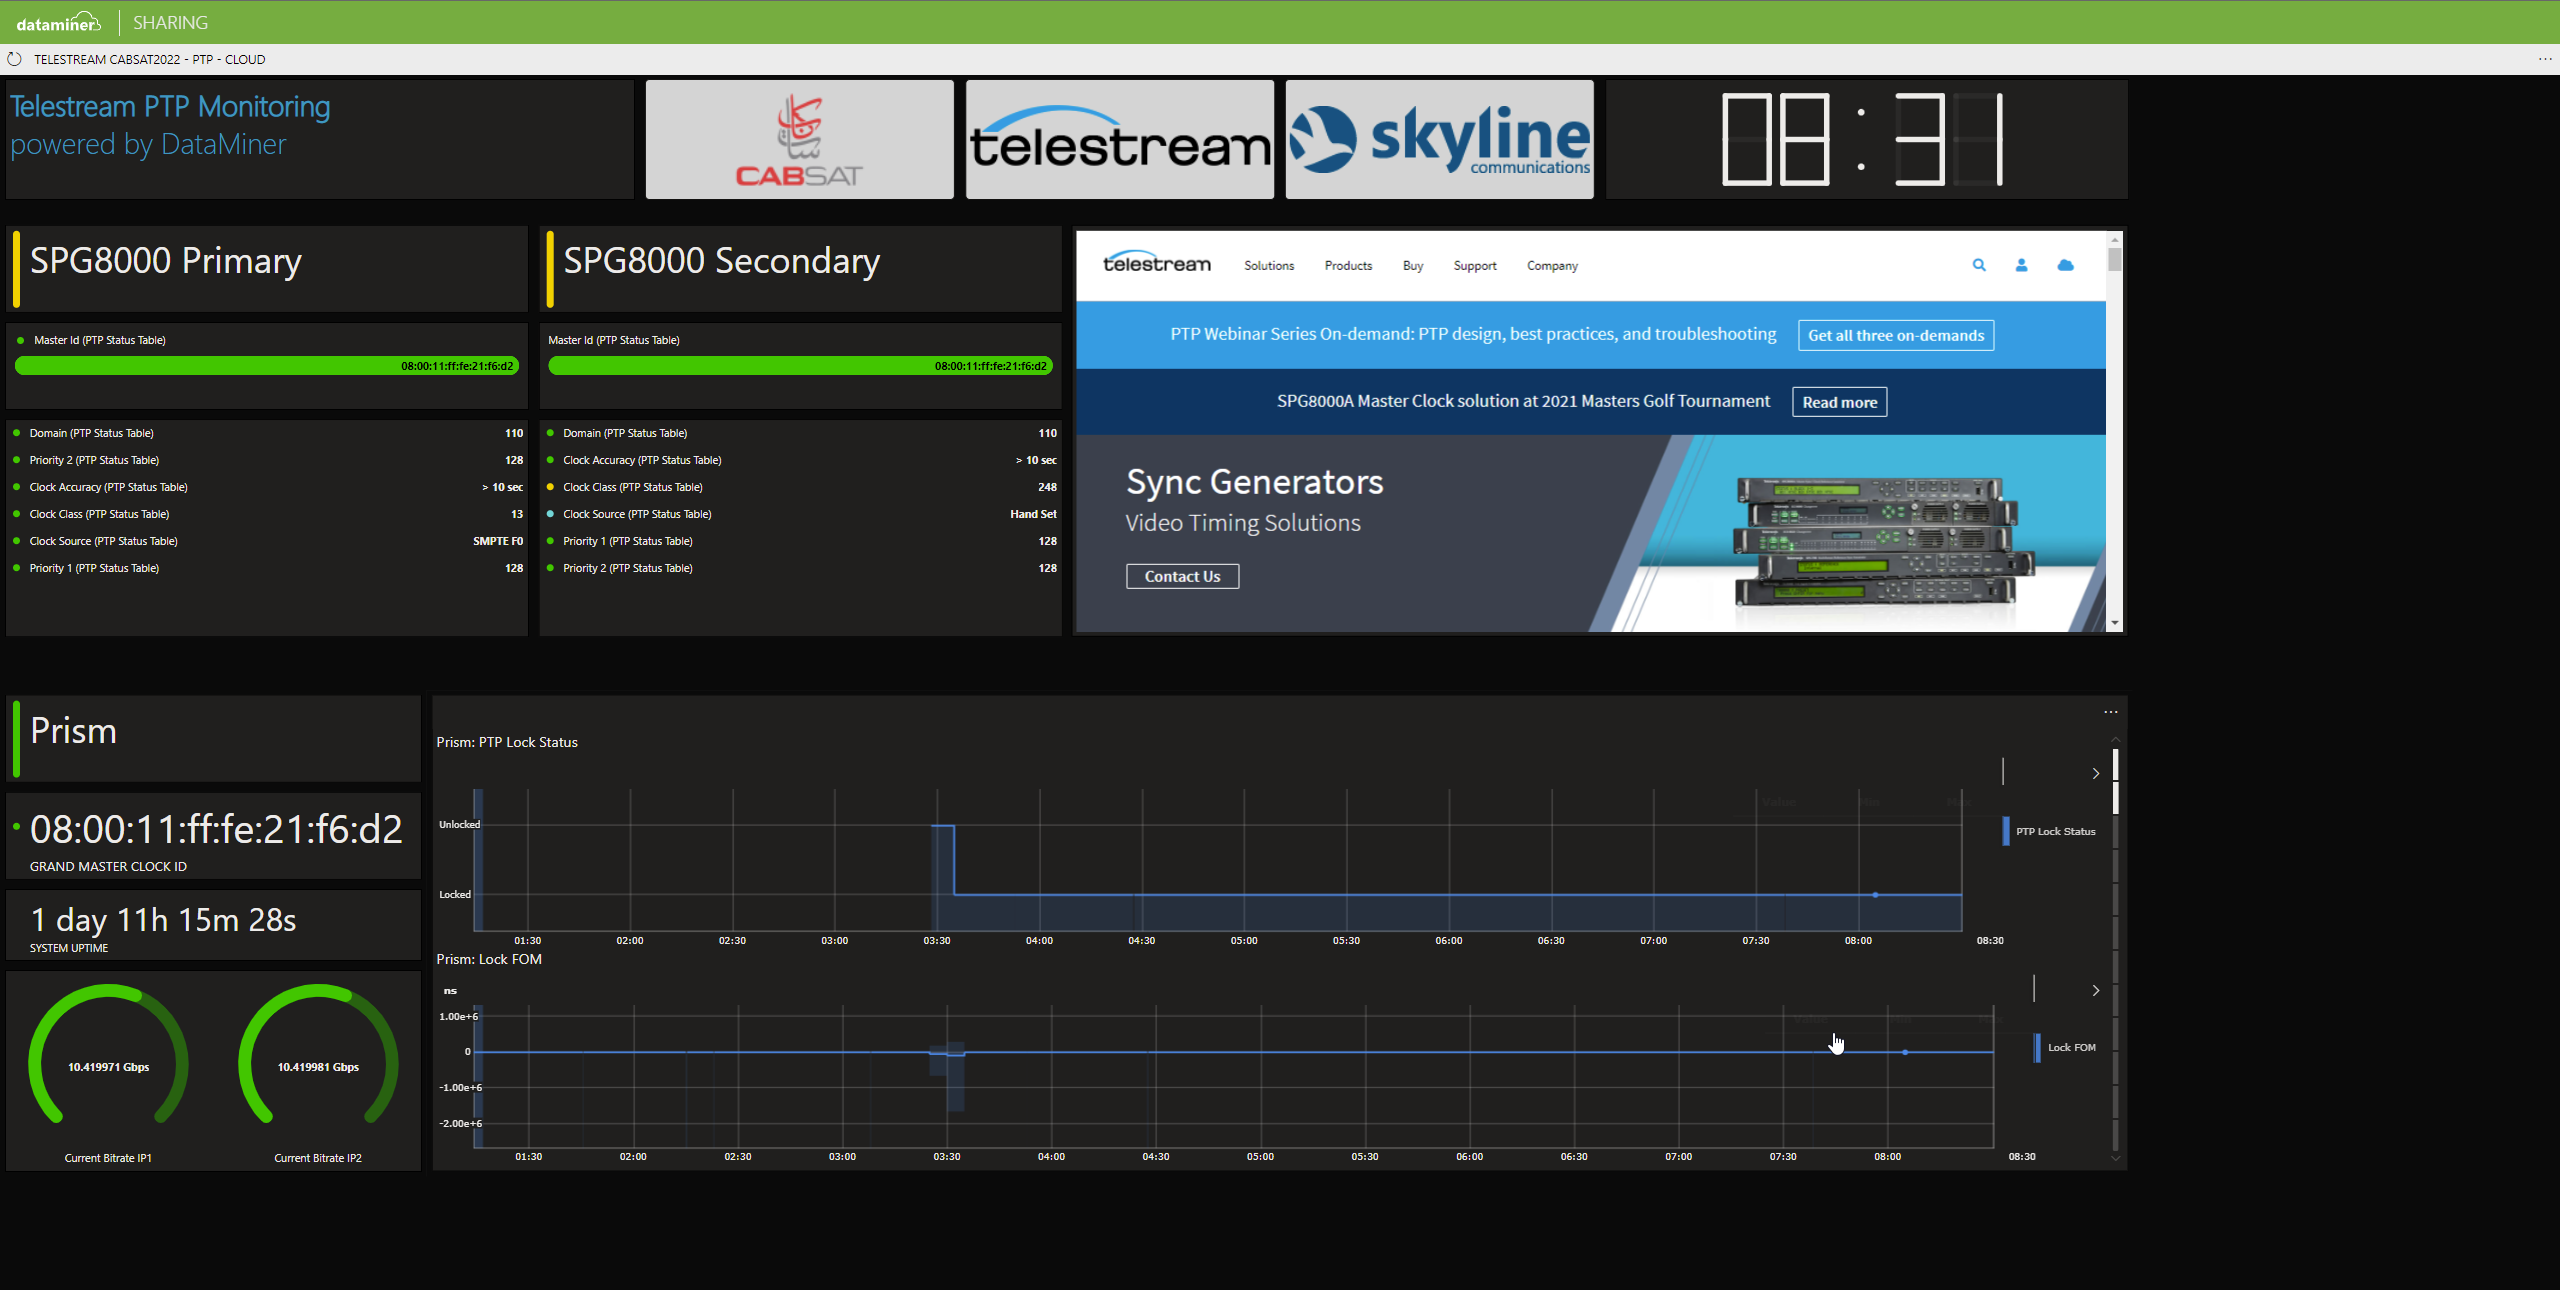 Telestream SPG8000 & Prism: Manage your Telestream PTP Grandmasters and PTP Analyzers. Here you can easily check if your primary and secondary PTP Grandmaster are locked to GPS and have the correct BMCA settings (e.g. domain and PTP priorities). Prism reports PTP metrics such as PTP lock status over time. As you can see, any website can be embedded in a DataMiner dashboard as well.
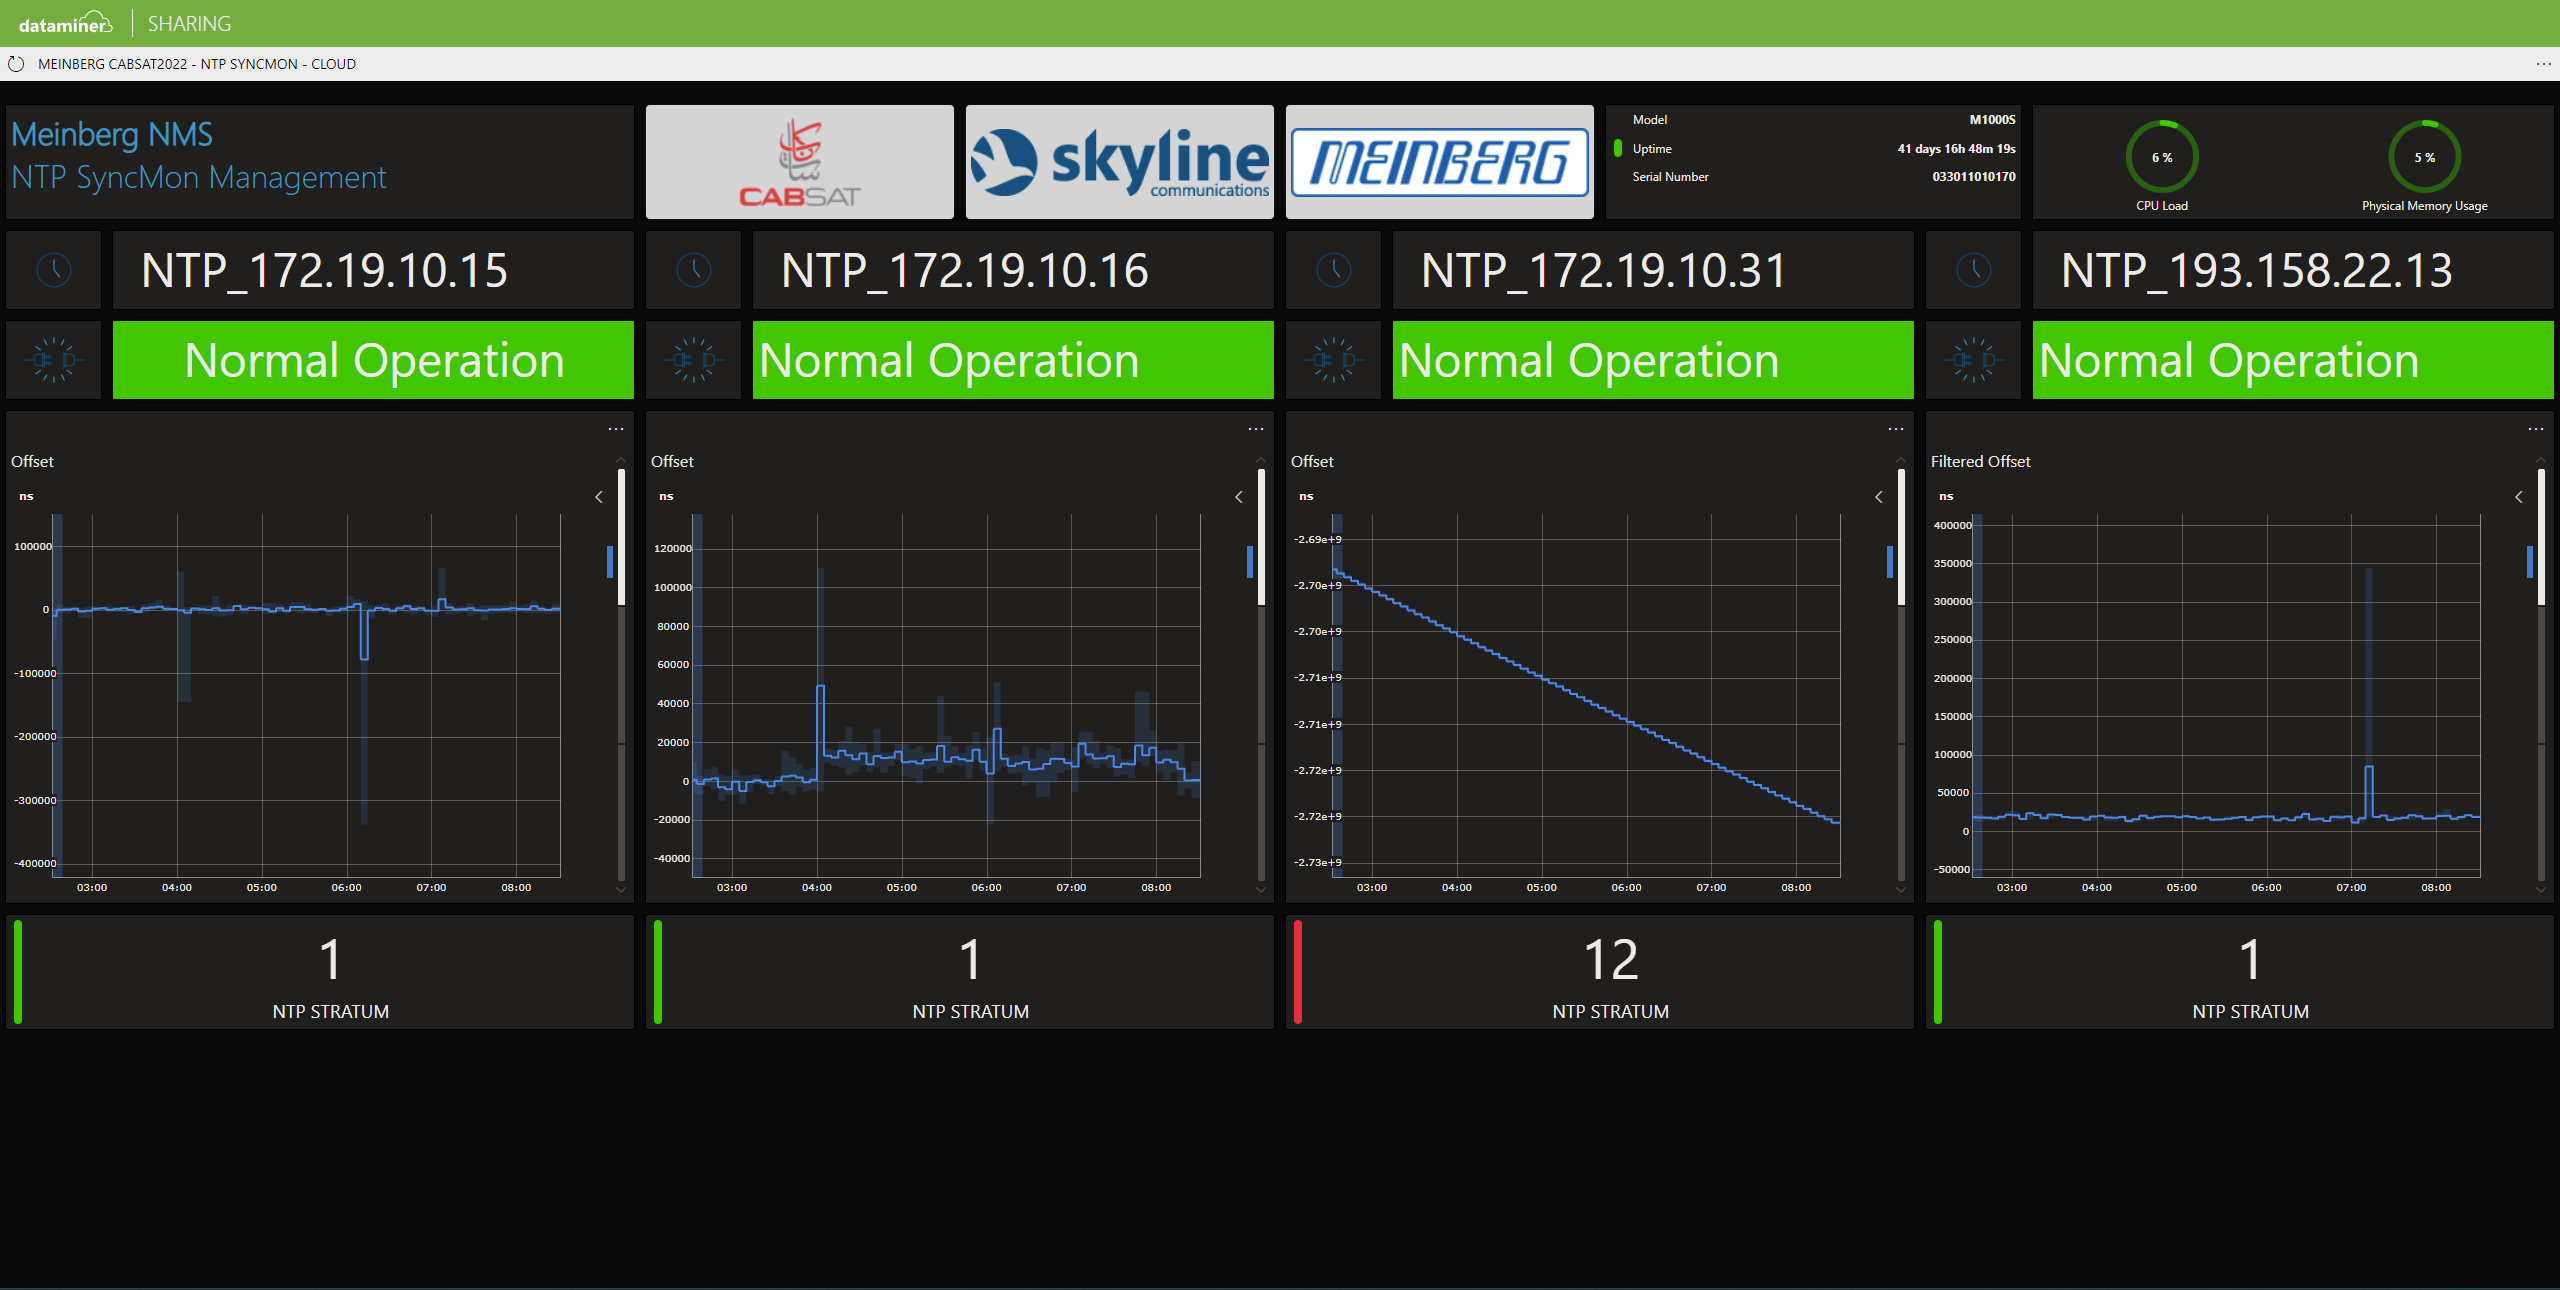 Meinberg LANTIME: Multiple NTP SyncMon devices constantly check NTP quality in the network. You can check offset, filtered offset and delay trend graphs. As you can see, in this case there is one SyncMon device reporting a bad NTP stratum value.
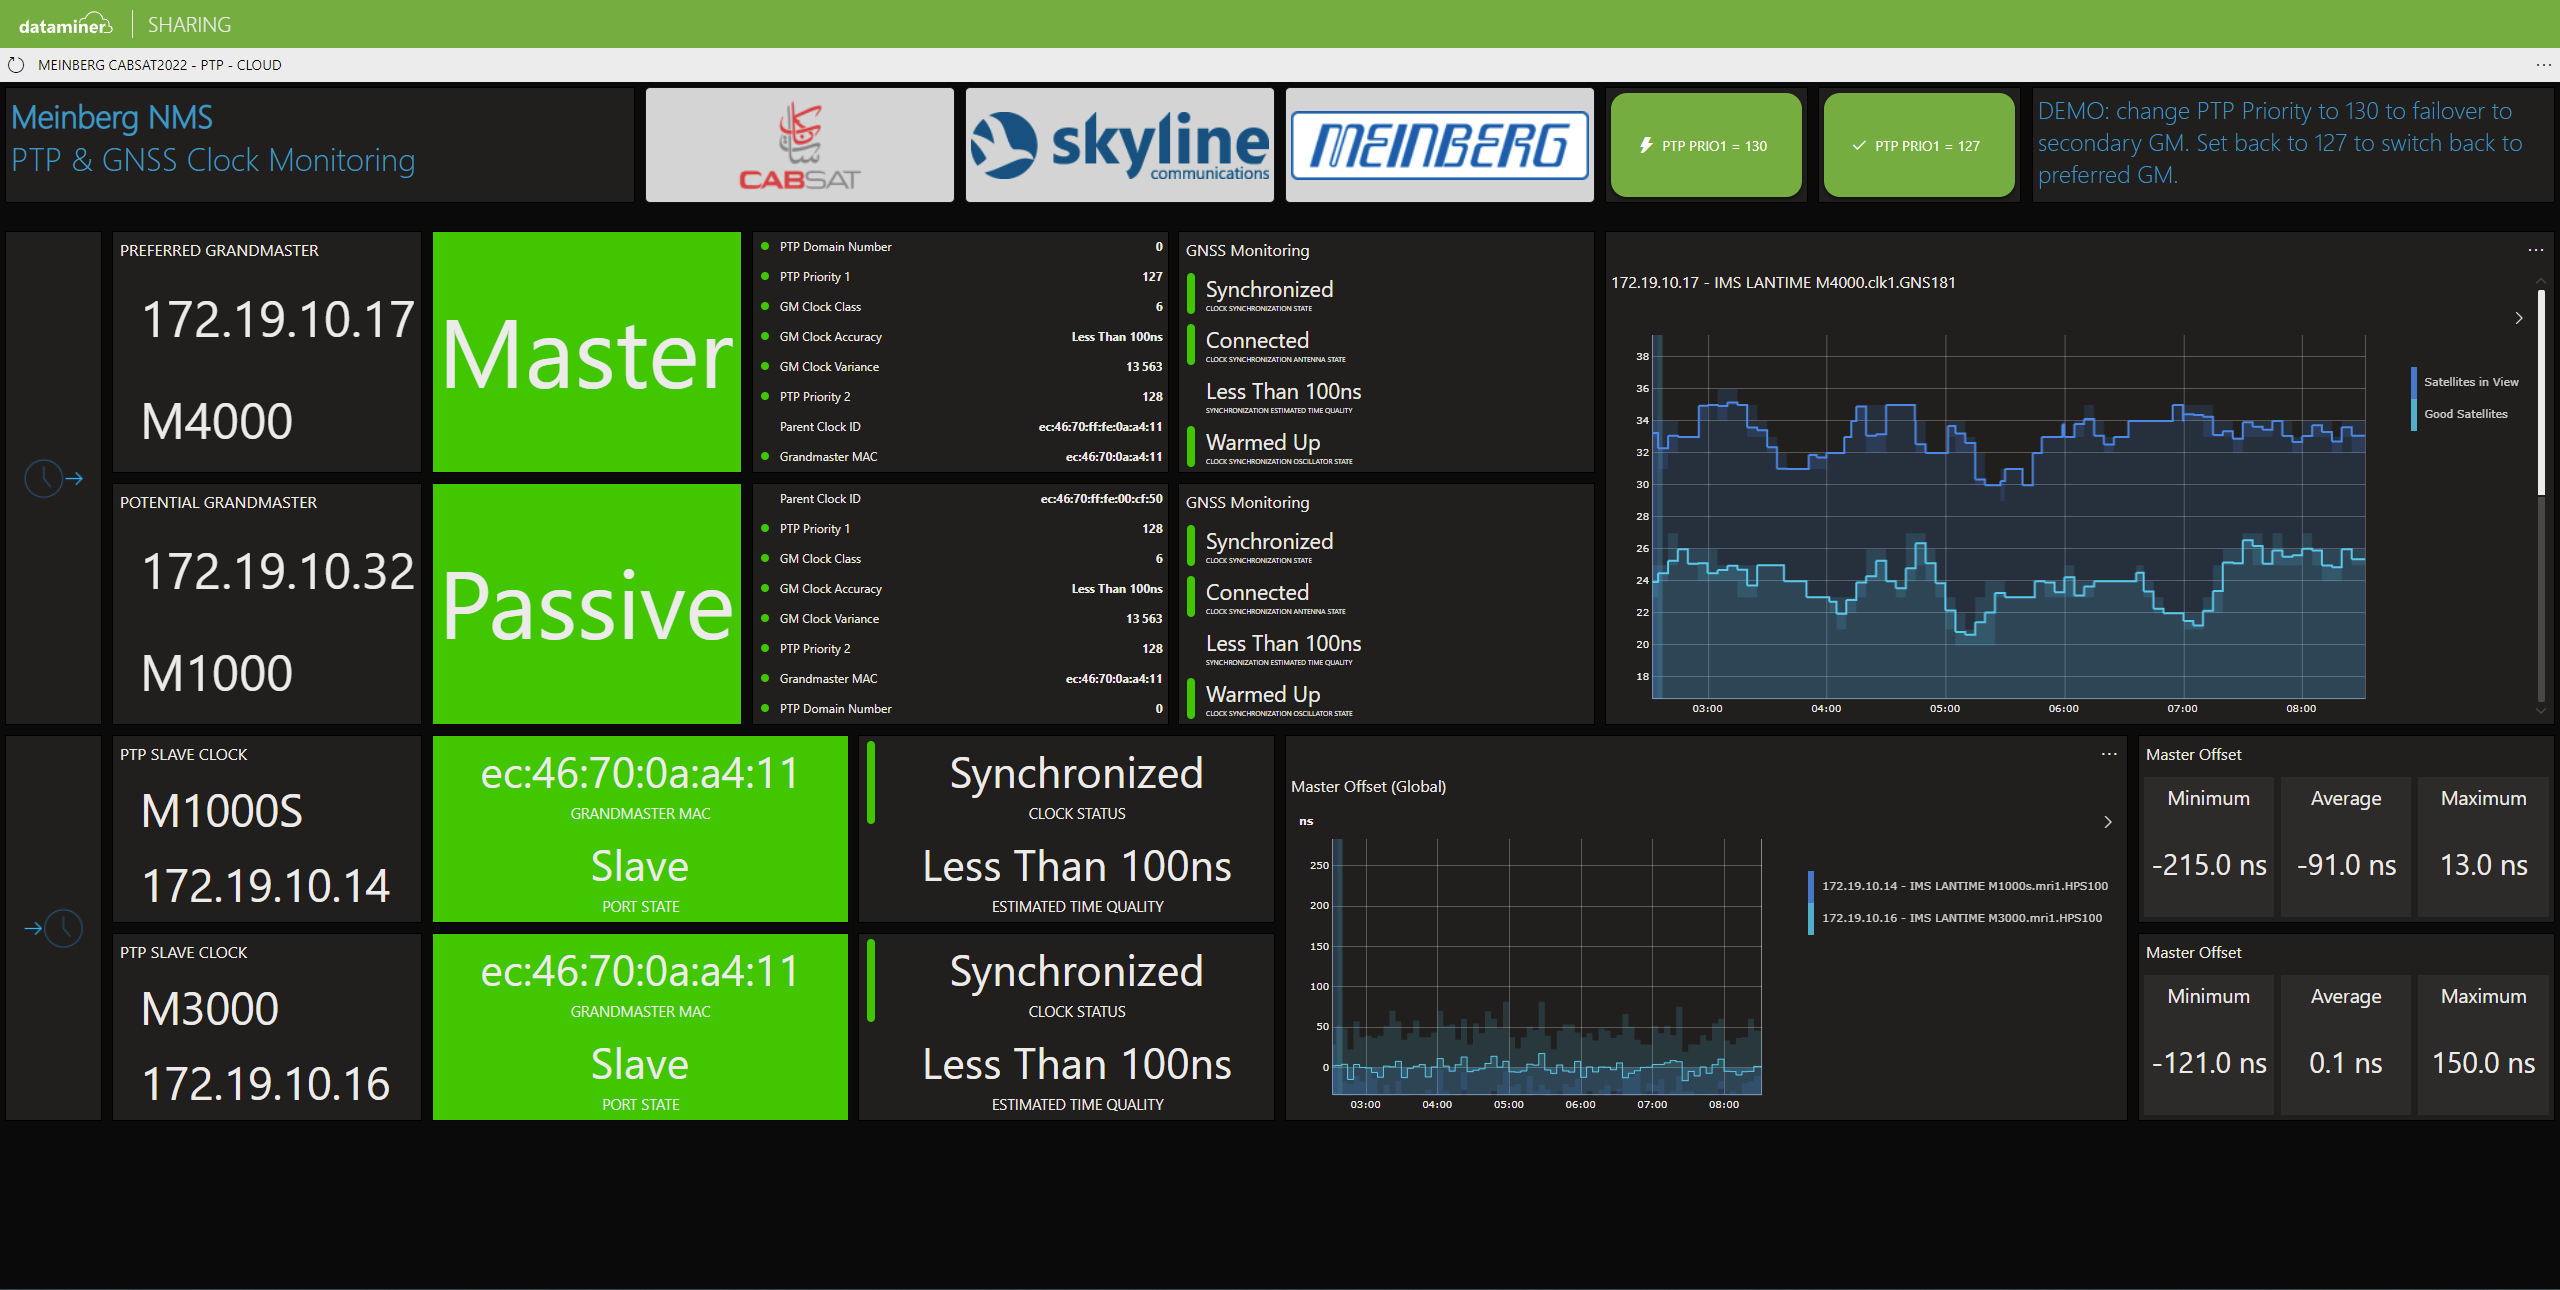 Meinberg LANTIME: This dashboard can not only be used to monitor PTP master and slave devices but also gives control. Changing PTP priority on the current master will initiate a PTP failover.
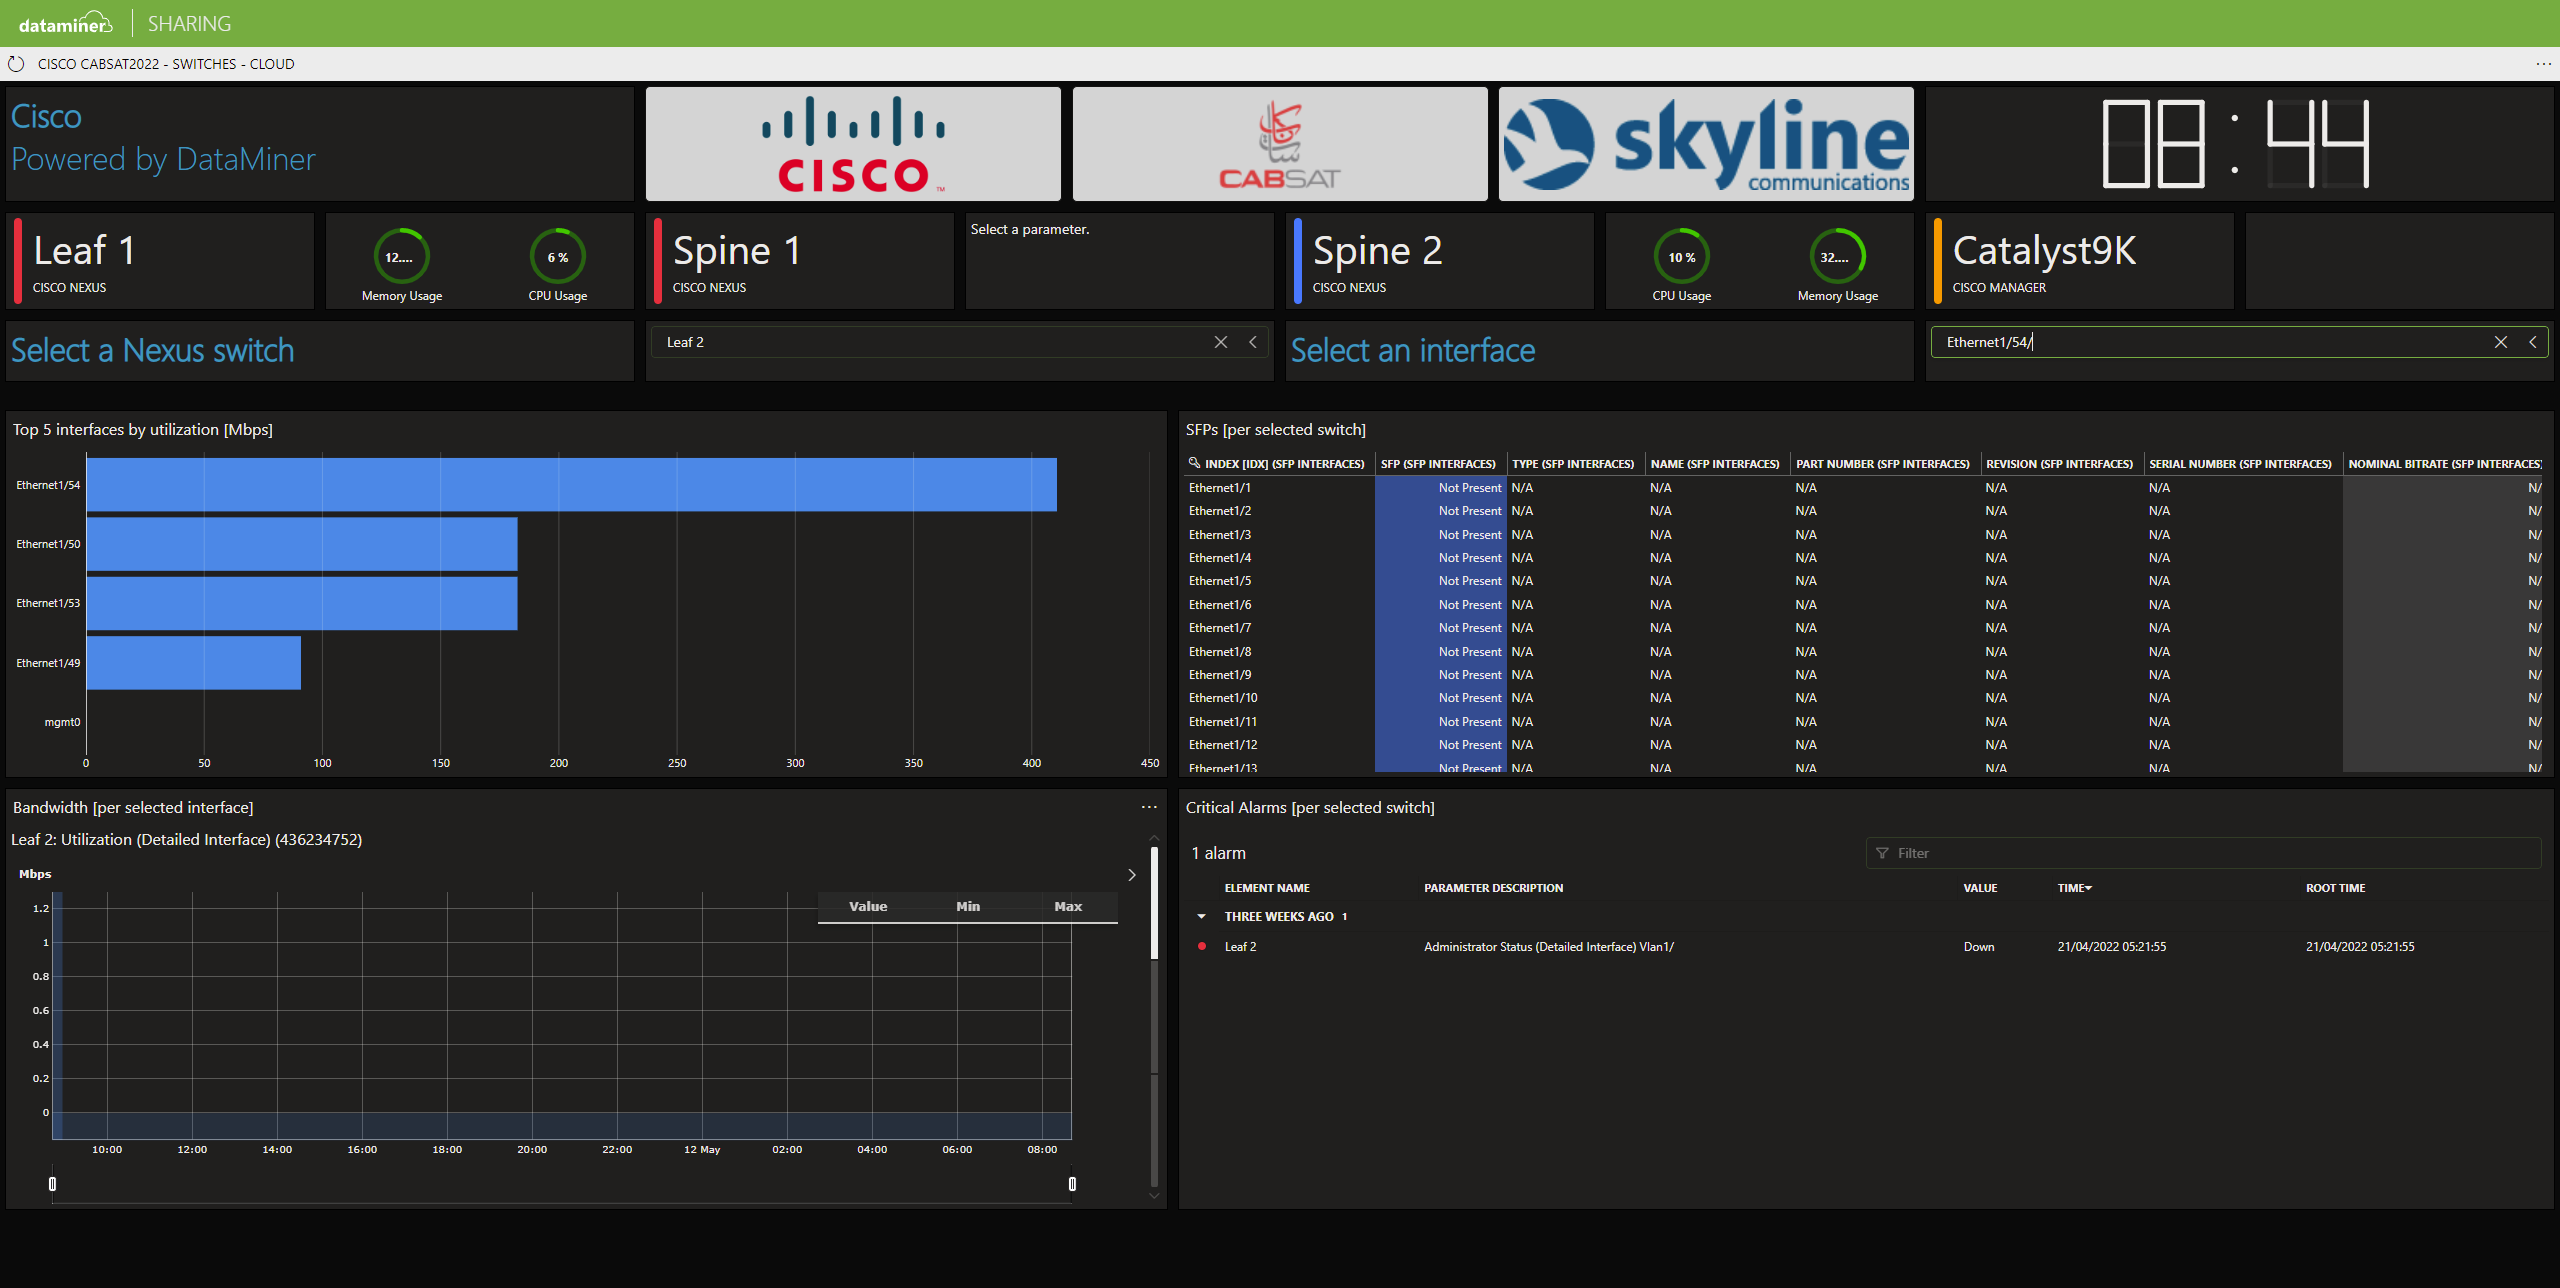 Cisco: Nexus and Catalyst switches monitored by DataMiner. Just select one of the Nexus switches from a spine-leaf network or a Catalyst switch that is used for the management network, and then select an interface to check details.
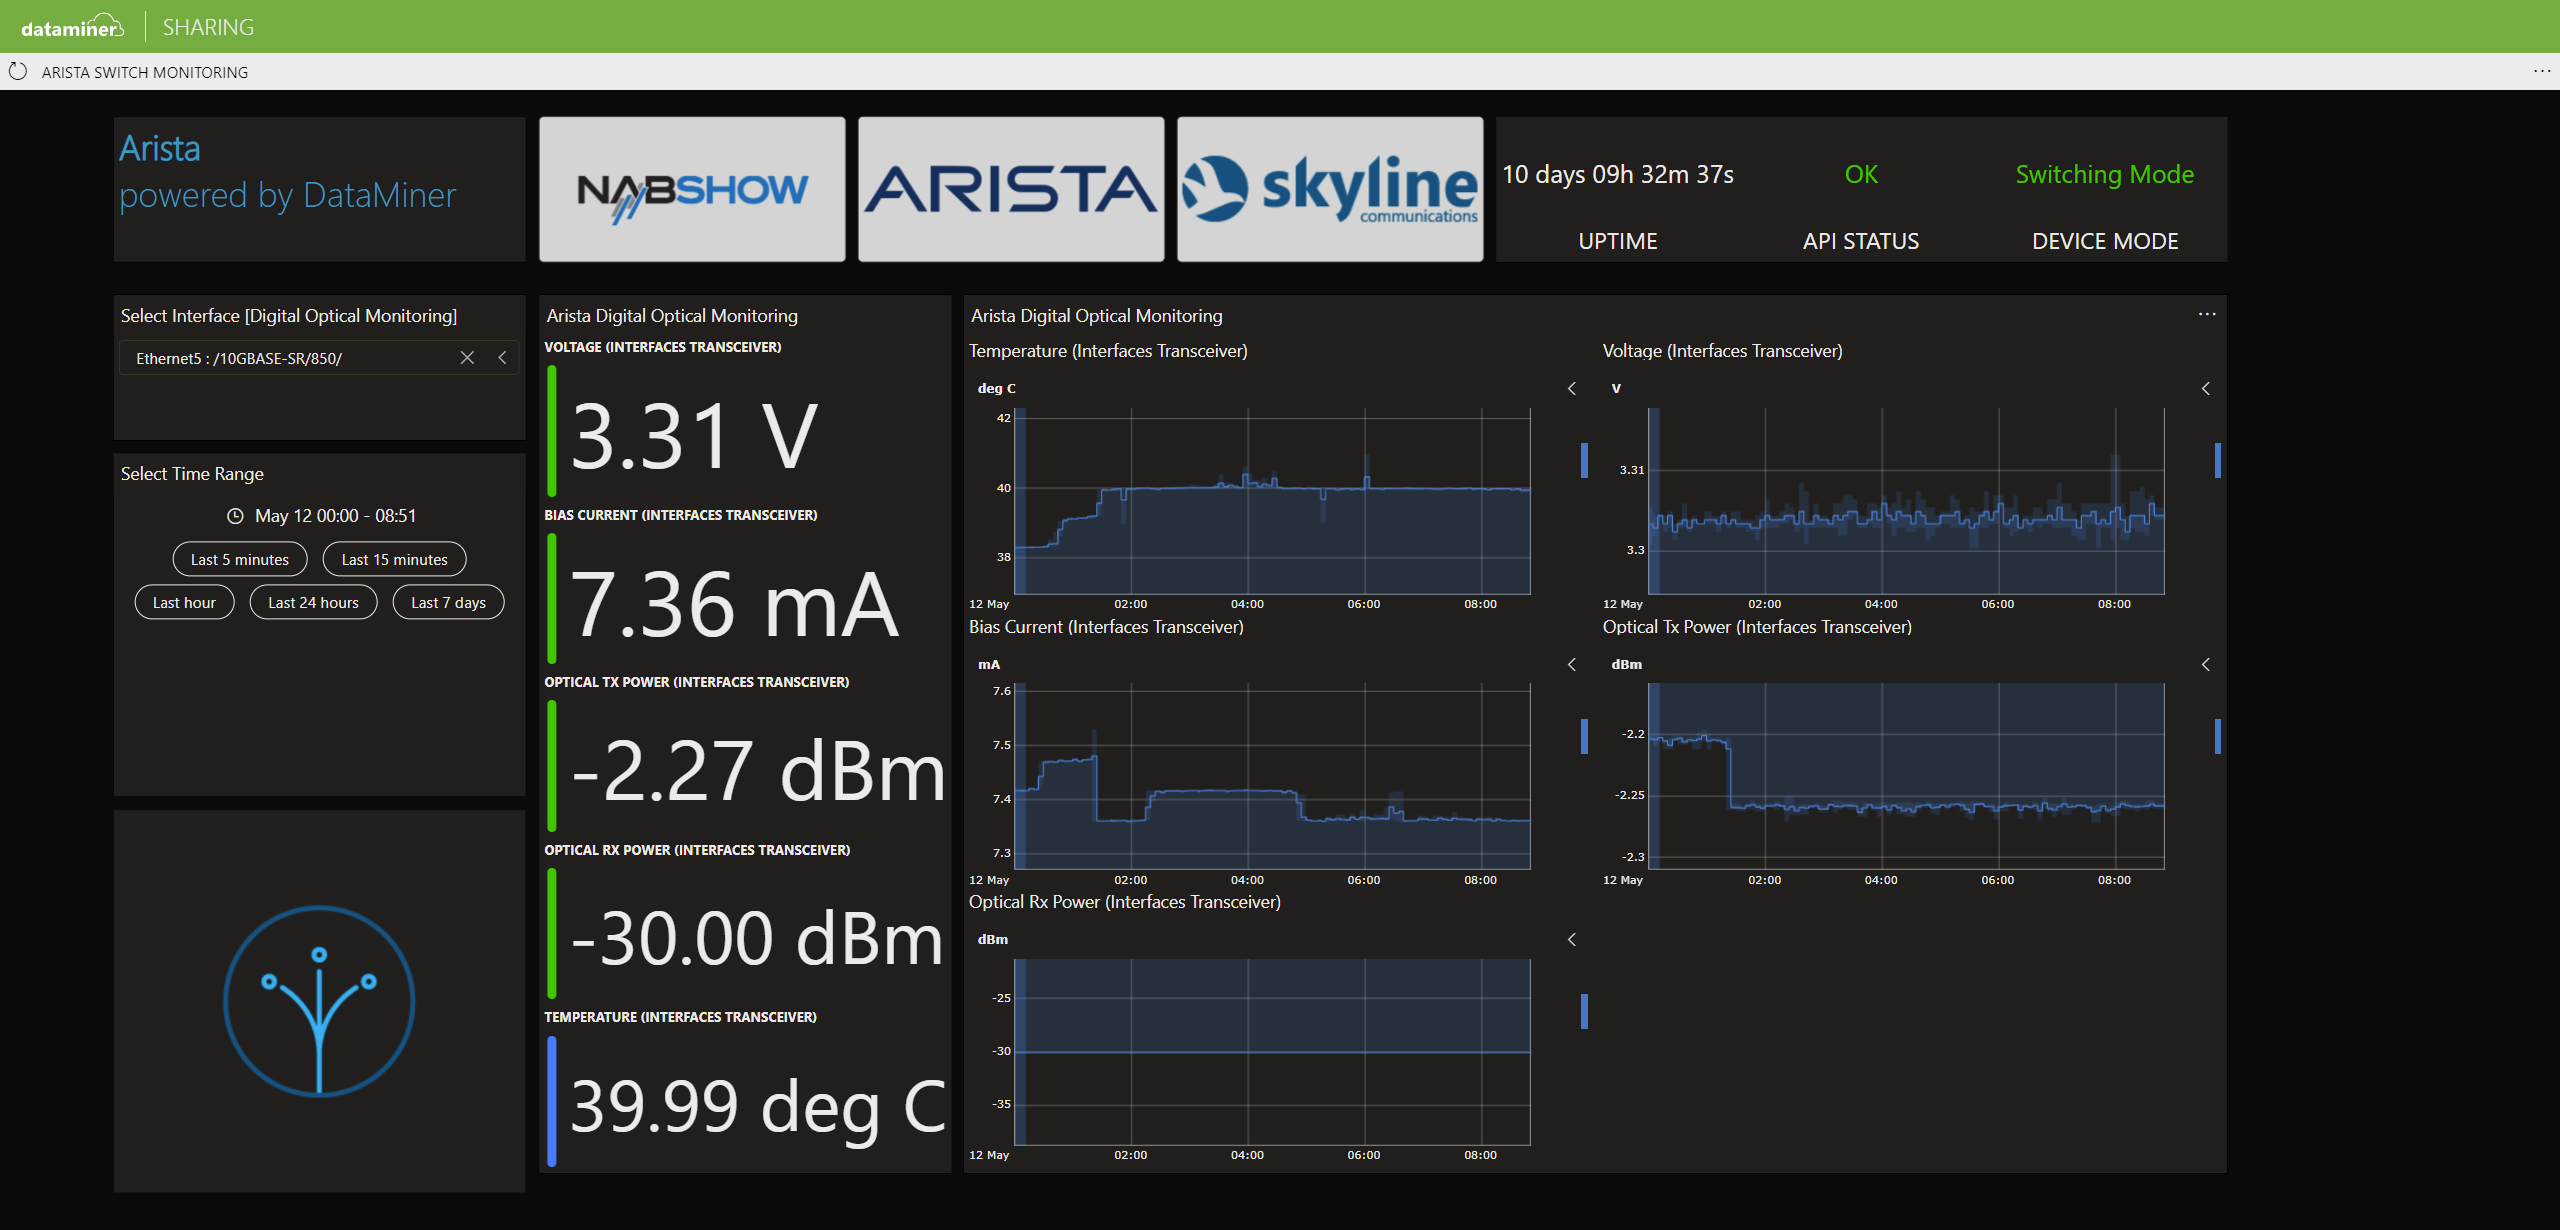 Arista: SFP Digital Optical Monitoring (DOM) dashboard. Just select a switch port, and you will immediately see the current voltage, current, optical RX/TX power, and temperature, as well as its behavior over time.
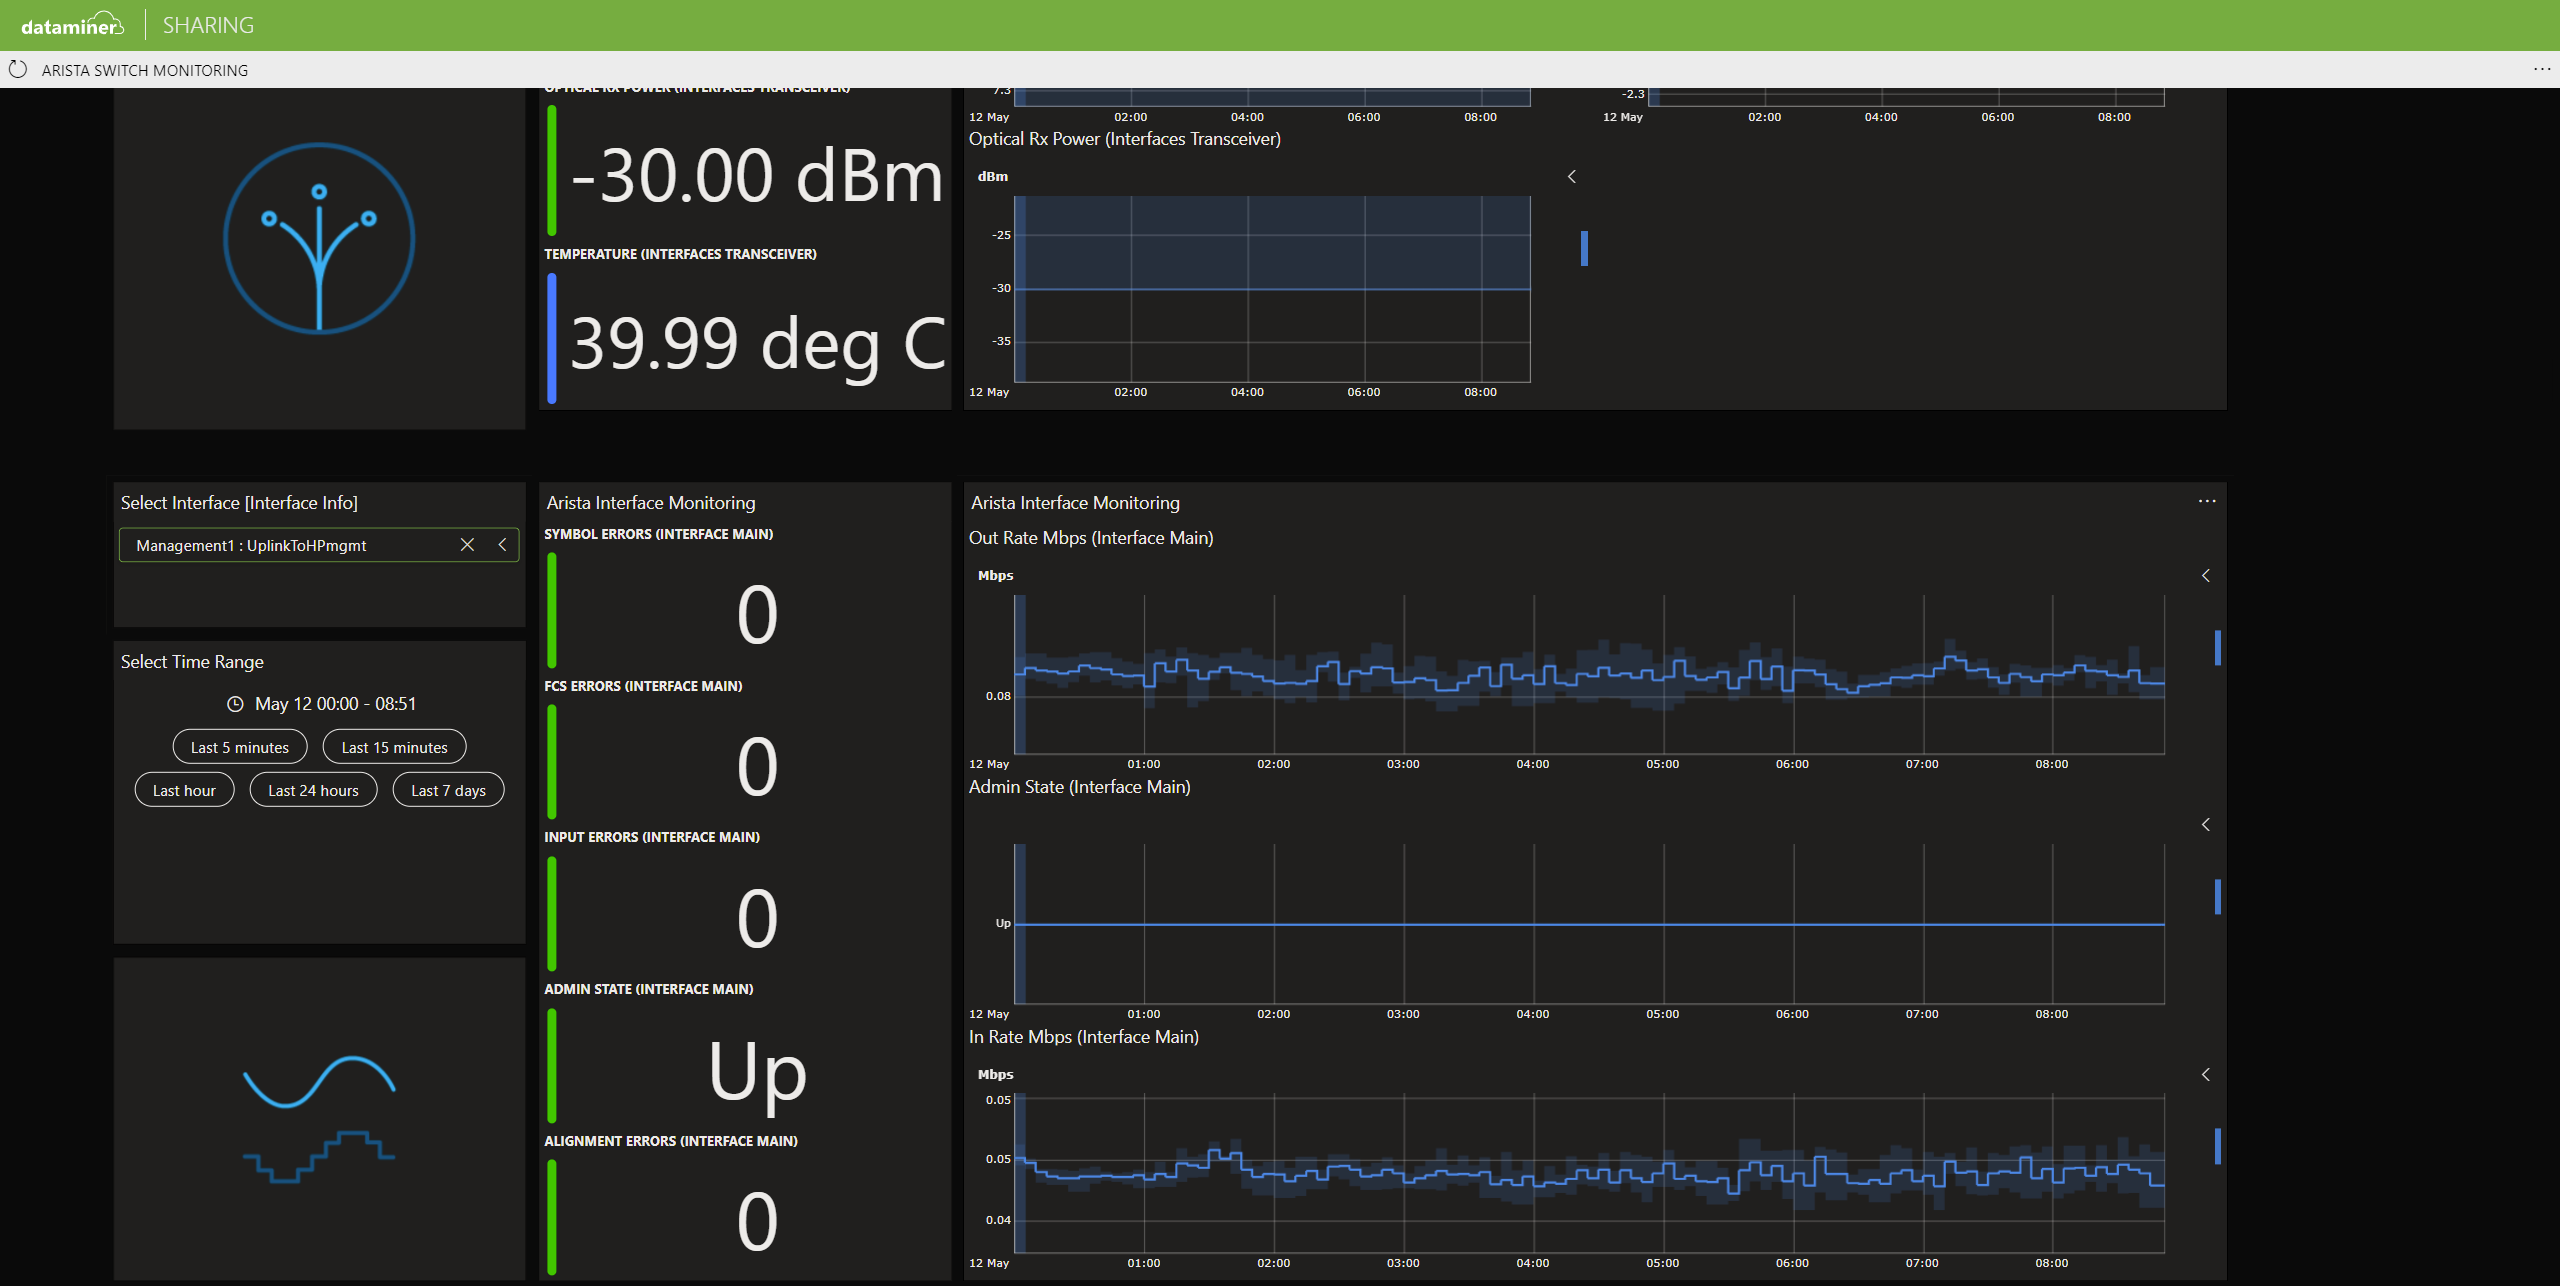 Arista: Scroll down to retrieve interface parameters, for example IN and OUT rates as well as error counts.
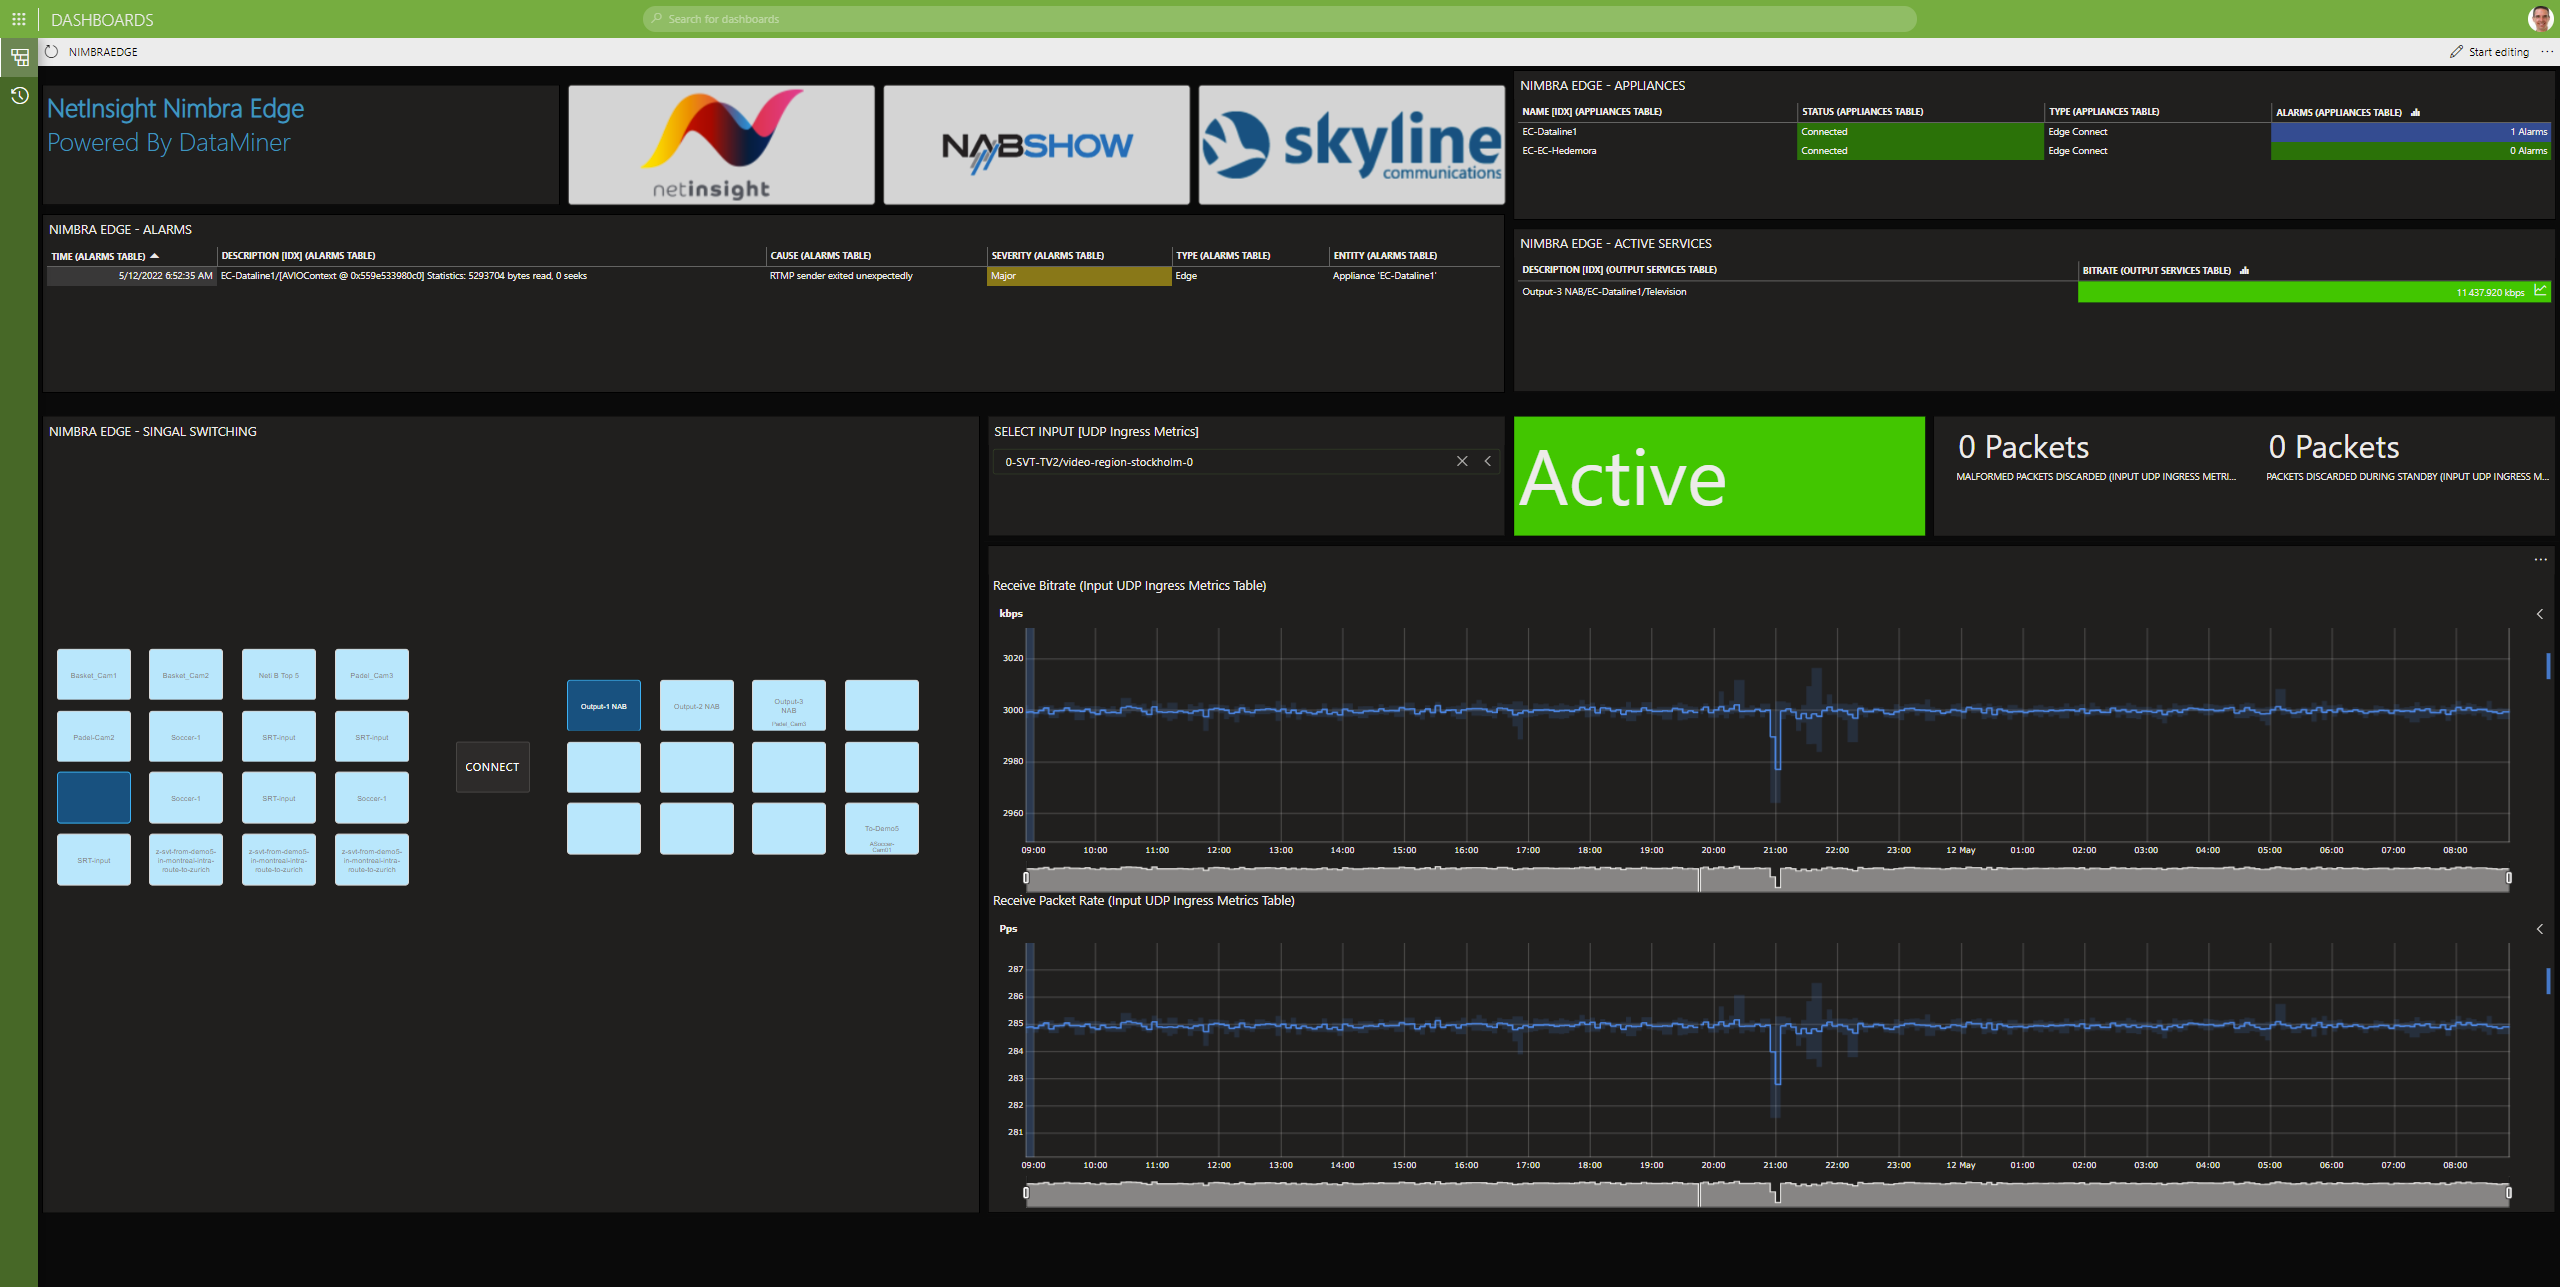 NetInsight NimbraEdge: Monitor and control NetInsight's NimbraEdge cloud-based media platform. Get access to all stream metrics, attached appliances, inputs, outputs (supporting TS, UDP, RIST, RTP, RTMP, ZIXI, SRT, TR101, etc.). This dashboard includes real-time controls. Like with an XY-router panel, just select your destination and connect any source stream to it.
 OpenConfig: This dashboard shows the differences between polling and on-change subscription for an Arista switch. Click the buttons to turn an interface on/off or to run a 3-min. demo where the interface state toggles every 10 seconds. With streaming telemetry, you will see near real-time data—and more importantly you will not miss anything—whereas with a polling cycle of 30 seconds and a toggle interval of 10 seconds some events will not be shown via polling.
 AviWest (HaiVision) StreamHub: Get access to all senders and receivers and their metrics, such as statistics on live streams and links. Or connect an input with an IP output to distribute your live video stream. You can also create your own live input: just download the MojoPro app for Android or iPhone and connect your phone to this demo system (check notes on the streamhub element for further instructions).
 Appear X20 platform: access real-time data coming from an Appear X20 platform, just select one of the IP or Satellite inputs.
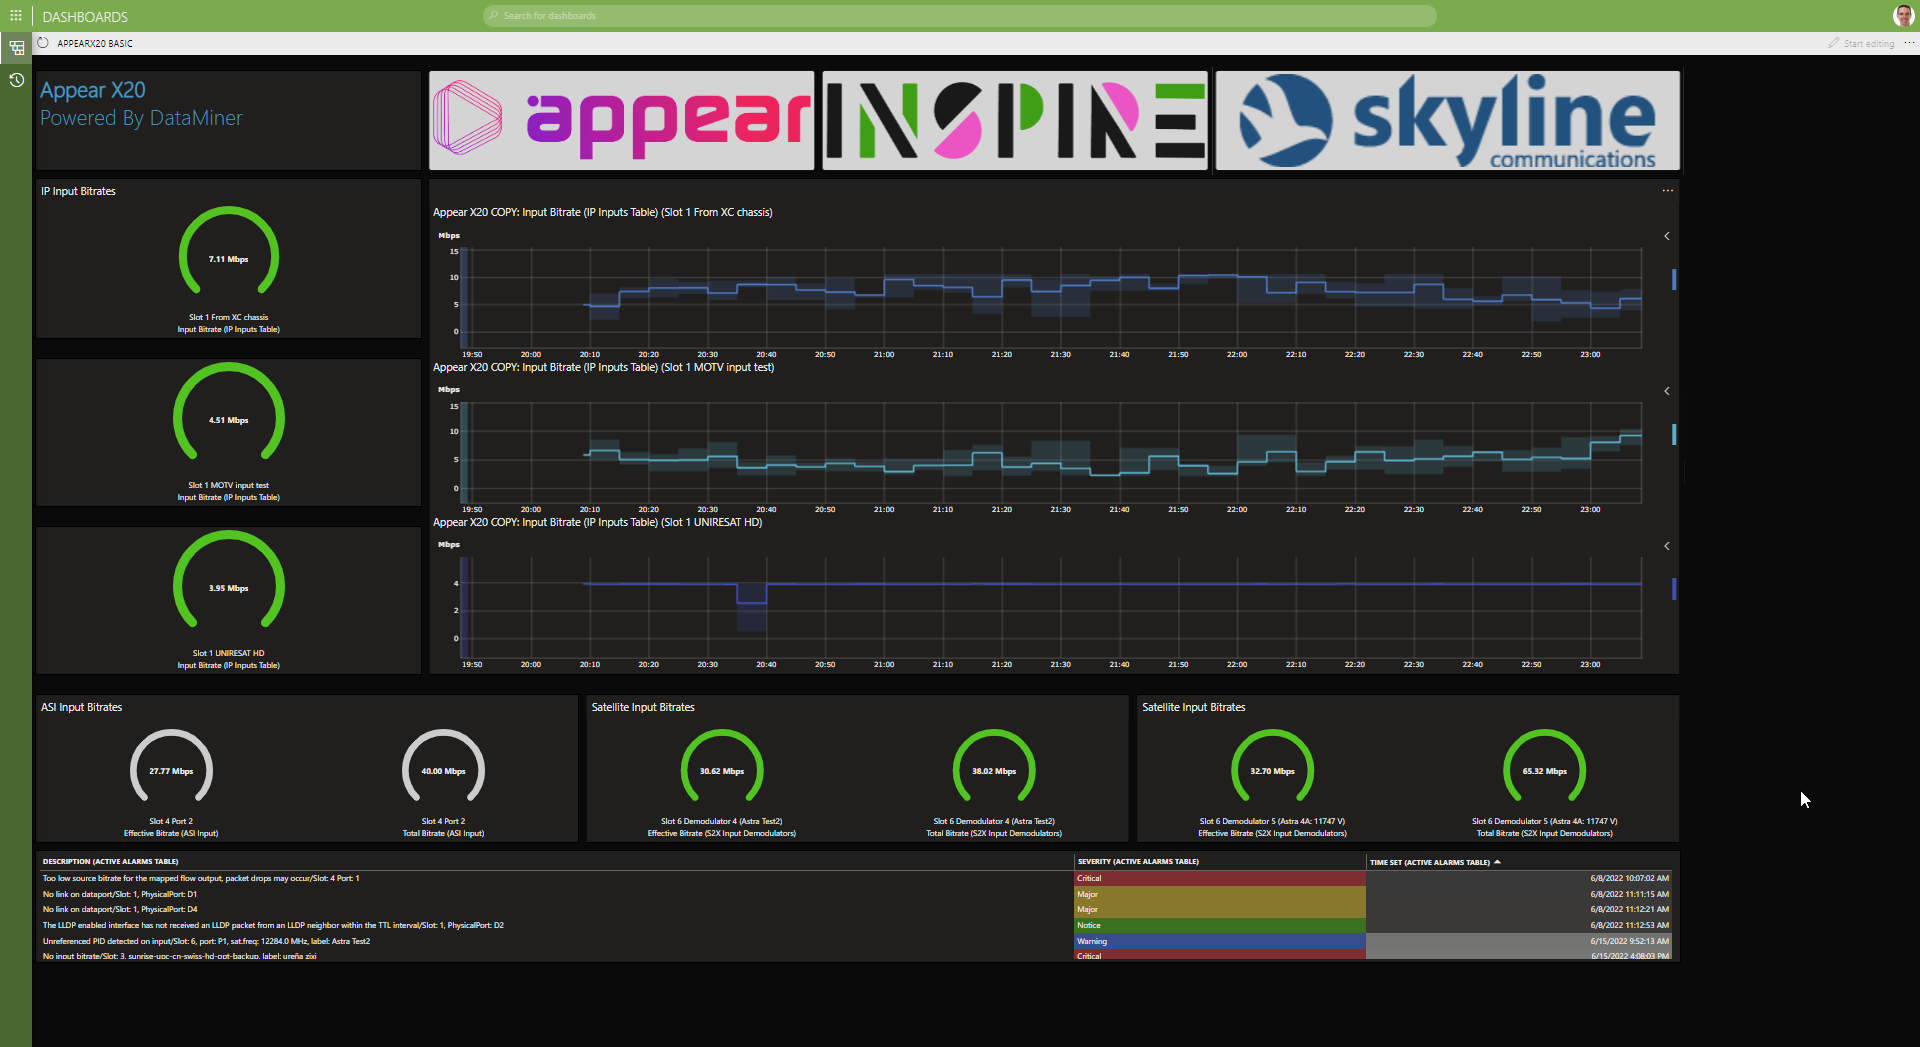 Appear X20 platform with real-time data access