integration Use Case
IPTV Service Monitoring
This use case shows a DataMiner project our partner NGN Telecom Tecnologia has deployed for a large telecommunications company in Brazil. The project involves the monitoring of almost 300 IPTV channels starting from the VOC (video operations center) up to the subscriber’s home. For this, DataMiner aggregates data from plenty of data sources including 139 Telestream probes, which are spread all over Brazil, and a Quality of Experience (QoE) tool from Mariner to get metrics from every IPTV STB.
DataMiner correlates probe data and QoE metrics with a CMDB database, and as a result the operations team gets an intuitive and easy-to-use map view that exactly pinpoints the root cause of any issue in the IPTV delivery chain.
This IPTV Service Monitoring project has been deployed on an existing DataMiner cluster that already managed the customer’s DTH uplinks, OTT channels and IT infrastructure.
USE CASE DETAILS
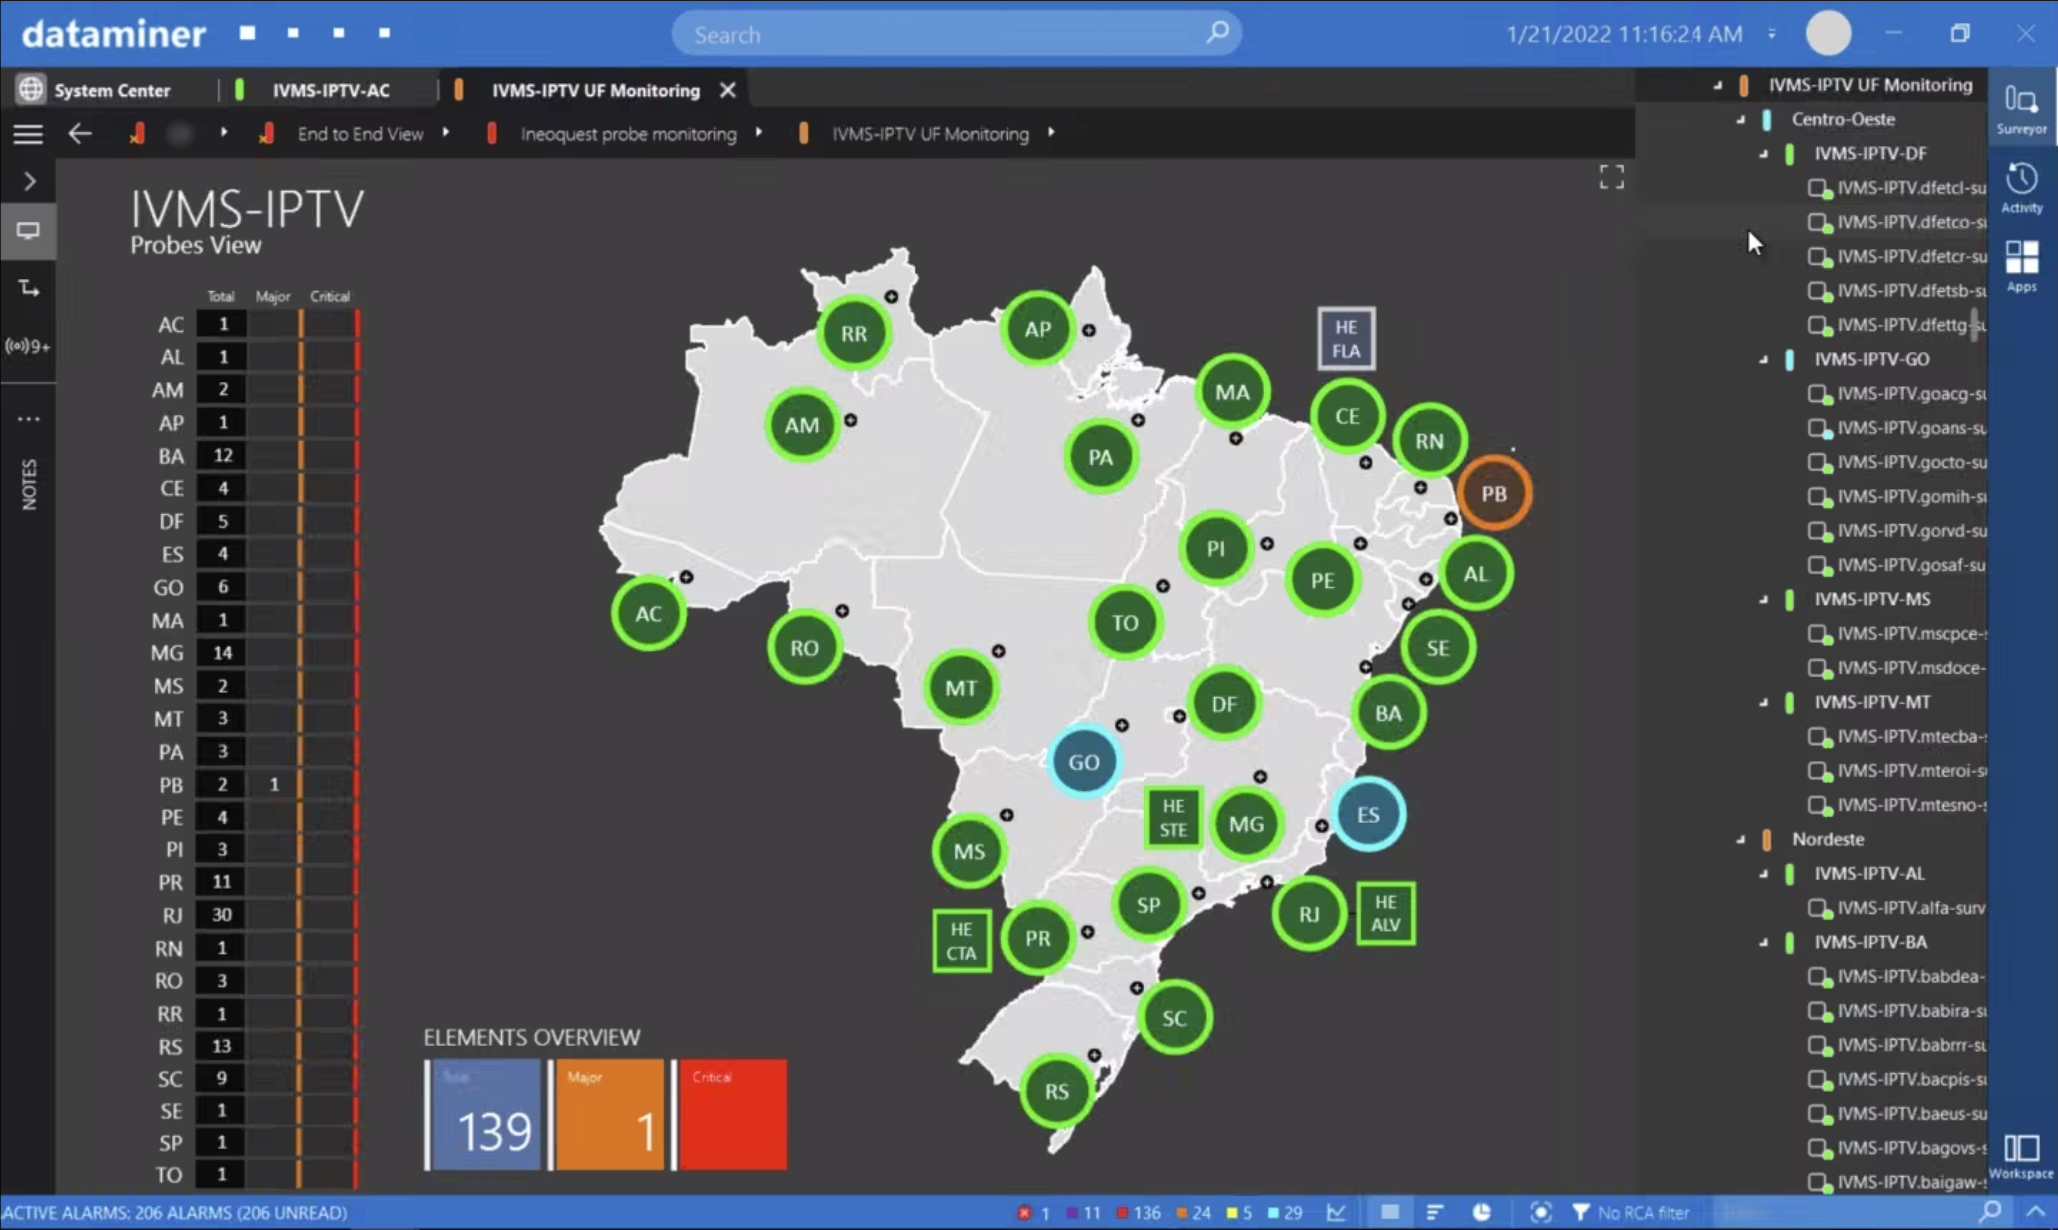
The IPTV map view displays aggregated data from 139 Telestream Surveyor probes. DataMiner automatically positions the probes on this map using geodata extracted from a separate database. With this, every operator can easily see the number of probes per state in Brazil and the number of current alarms. Every transport stream probe monitors 293 IPTV channels. All streams originate from a central NOC in Rio de Janeiro and get distributed across several other NOCs (visualized as rectangles) to the subscribers. Next to the IVMS system, probe metrics, which are extracted from Telestream Sentry probes in every NOC, also contribute to the health state of each service.
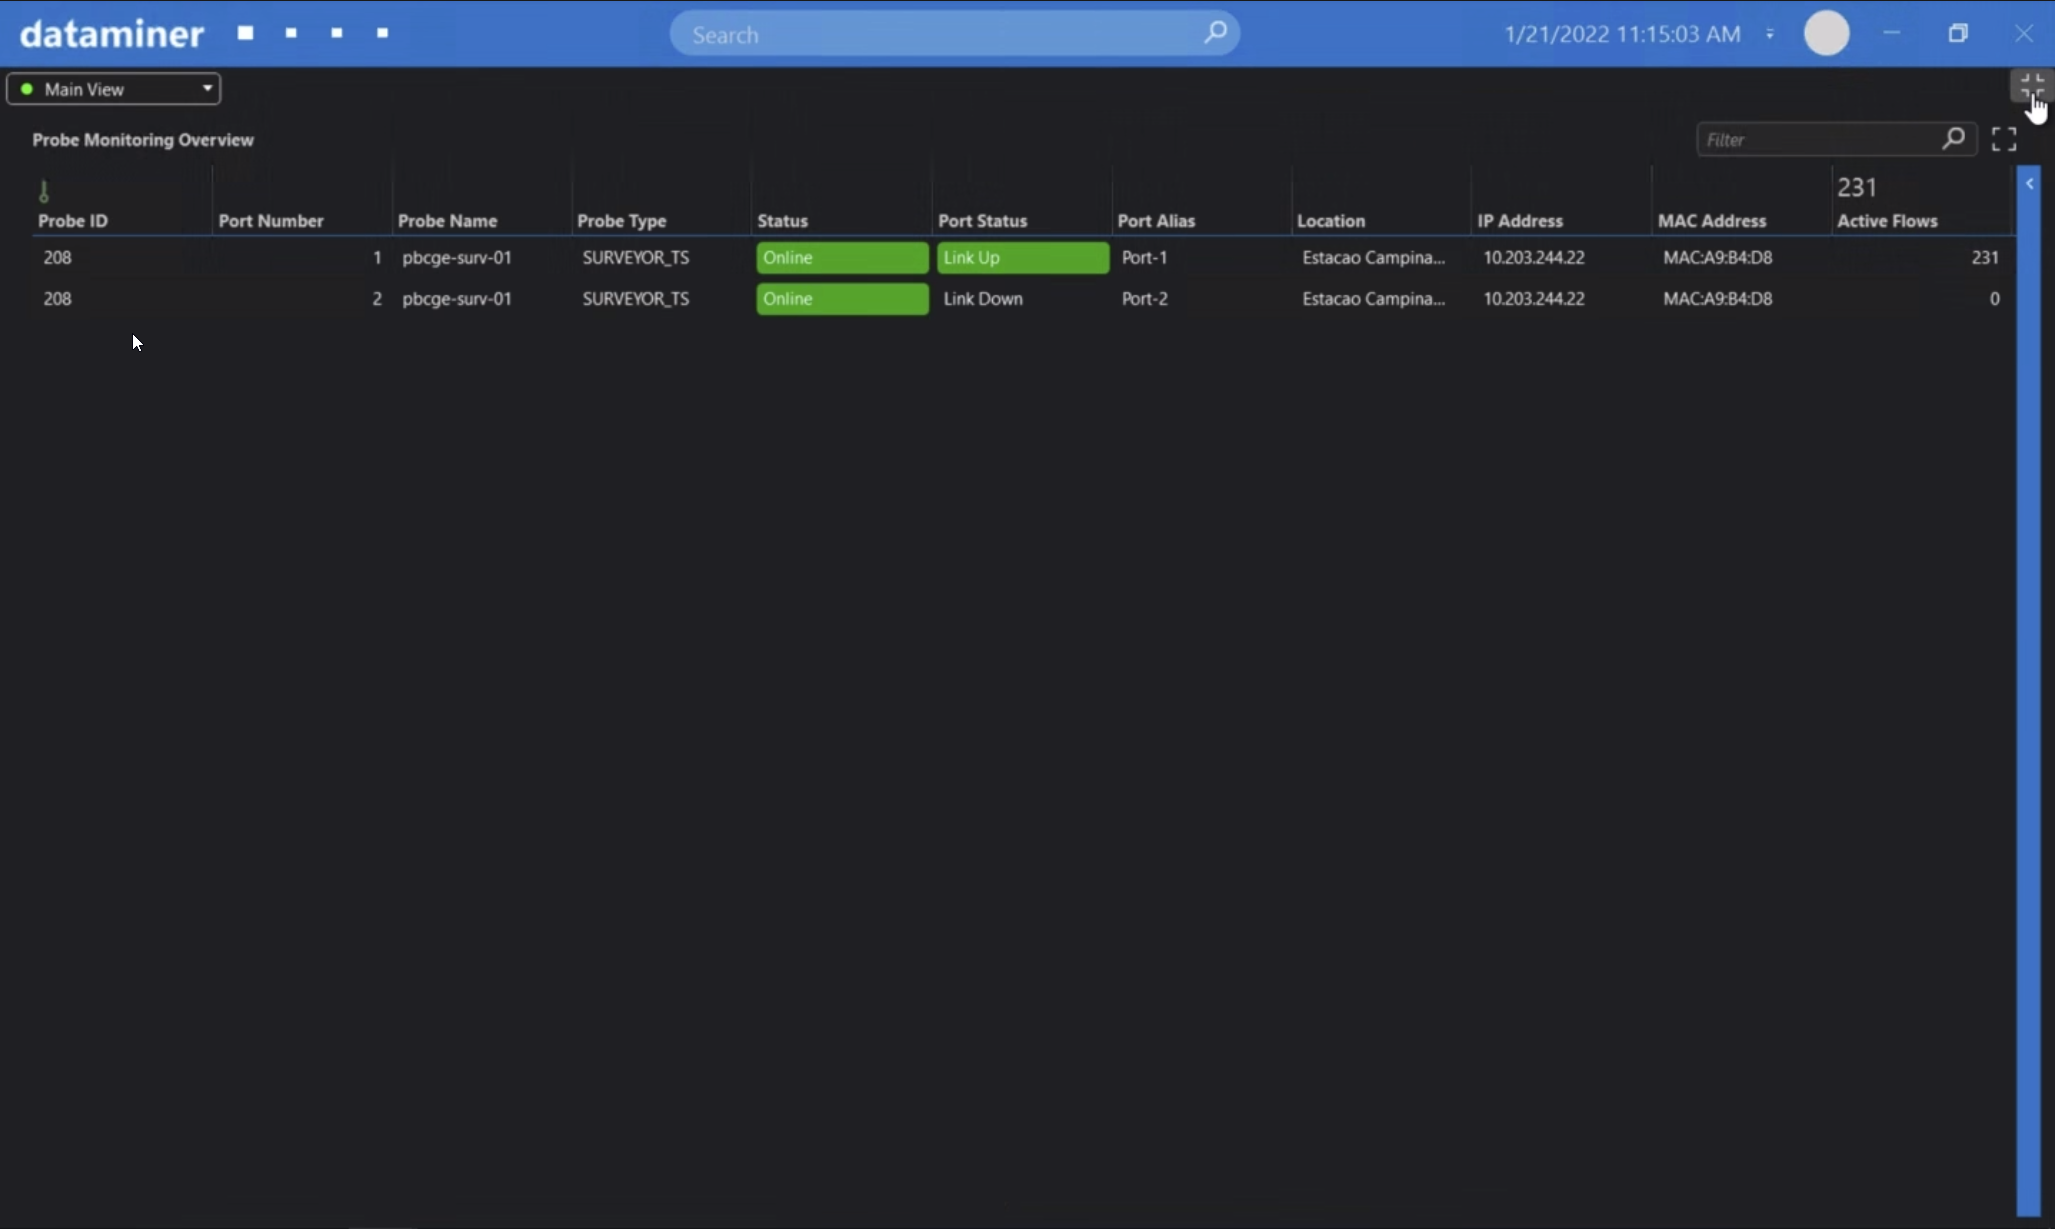 Simply click on one of the circles on the map view, and you will see the device and link status of the probes per region. In this example, there are two probes running in a region.
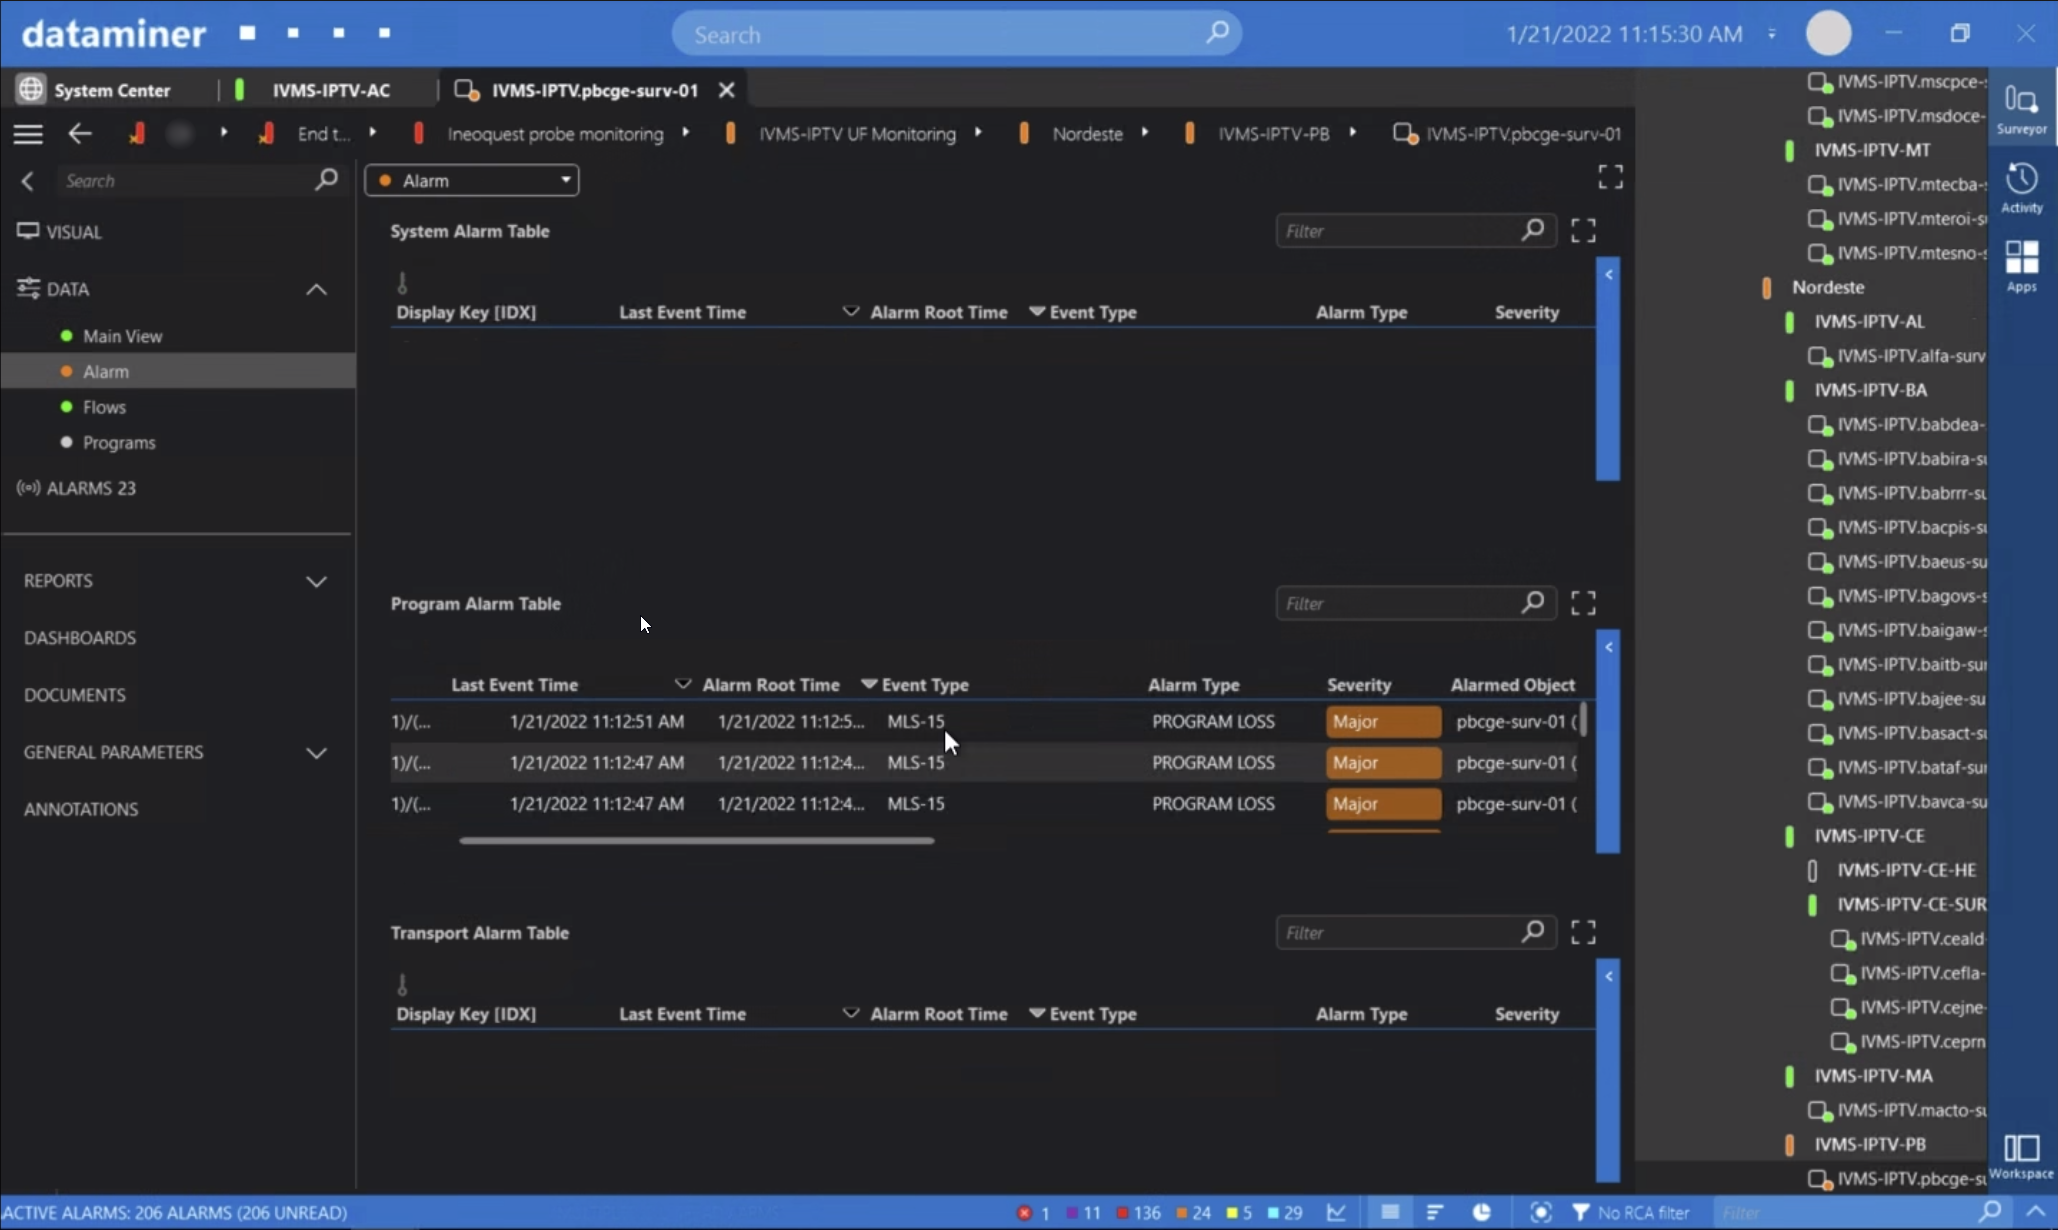 In case of an active alarm, you can immediately see the details. This screenshot shows a "program loss" alarm.
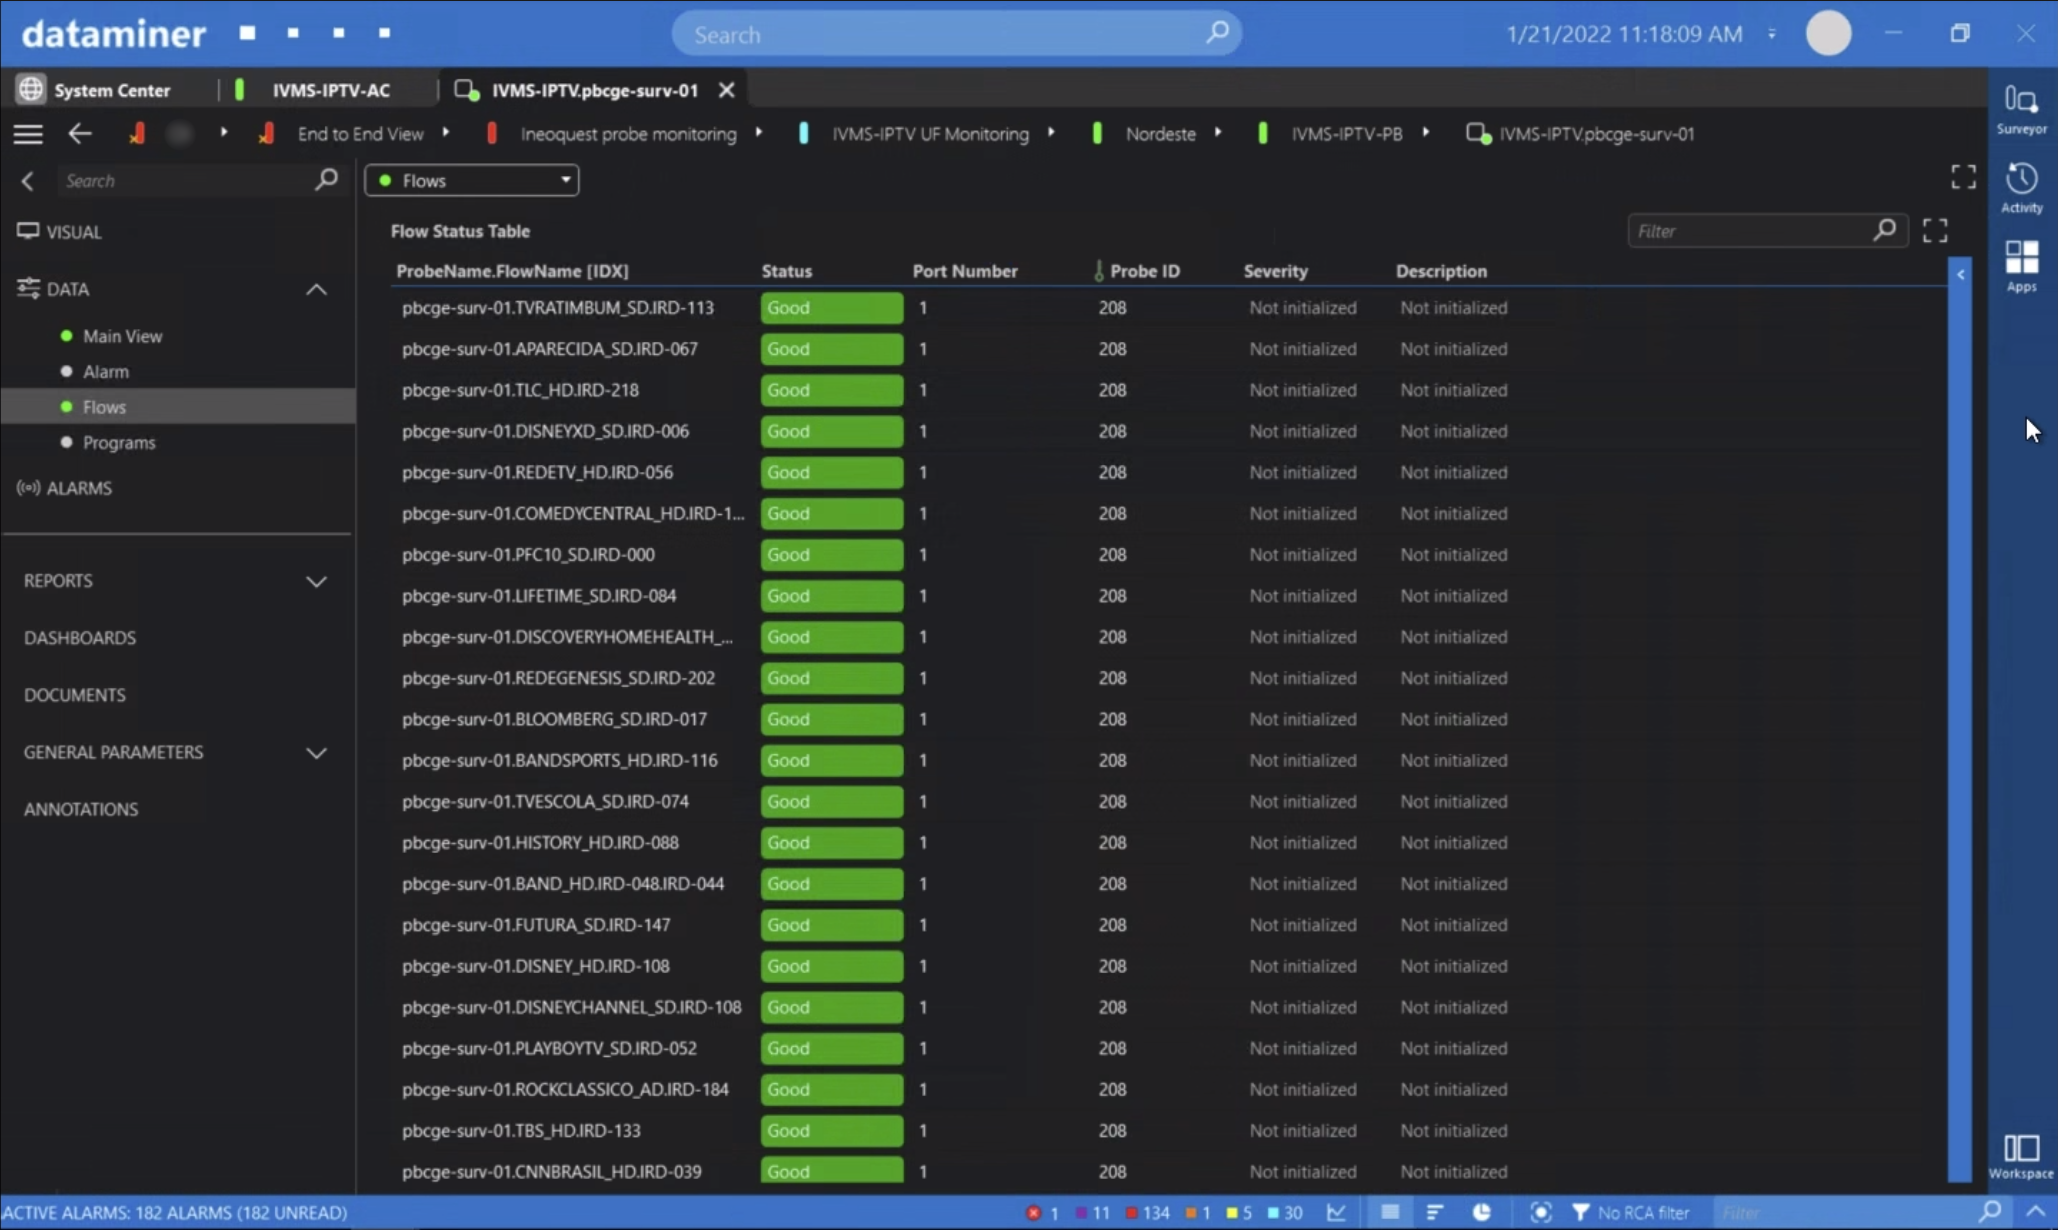 This screenshot shows the summary health state of each of the 293 IPTV channels reported by a single probe.
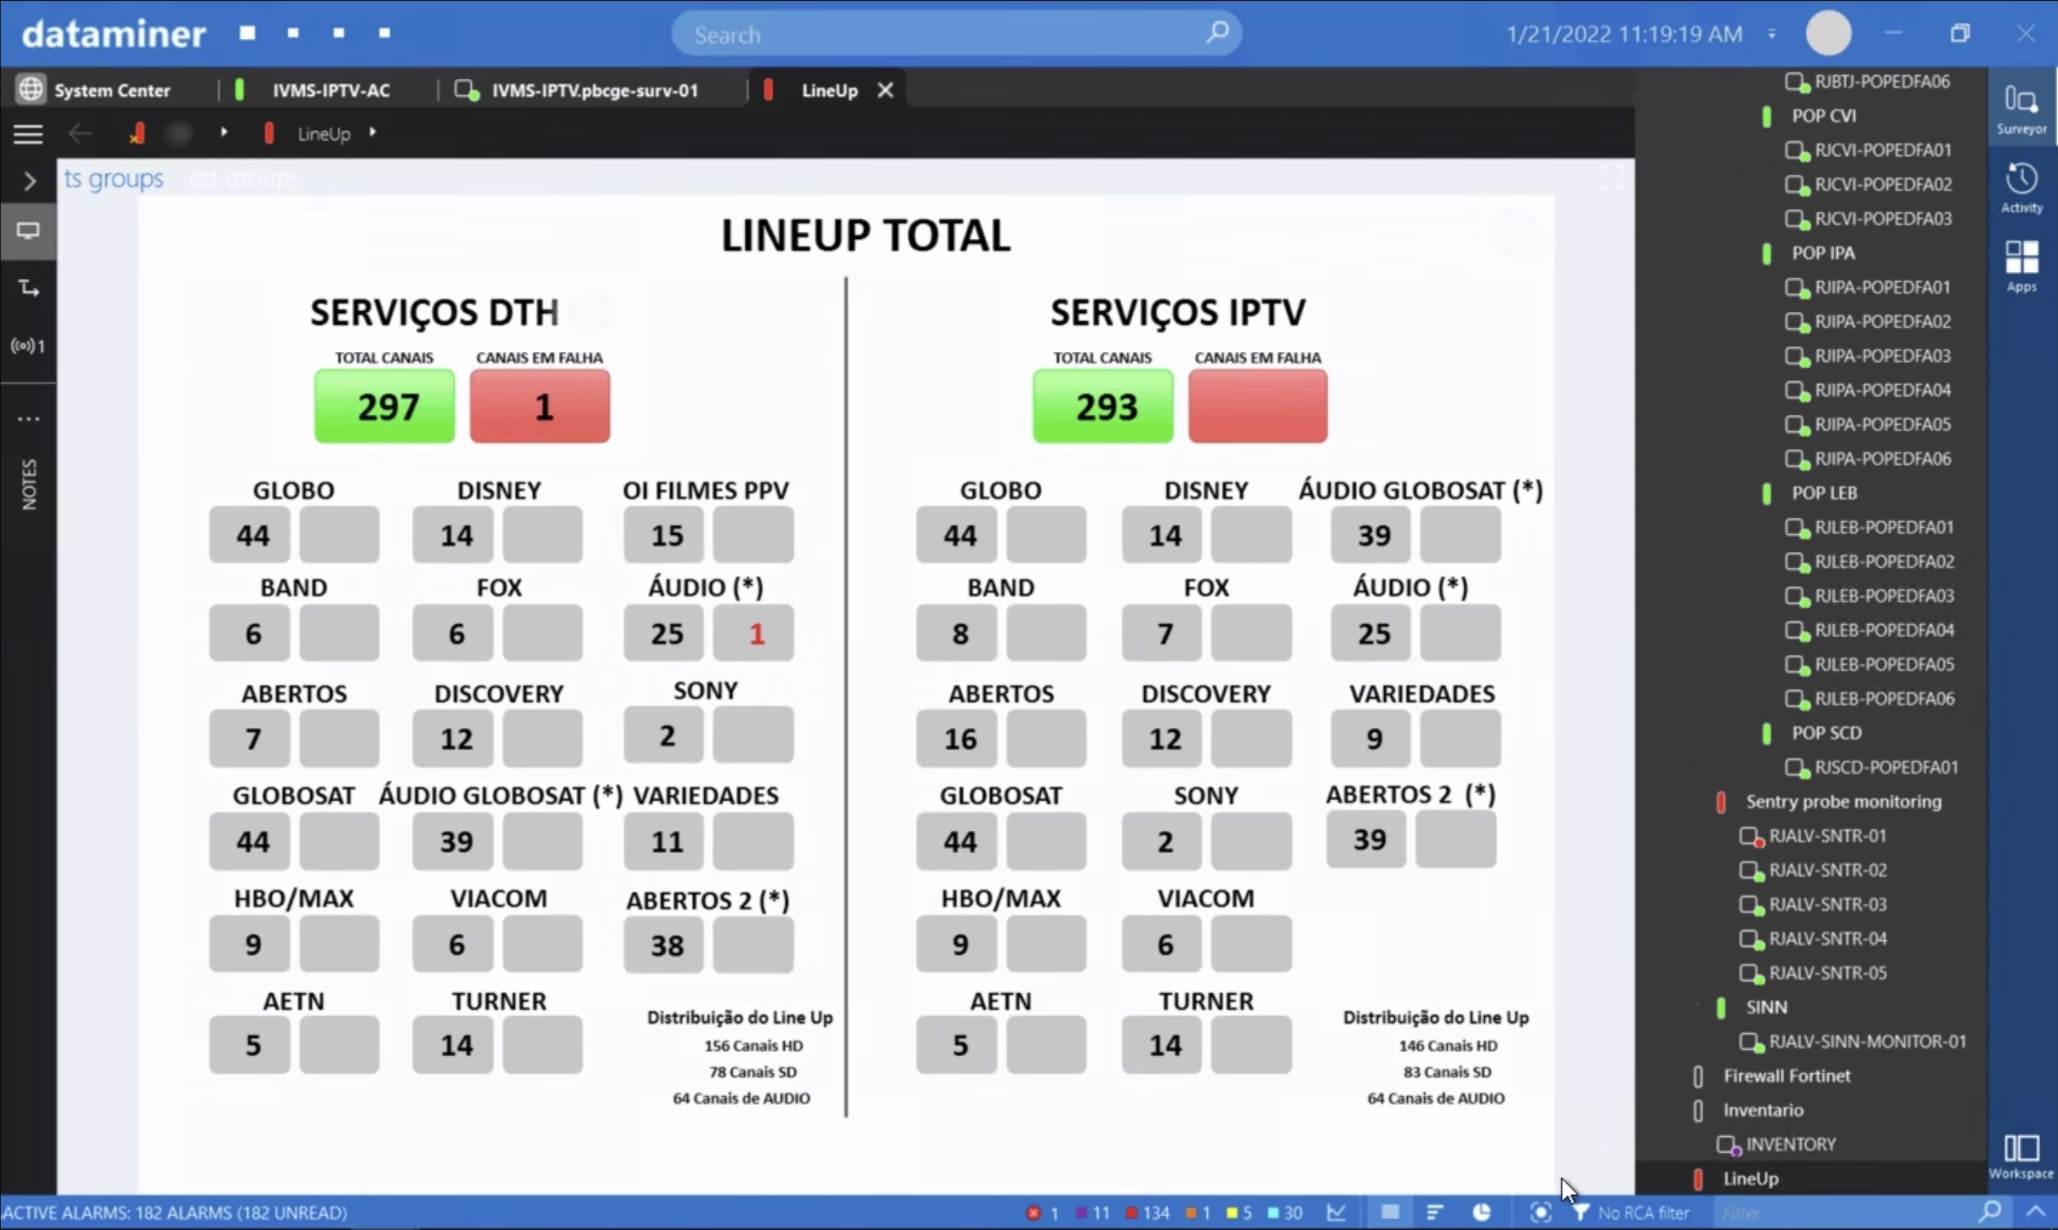 This visual overview shows the overall channel health state, with IPTV and DTH distribution next to each other. In case an alarm pops up for the same channel for both DTH and IPTV, the root cause must be somewhere in the NOC.
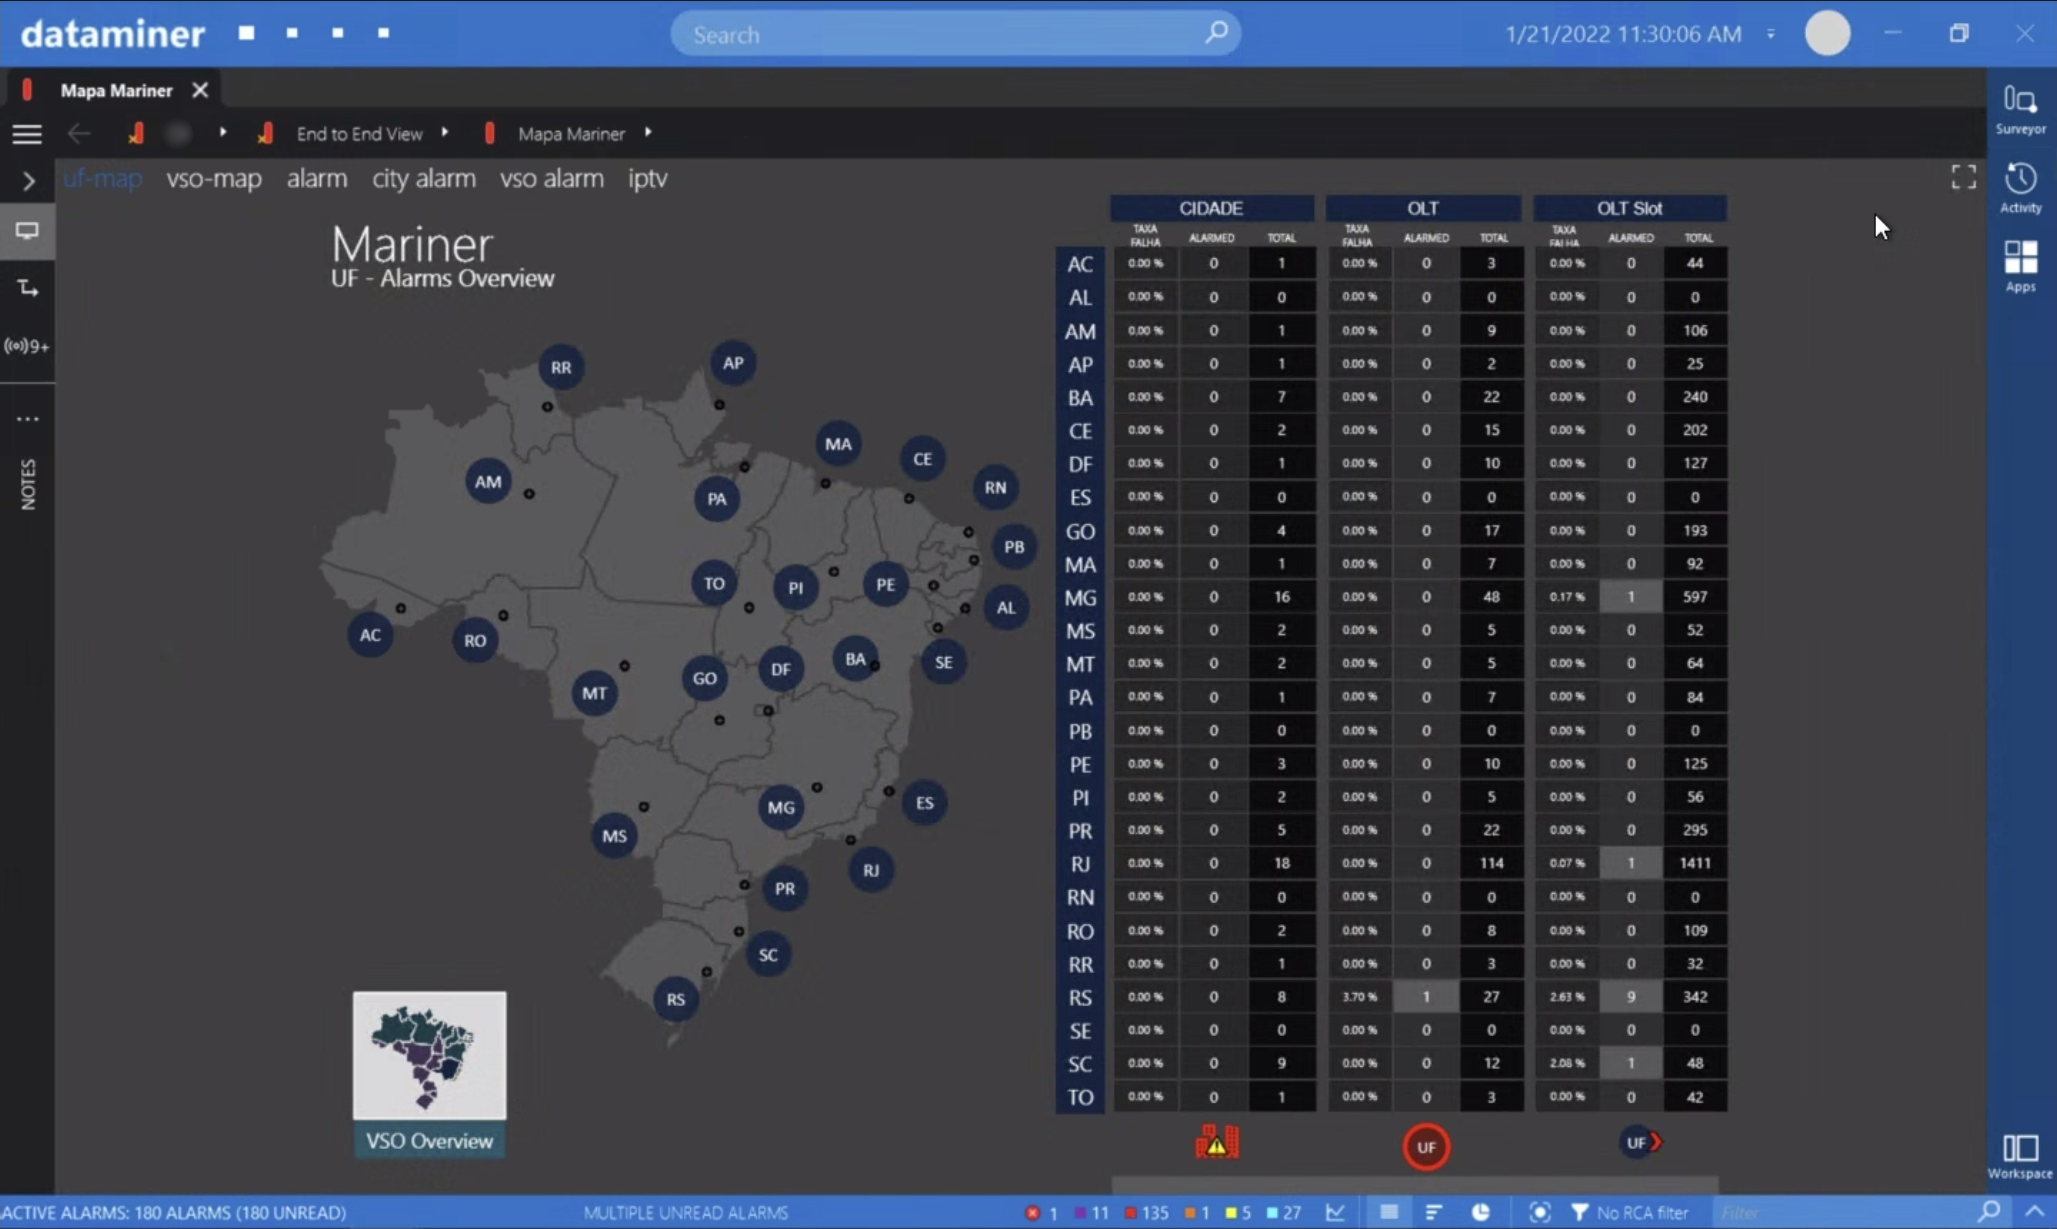 IPTV monitoring does not stop at checking the stream health via the Telestream probes. DataMiner also interfaces with a QoE system from Mariner. The latter grabs data from a Mediakind Mediaroom IPTV solution, analyzing log files and gathering metrics down to the DSLAMs, OLTs and each individual OLT slot. With this, DataMiner can identify errors down to the individual subscriber. However, Mariner has no context, so DataMiner adds this. DataMiner knows the region for each STB and aggregates data into an easy-to-read map overview.
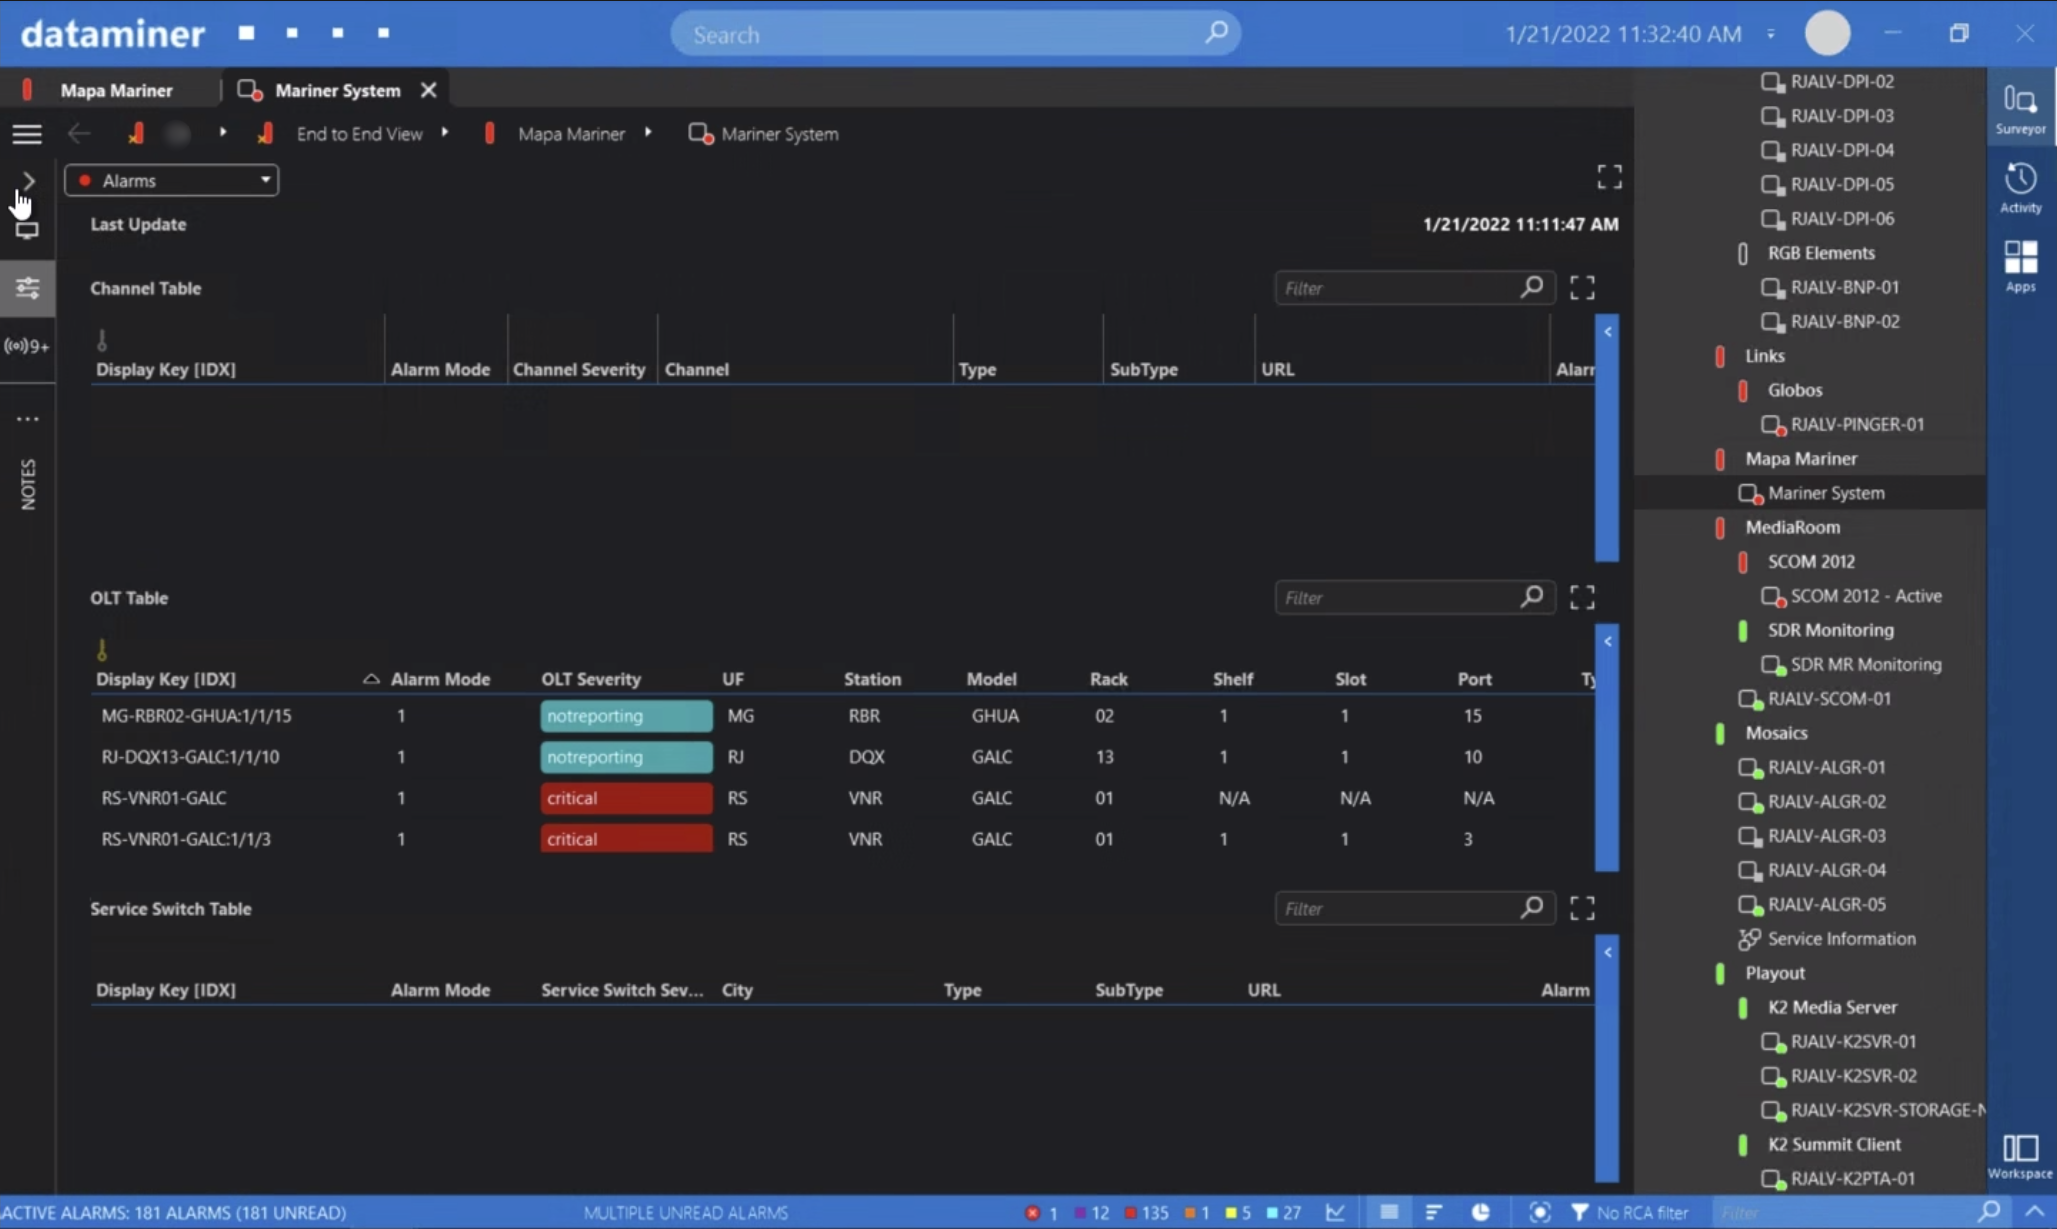 Here is an example of two OLTs in a critical state and two others that are not responding.
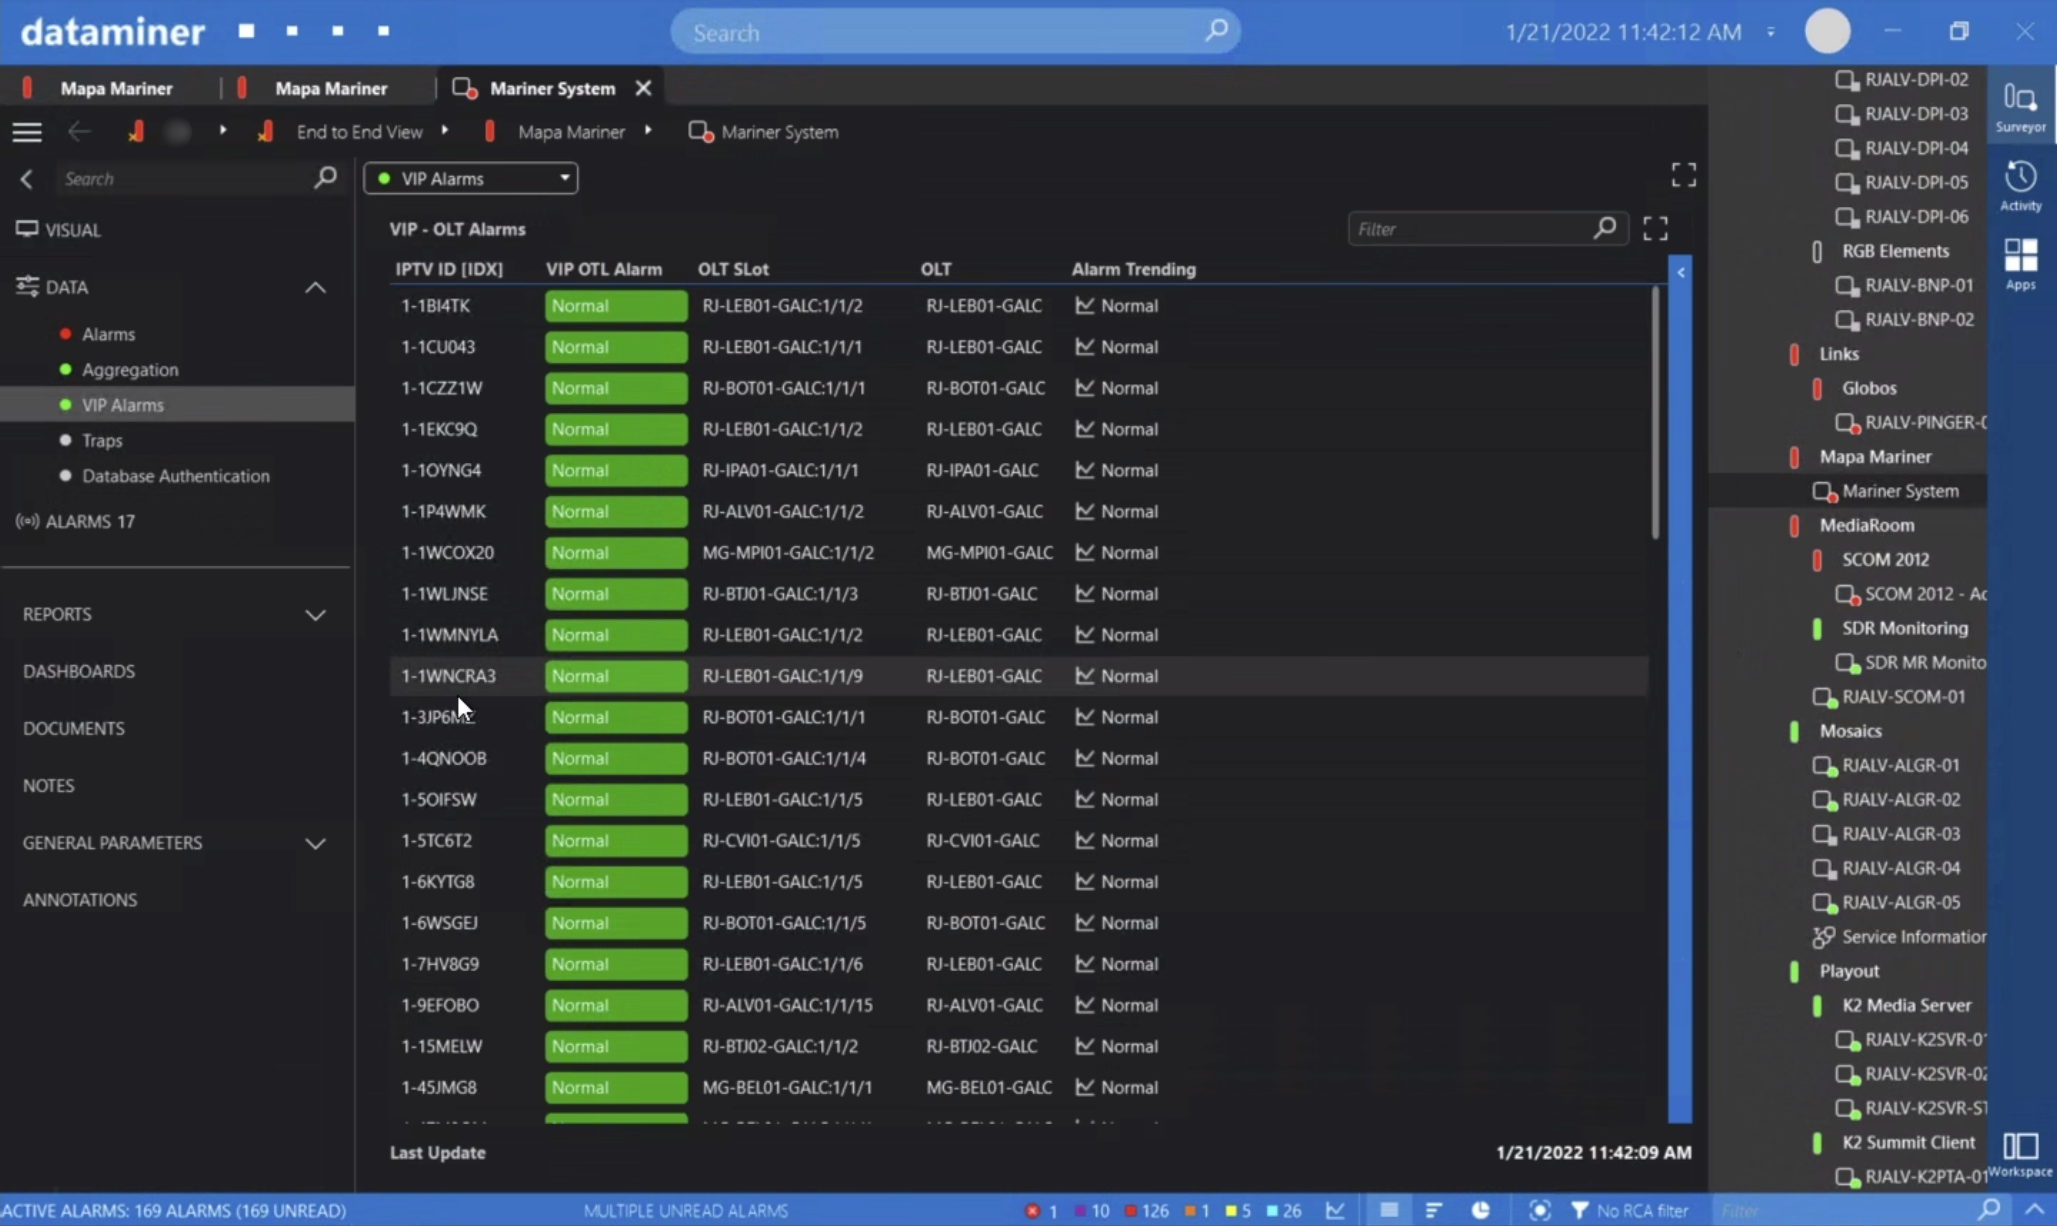 Some subscribers have a VIP flag. DataMiner knows about those and gives them a higher priority.
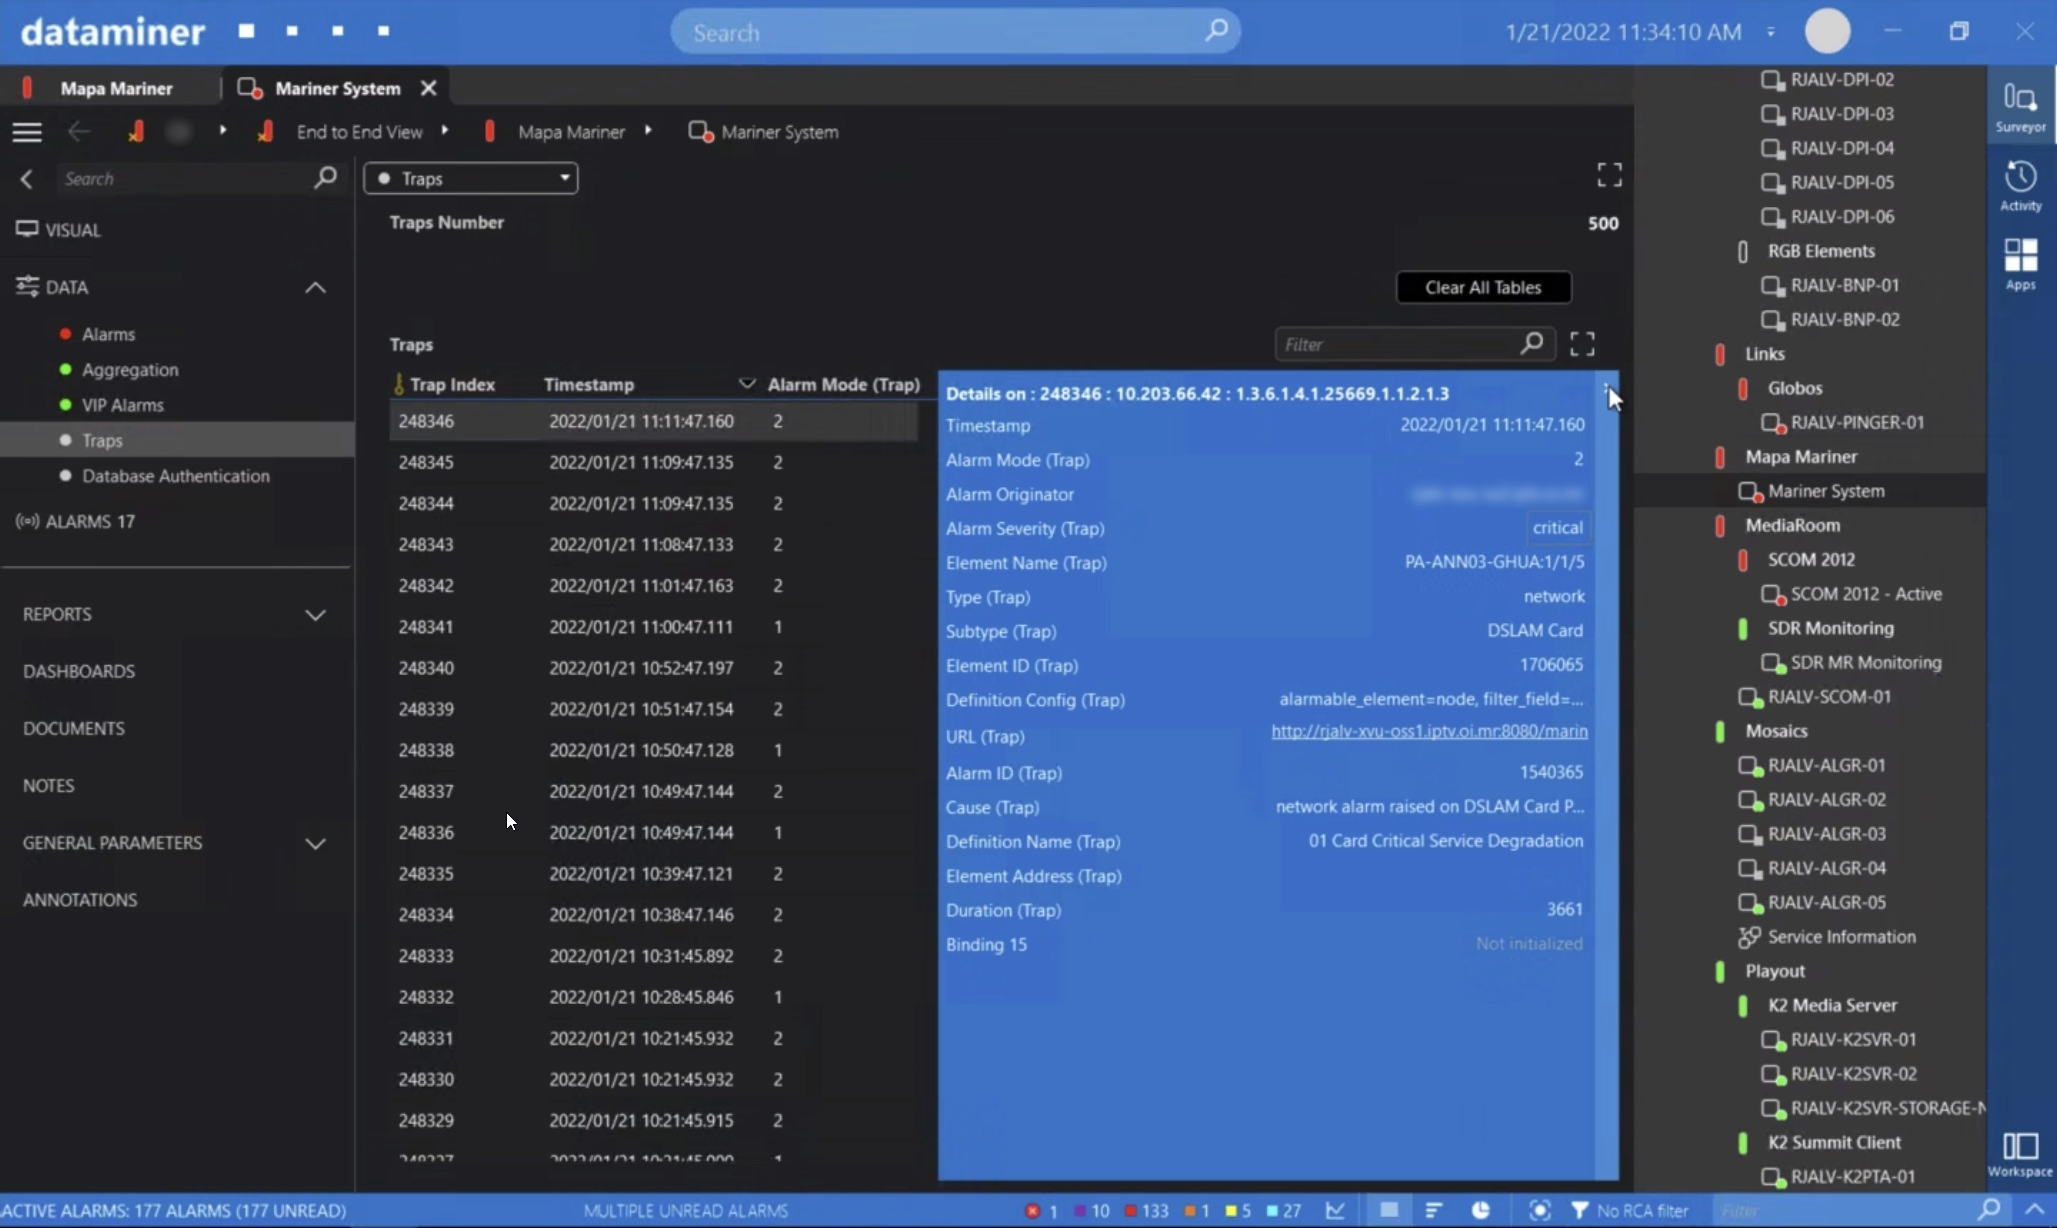 Mariner mainly forwards traps to DataMiner with all necessary data.
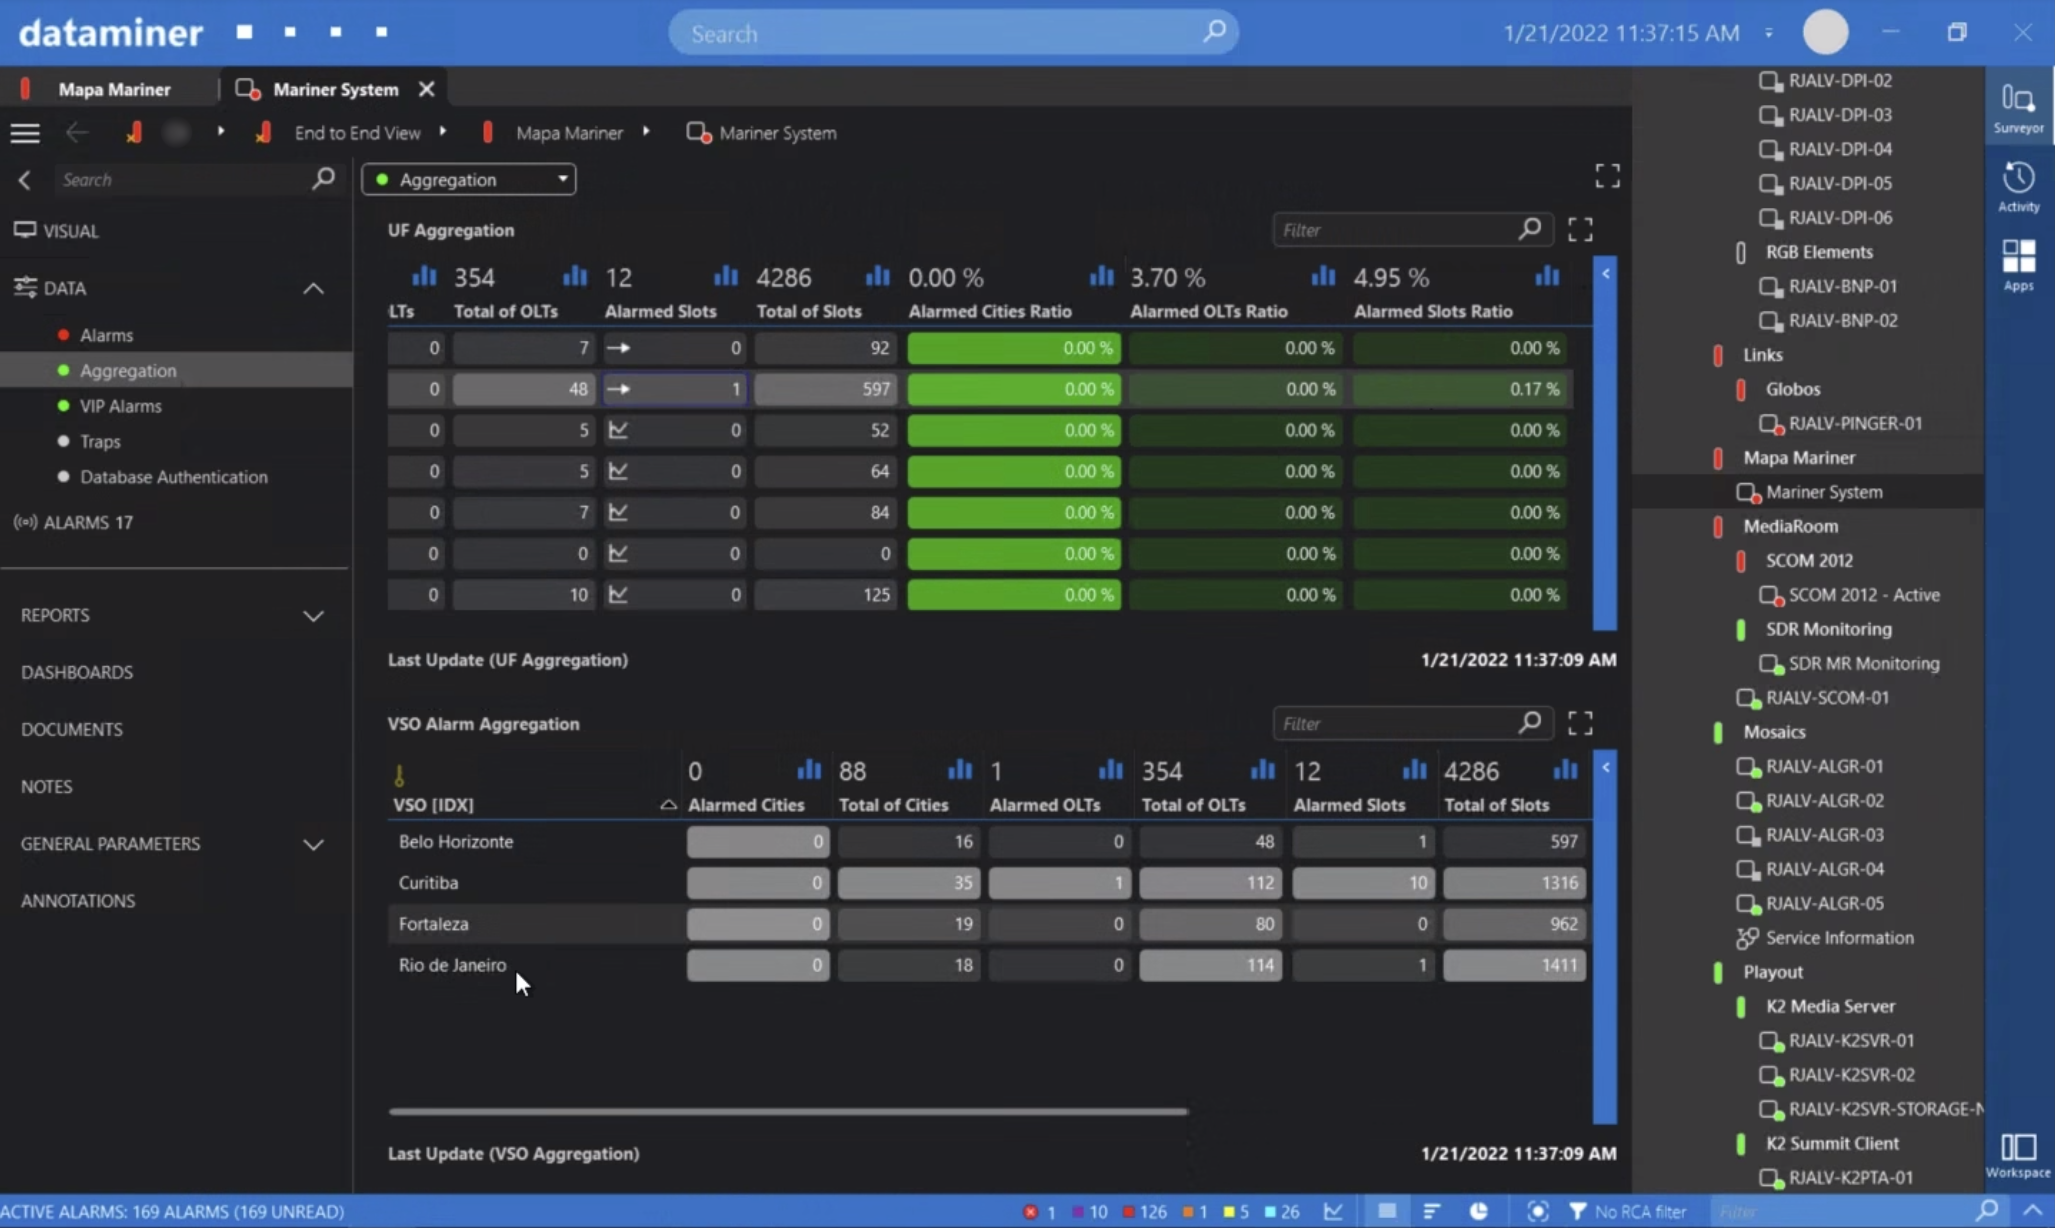 Here you can see DataMiner's aggregation layer, where error ratios per OLT, per slot, per city, etc. are calculated.
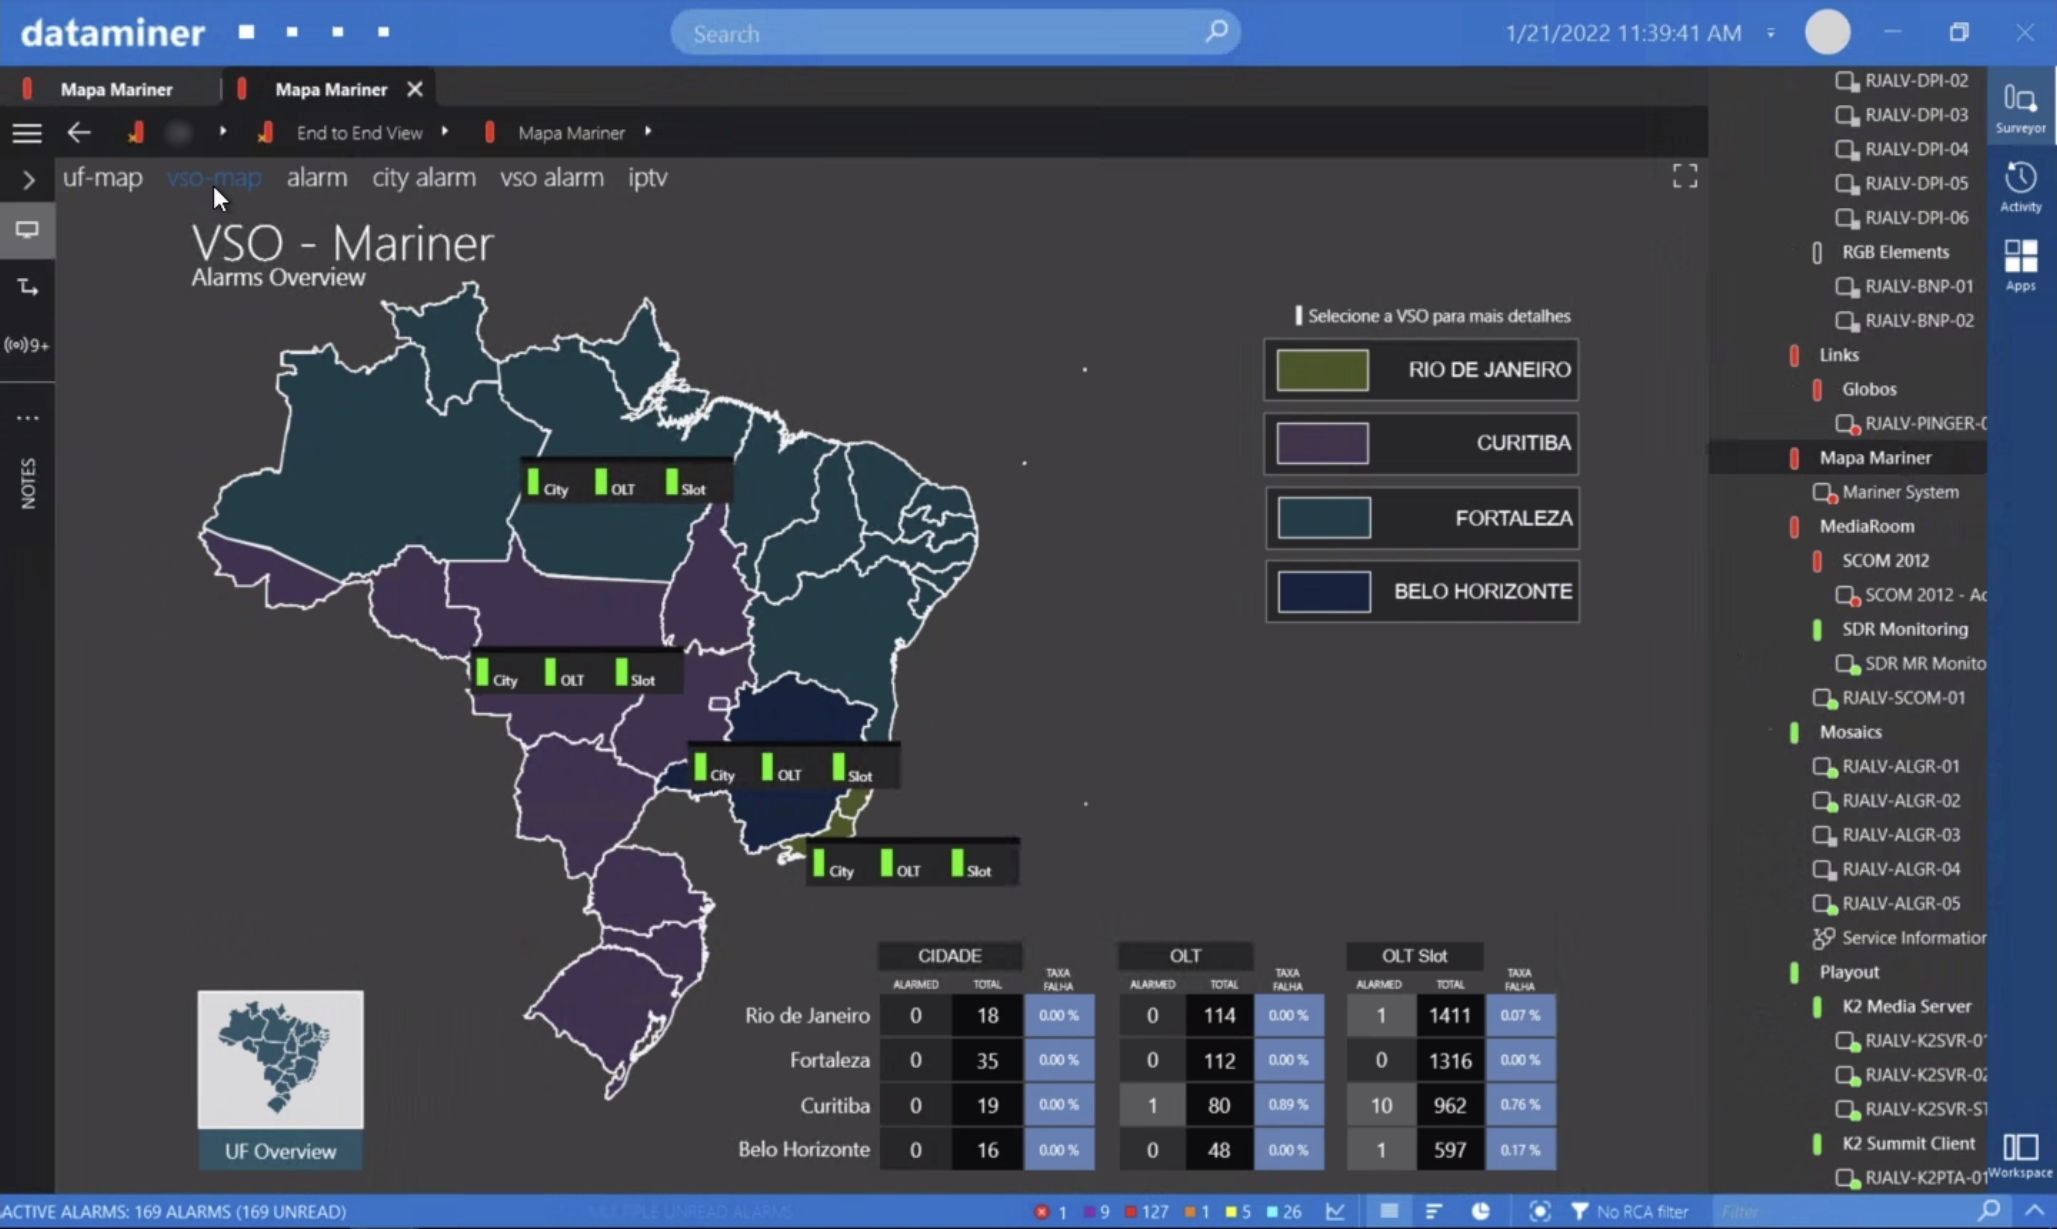 Additional visual overviews have been created for the operational teams. This is an aggregated view showing data from four regions. Each region gets data from one of the four headends. With this, an issue in one of the headends would immediately affect one single region.
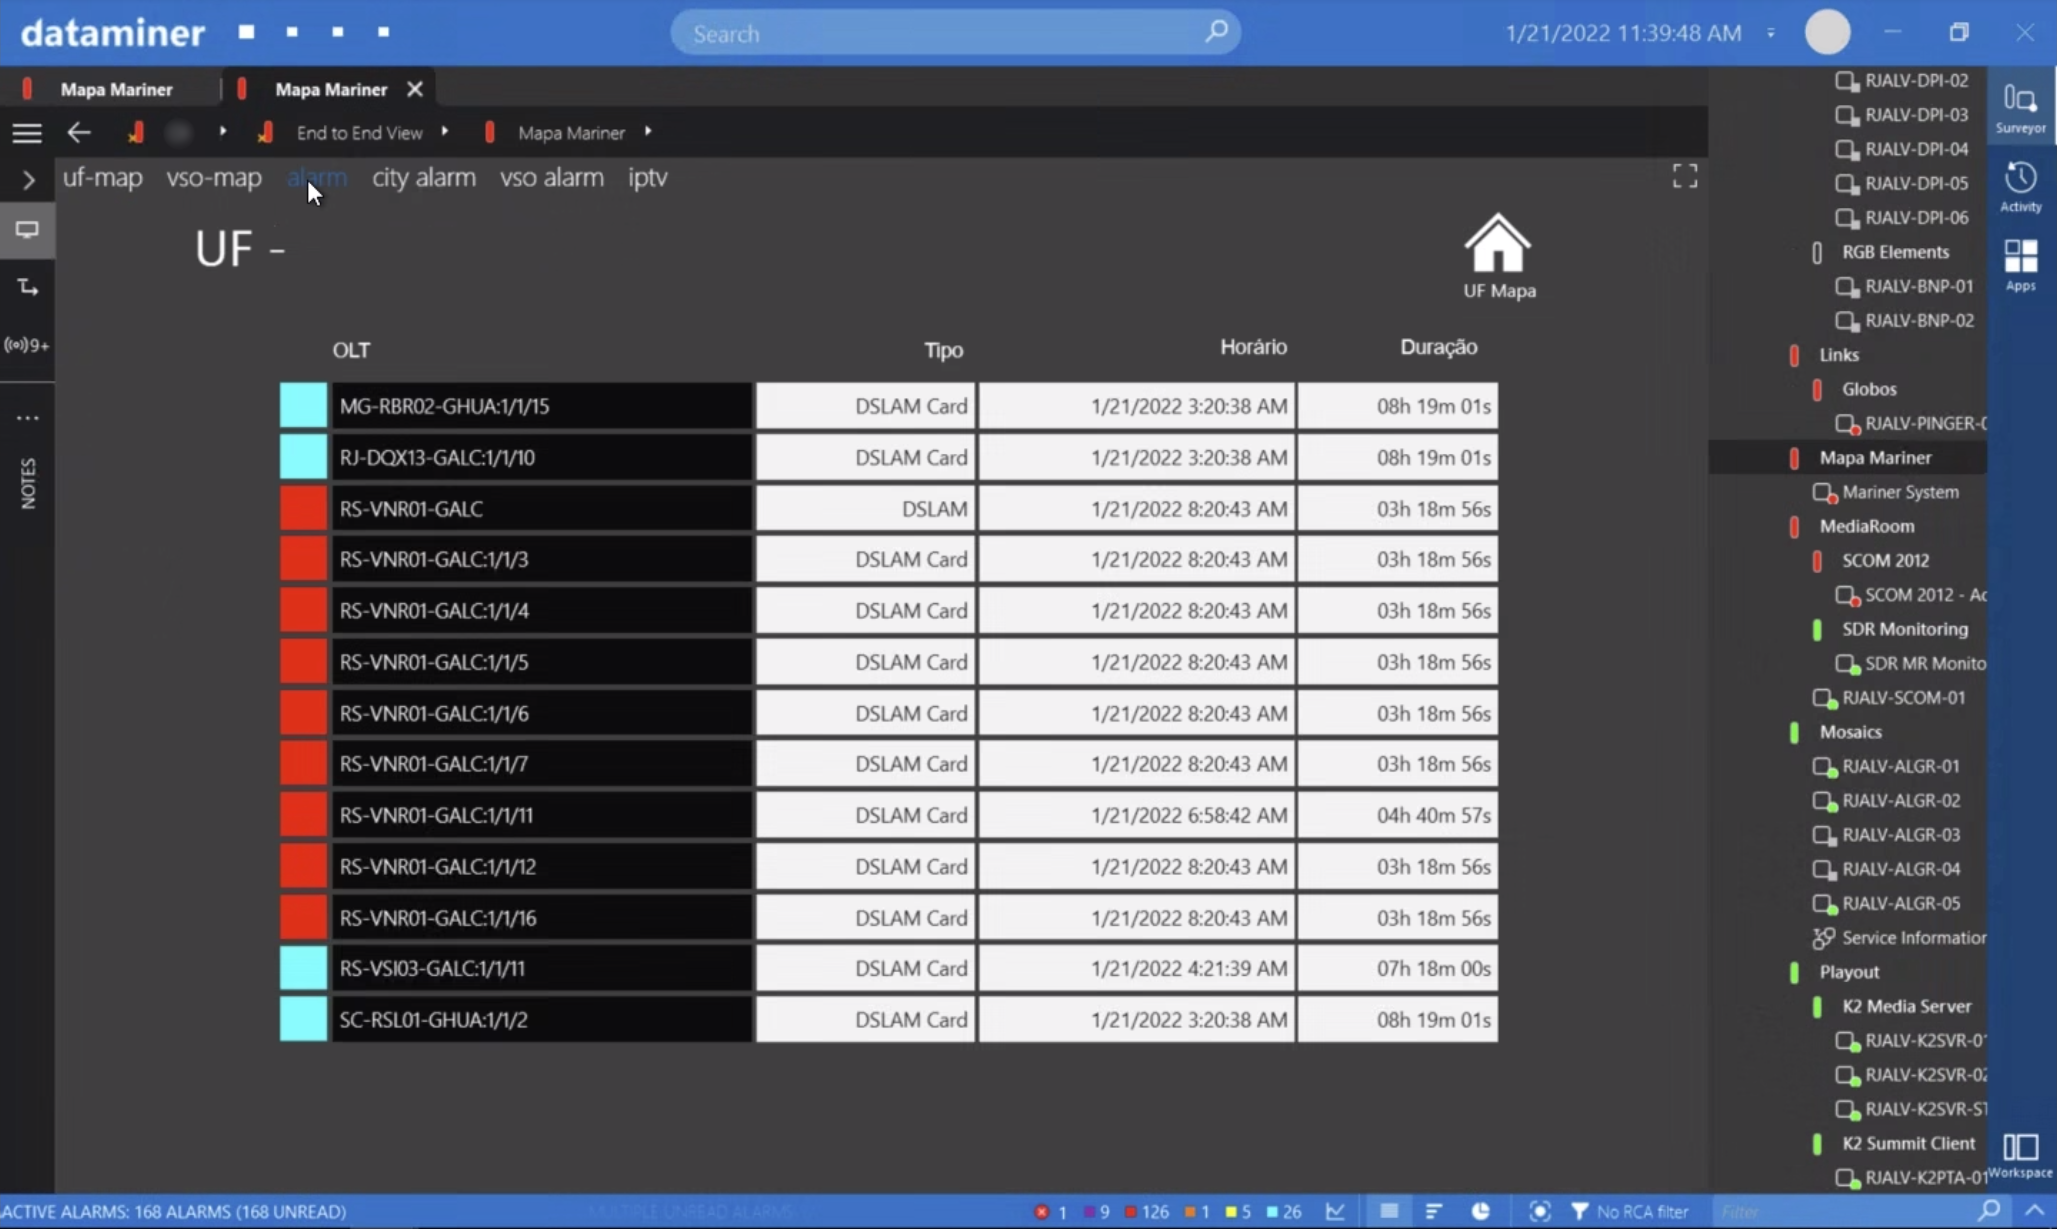 Support teams asked for a simple overview of all DSLAM card errors.
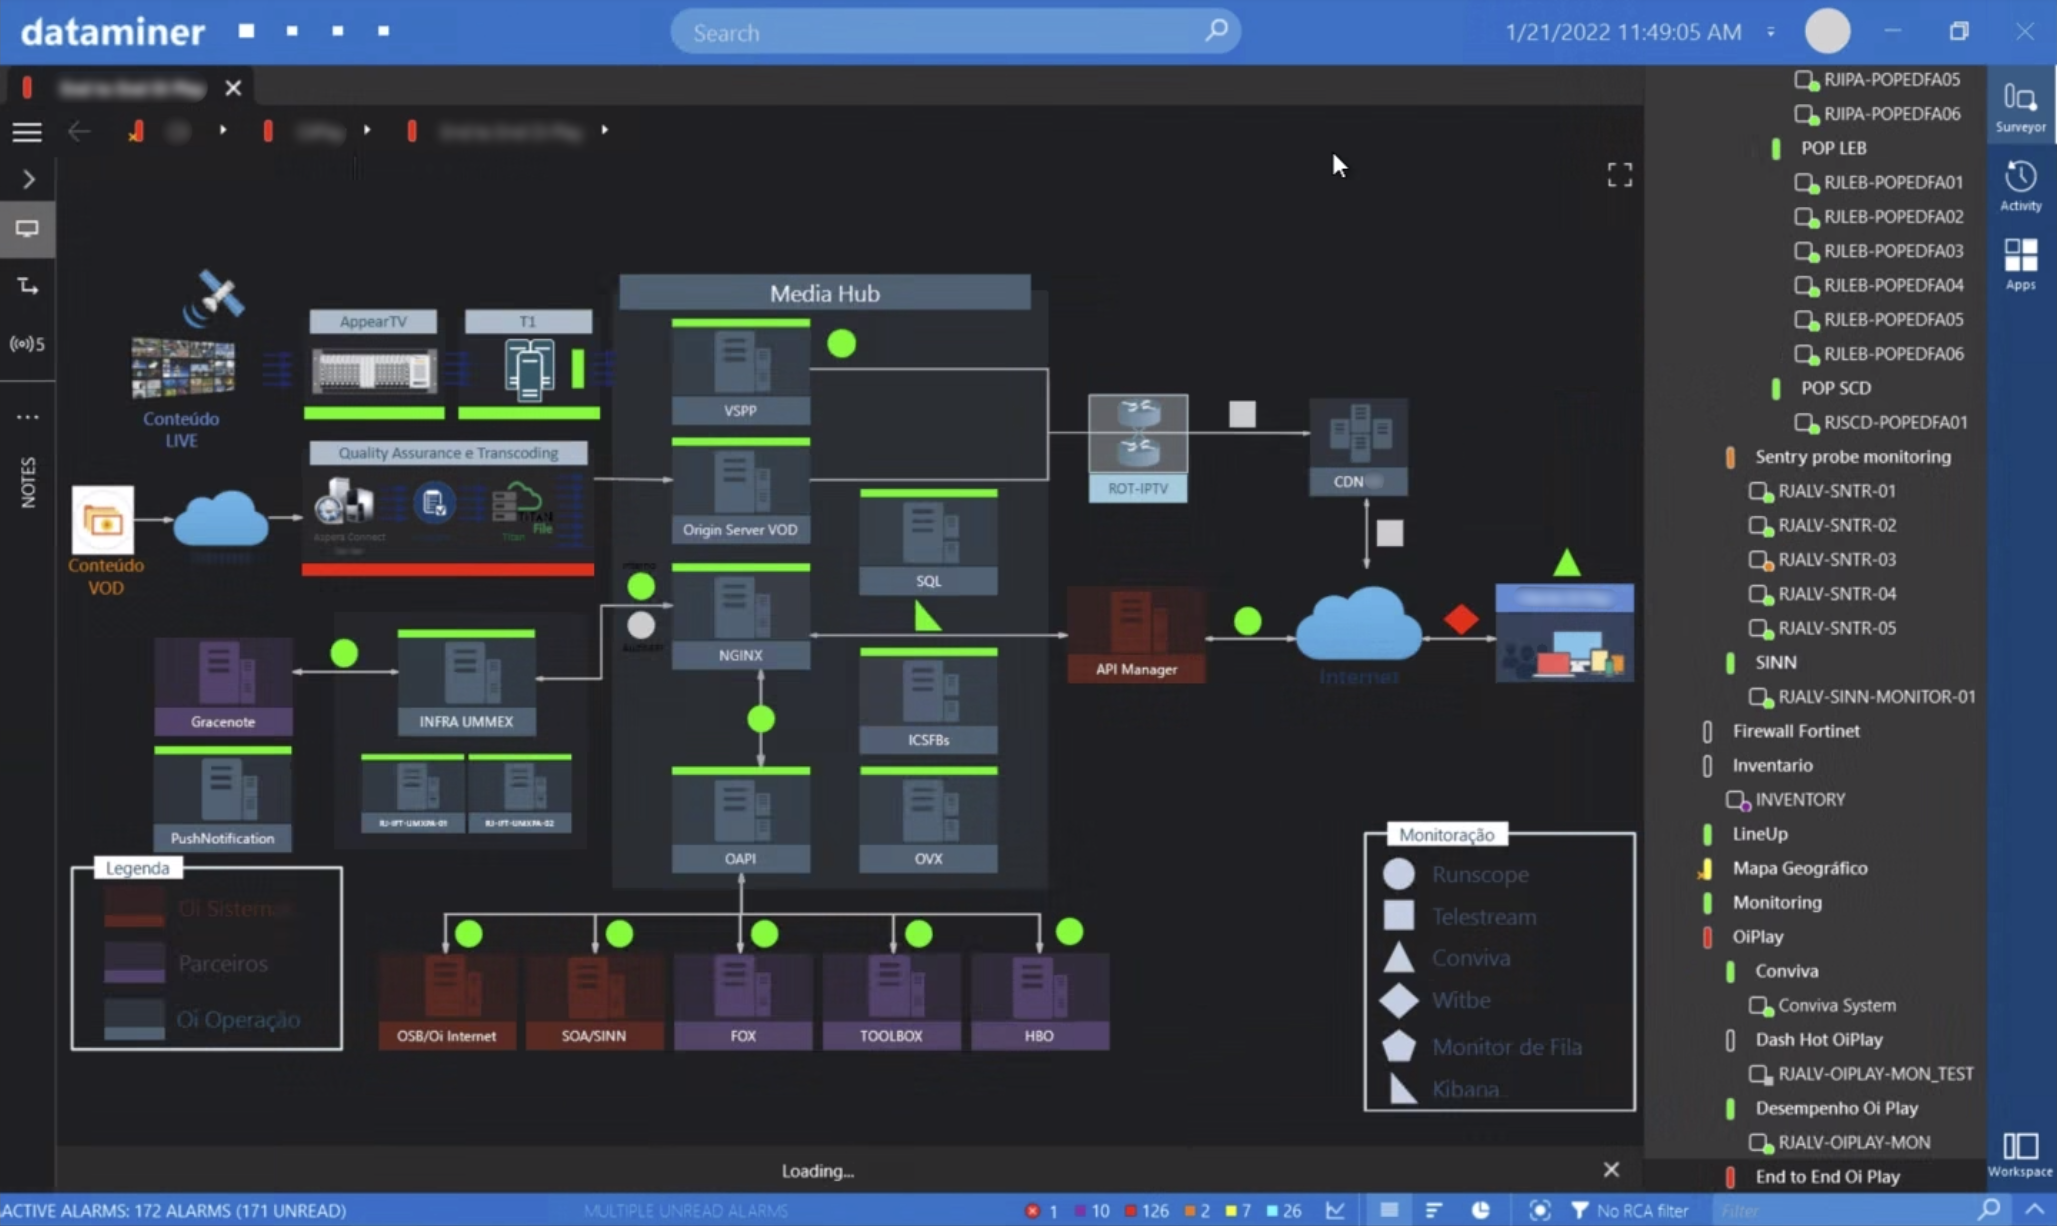 DataMiner not only manages the IPTV system but also many other systems, such as VOD transcoding devices, database servers, etc.
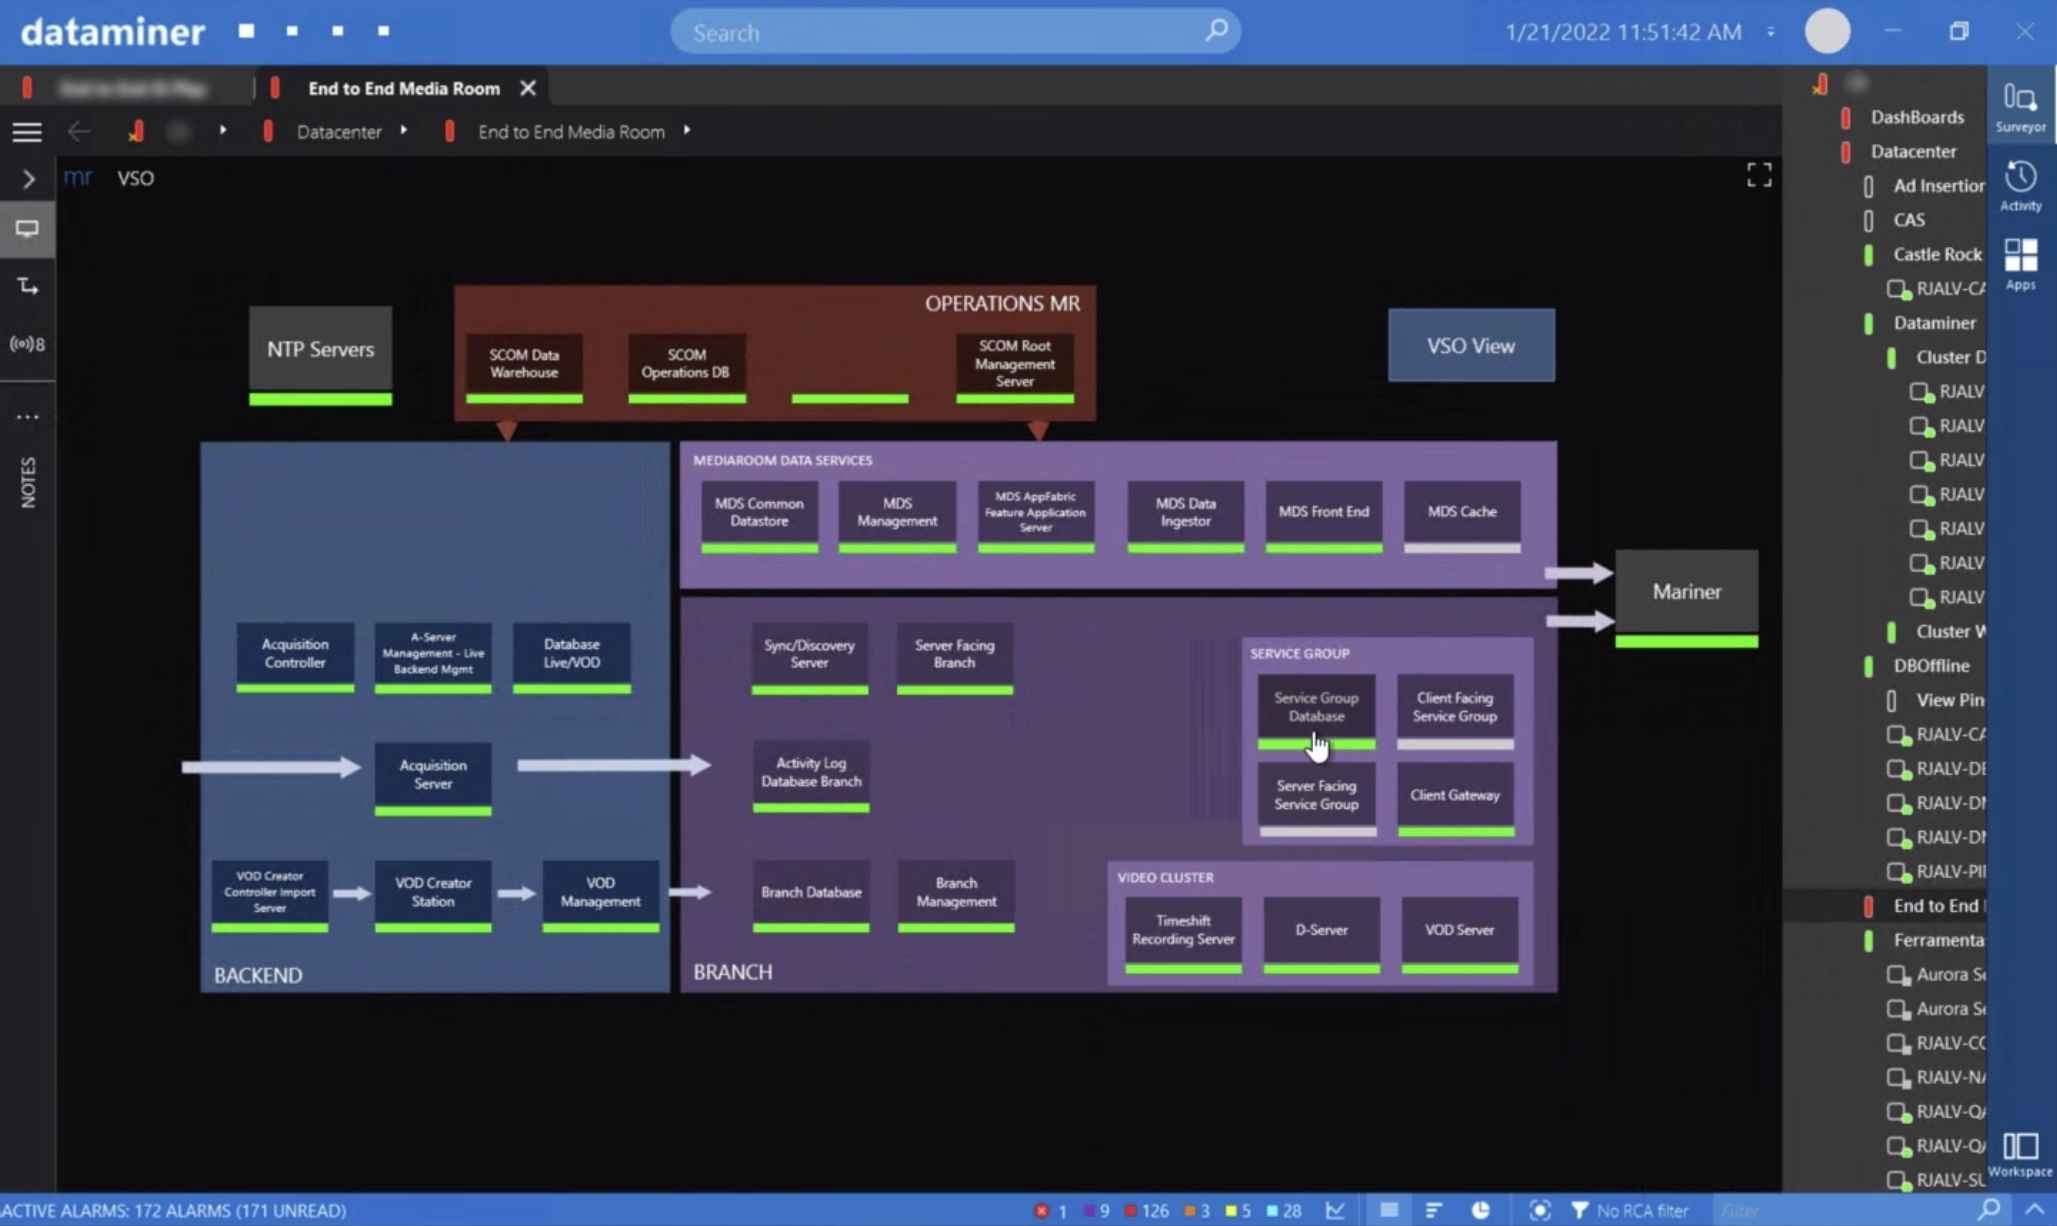 This visual gives an overview of the backbone for the Mediakind Mediaroom system, where DataMiner monitors plenty of application servers, interfaces with Microsoft SCOM, and also checks core IT services such as NTP.
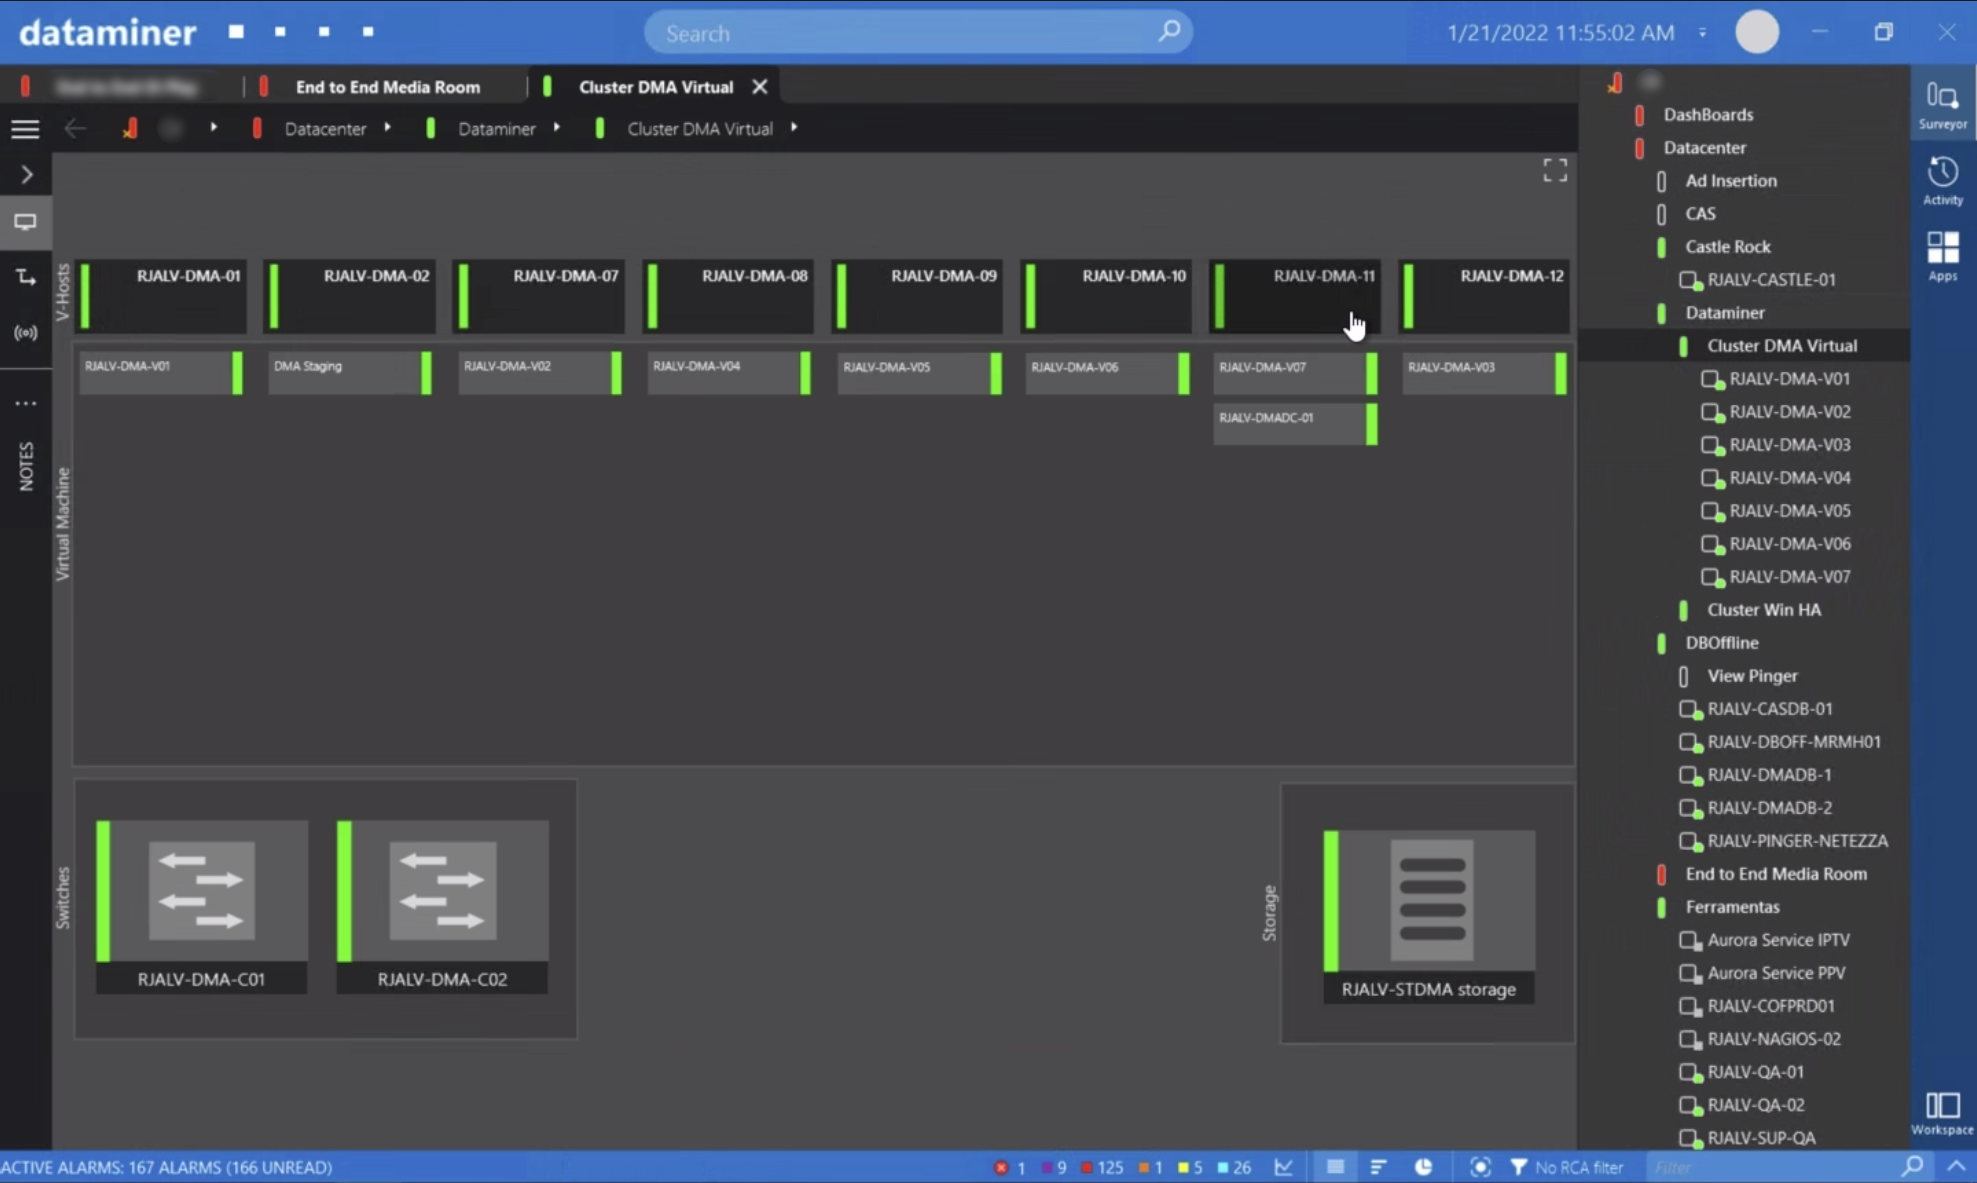 DataMiner is also used to constantly monitor the DataMiner infrastructure itself. This DataMiner System has been deployed on Microsoft Hyper-V, managing almost 3500 products and data sources in total and no less than 1100 DataMiner services.
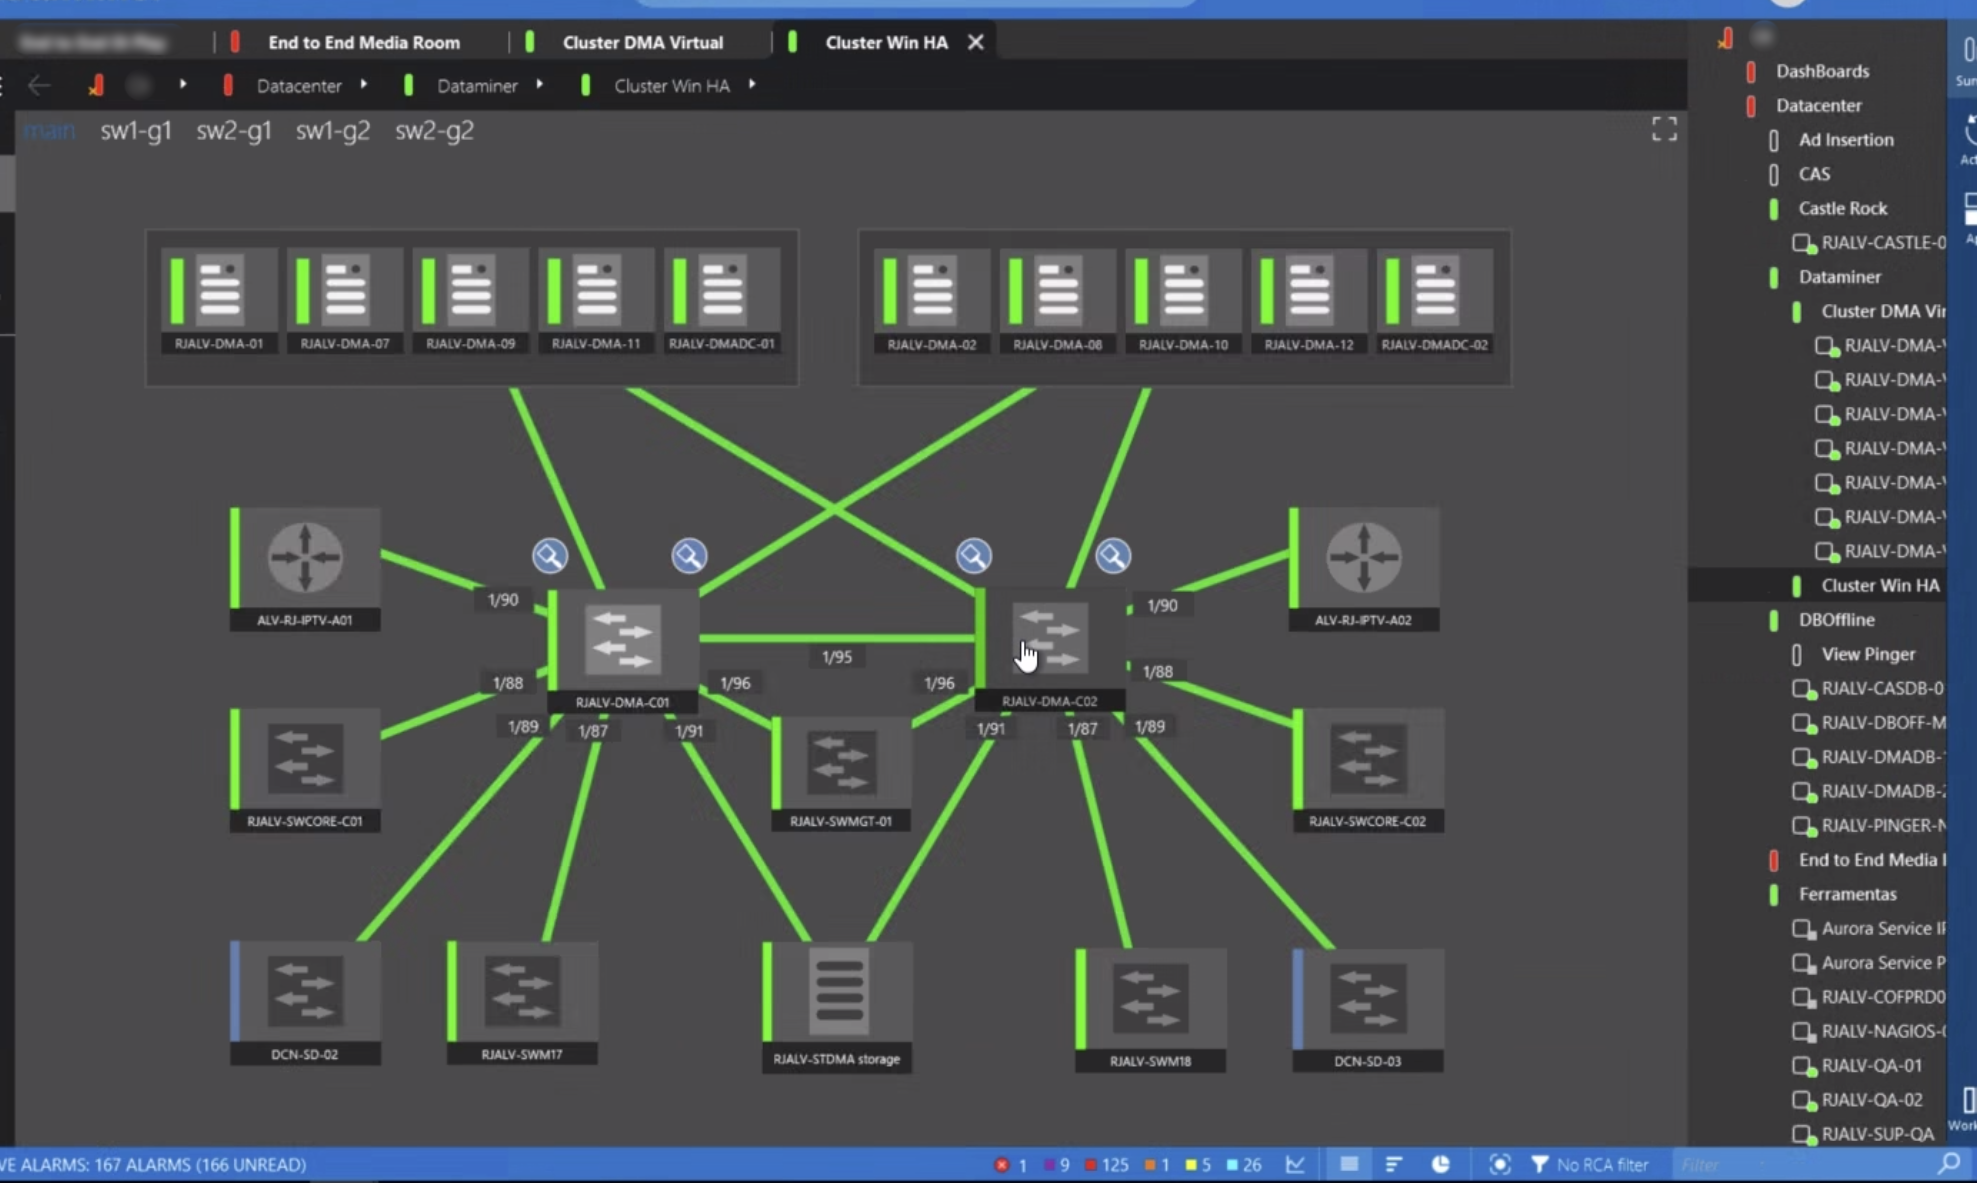 This screenshot shows DataMiner monitoring switch infrastructure and interfaces for the backbone network.
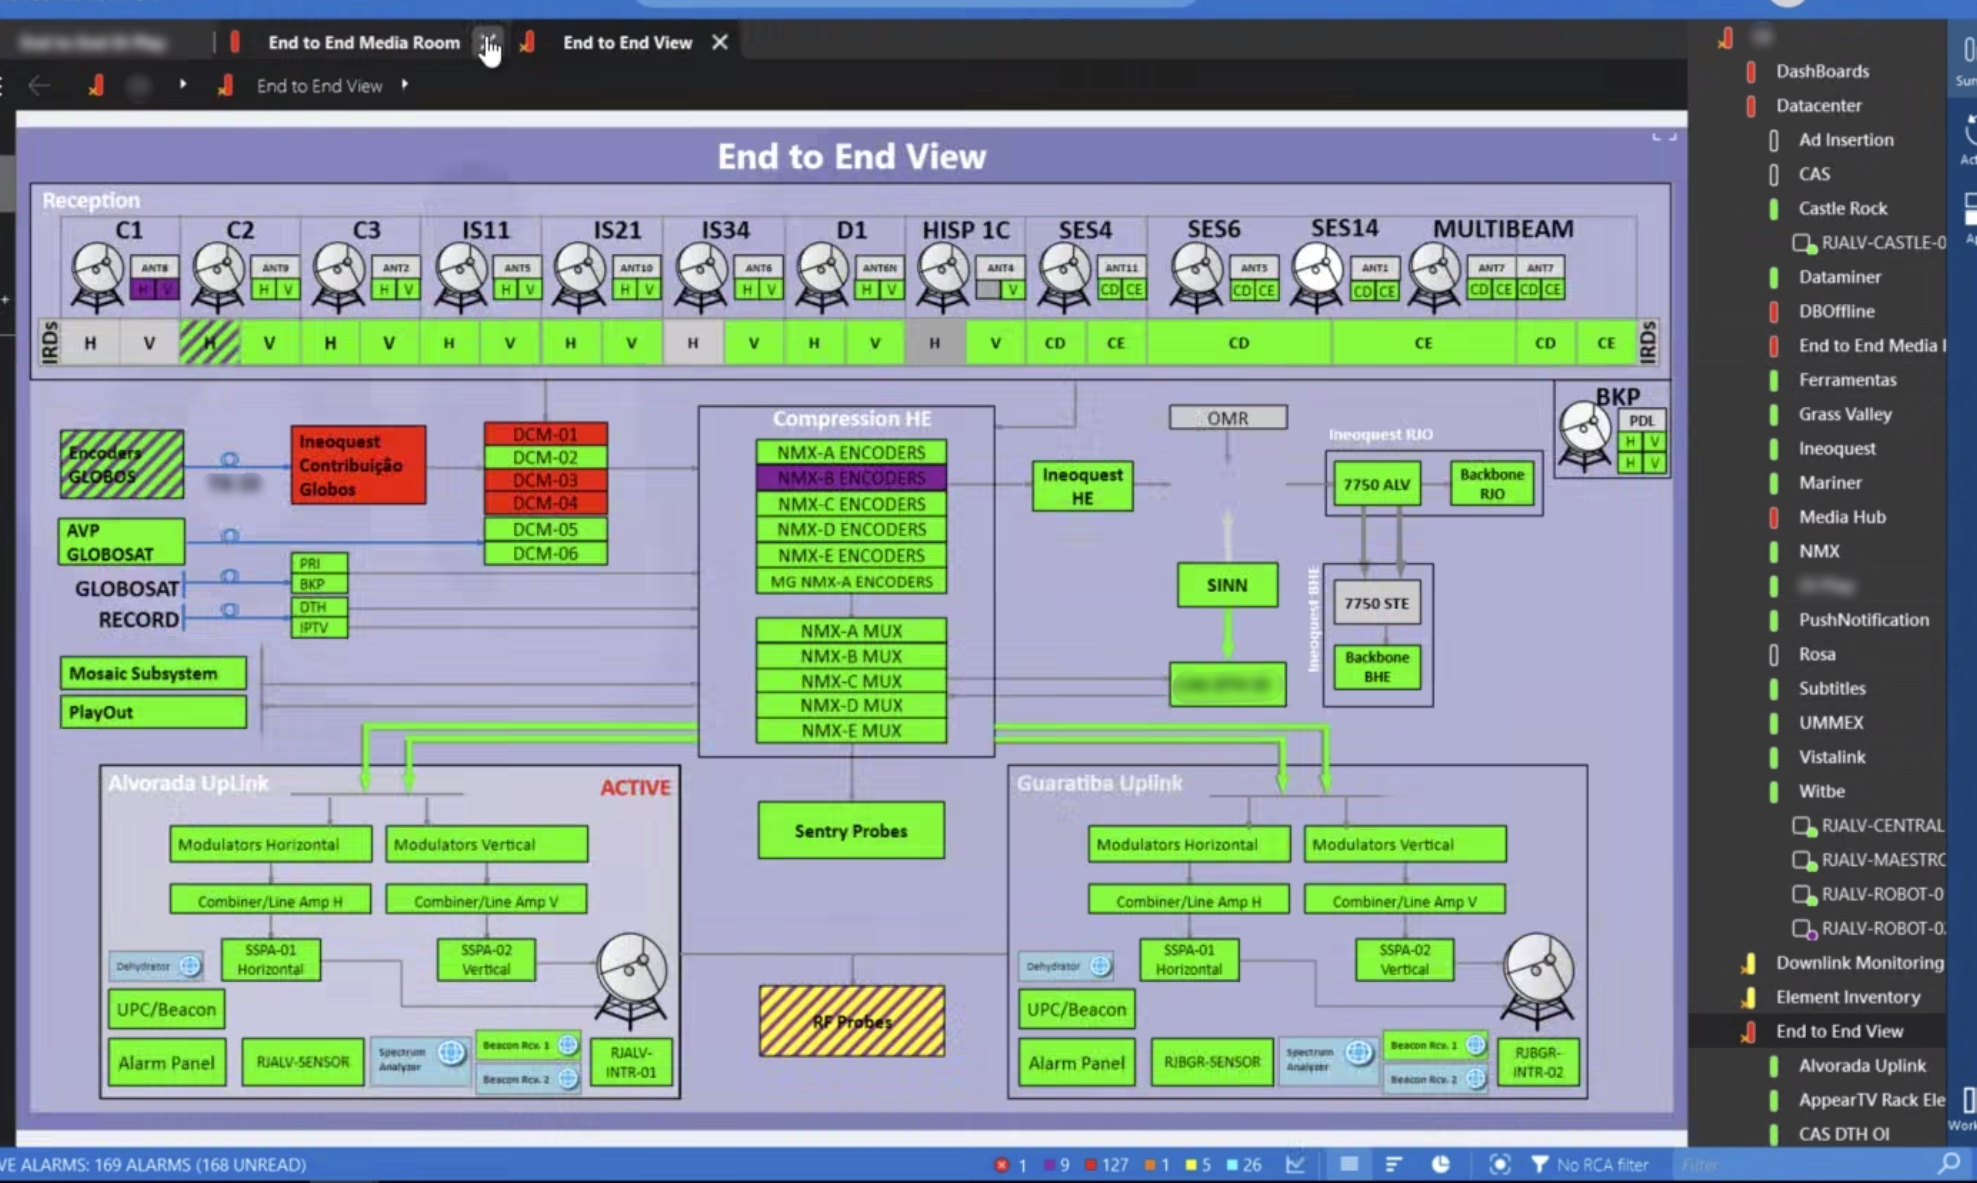 When the SatOps team logs in into DataMiner, they get a set of different views on the system. This example shows the DTH uplinks on two different sites.
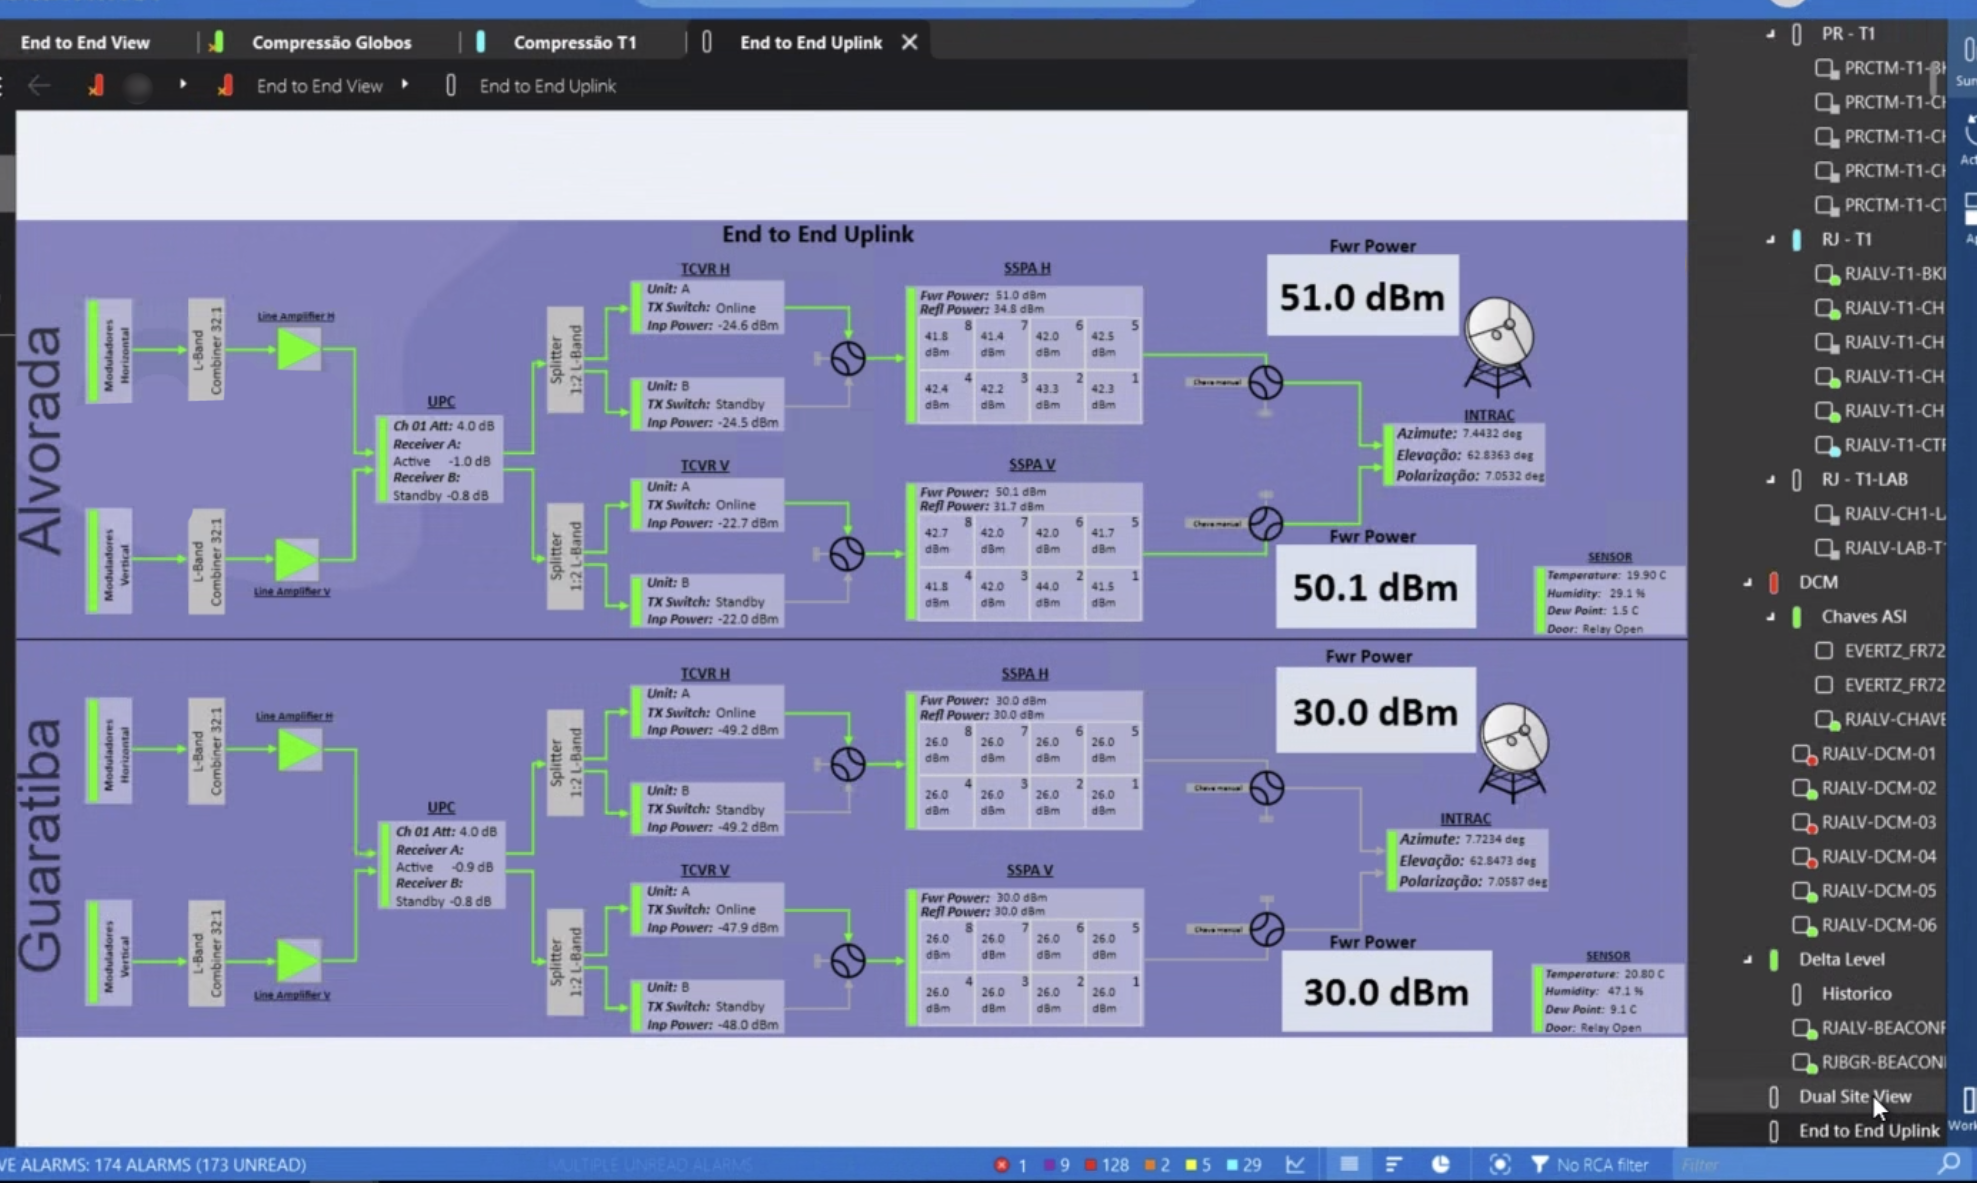 This is an E2E service overview for a redundant uplink.
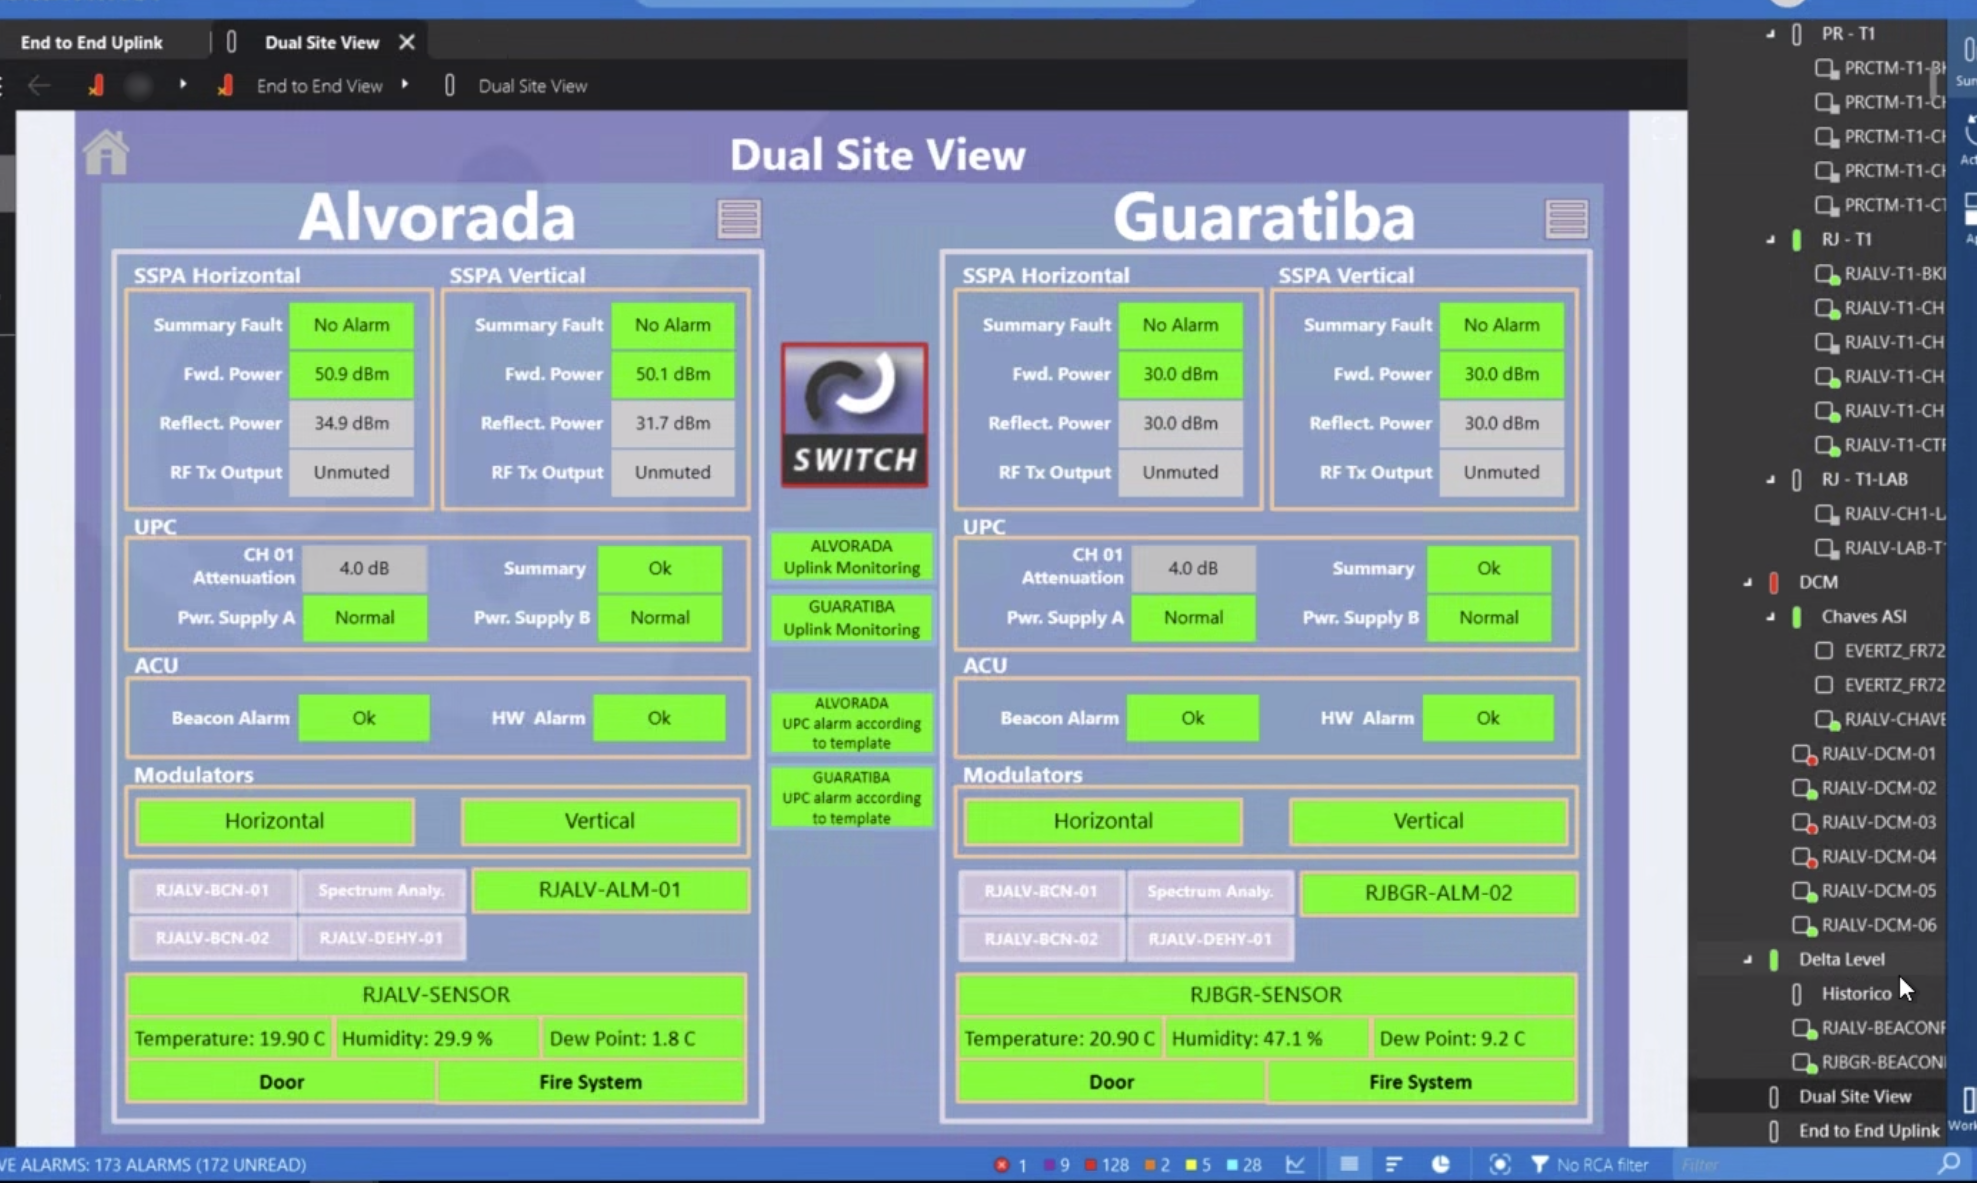 DataMiner also interfaces with environmental probes such as temperature sensors, checks door contacts for security, and even monitors the health state of the fire system.
 Finally, this control surface allows the operators to switch from one uplink site to another with just a single click.