example Use Case
Grafana Integration
What if you don’t want to use the full-blown DataMiner Cube client or the DataMiner dashboards to visualize and consume data coming from the DataMiner digital twin?
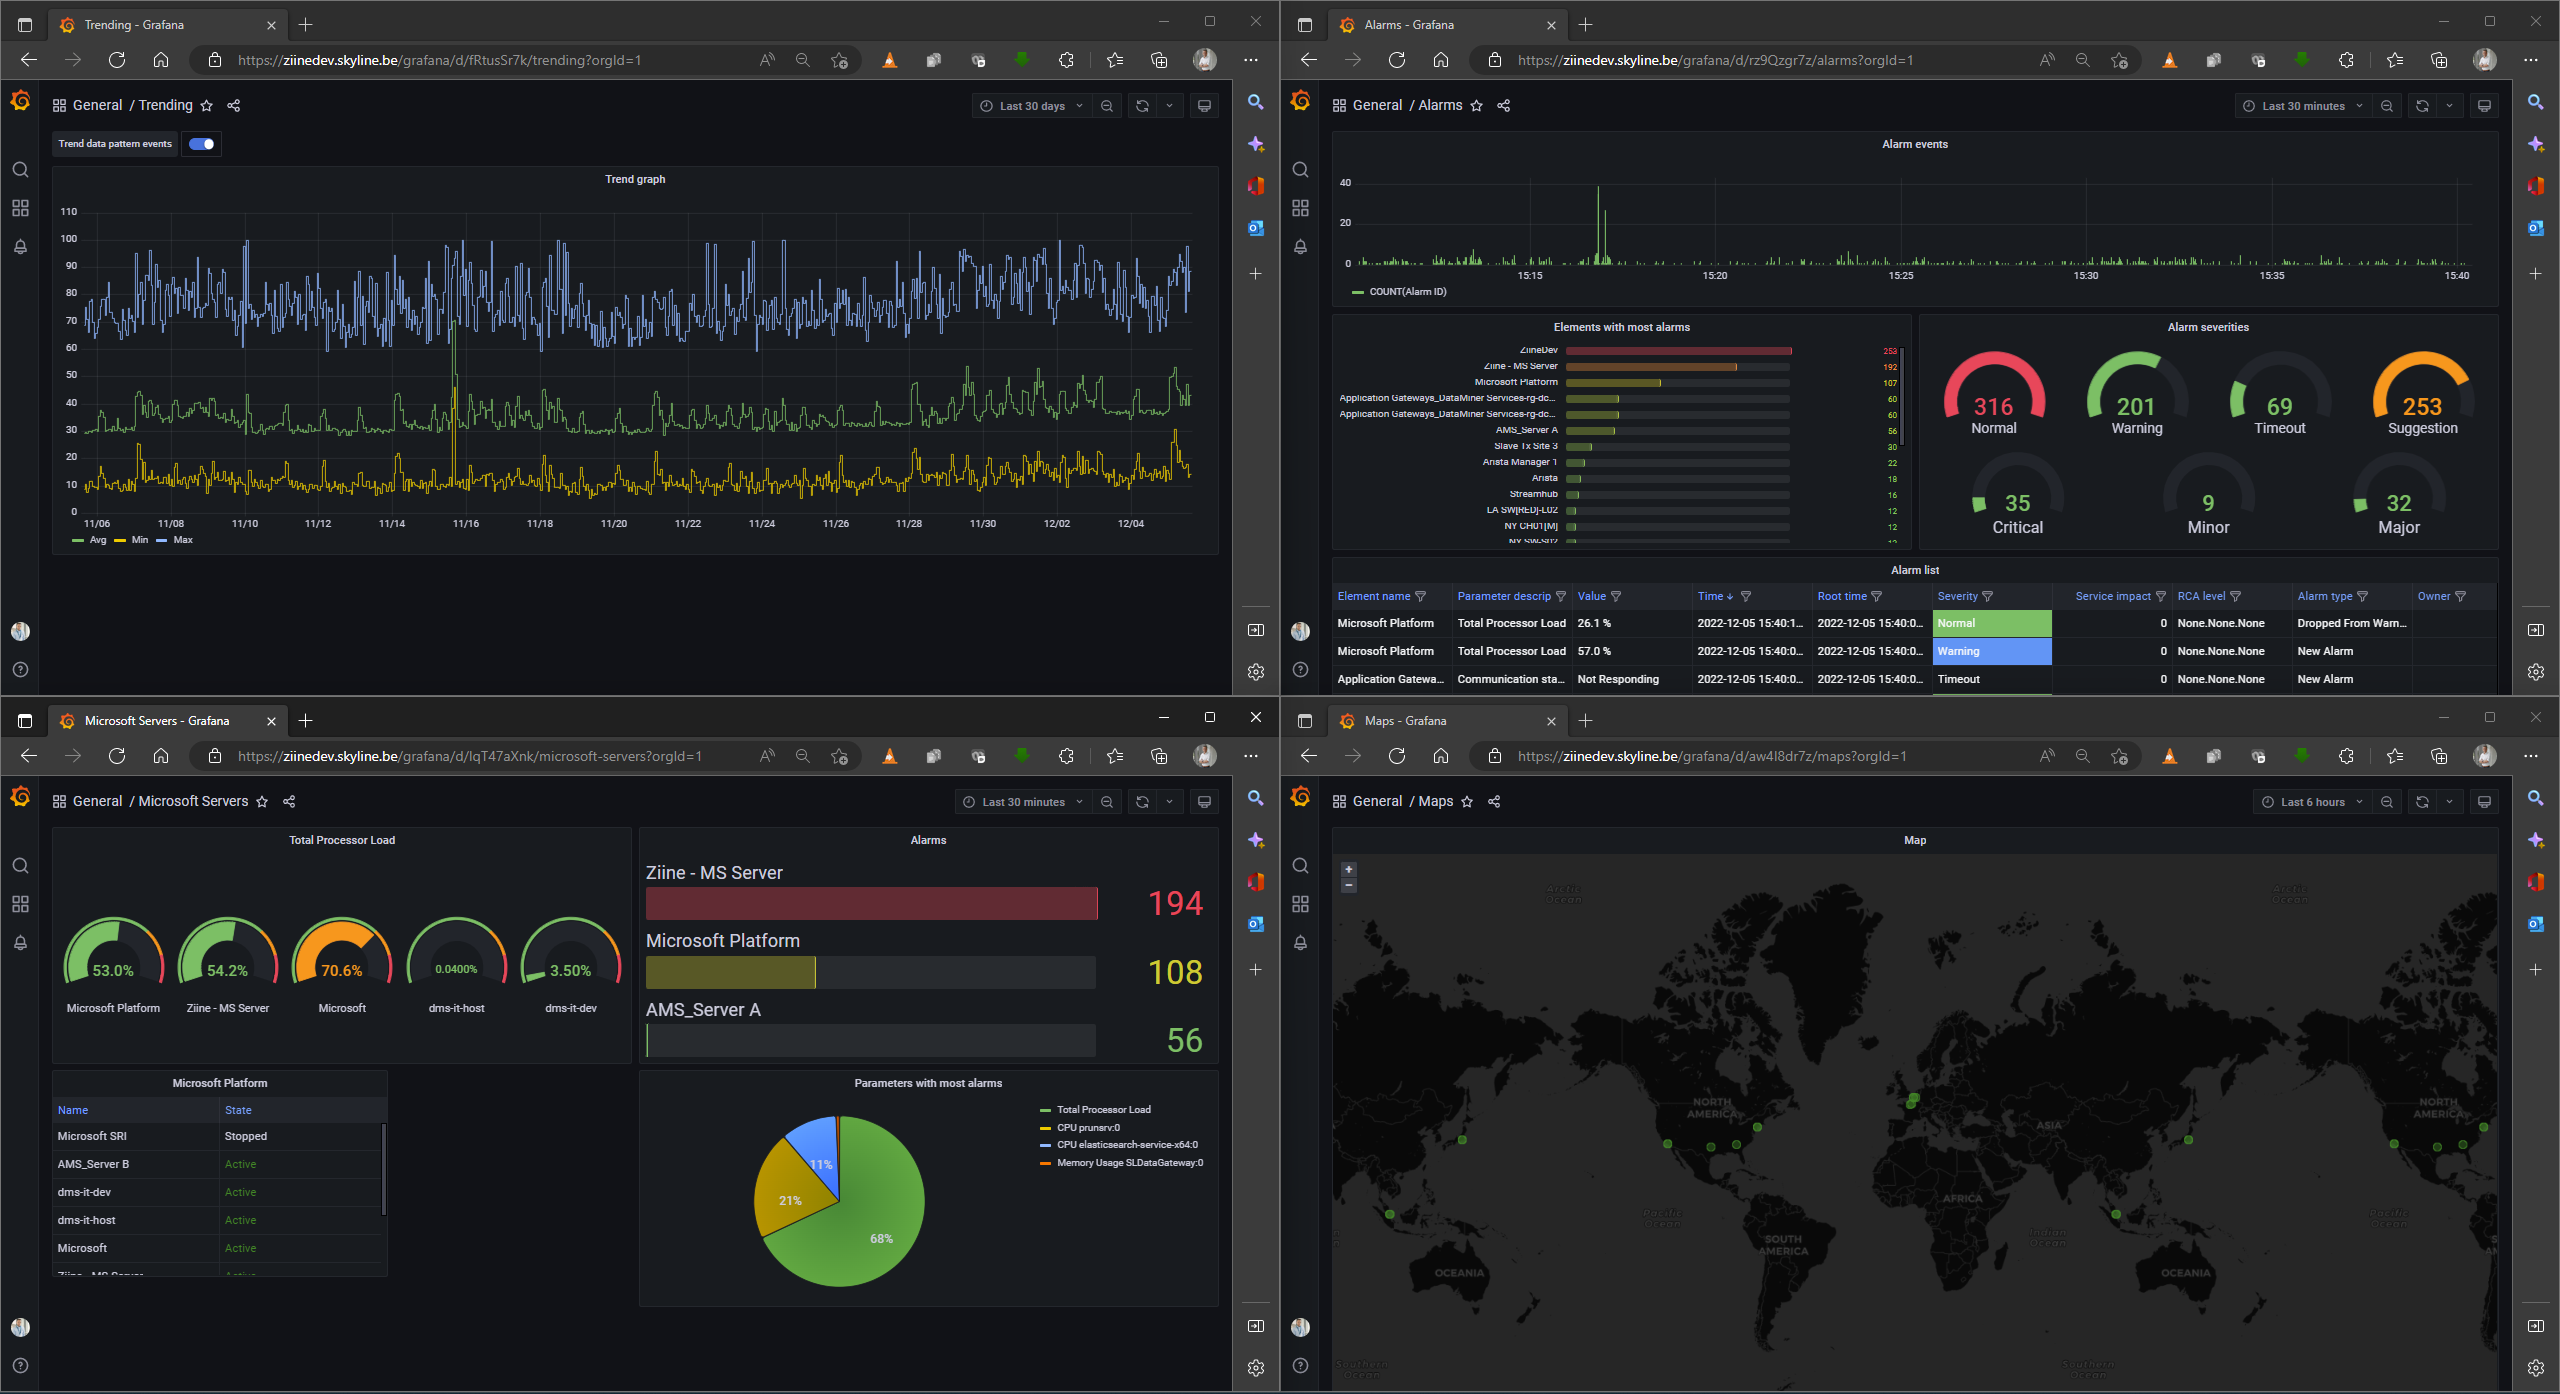
No problem: just have a look at this use case to learn how you can pull in data from DataMiner and visualize it in Grafana in real time using a Grafana data source plugin. If you want to take this one step further, you can also take every Grafana component that shows data from DataMiner and embed it in a DataMiner dashboard.
USE CASE DETAILS
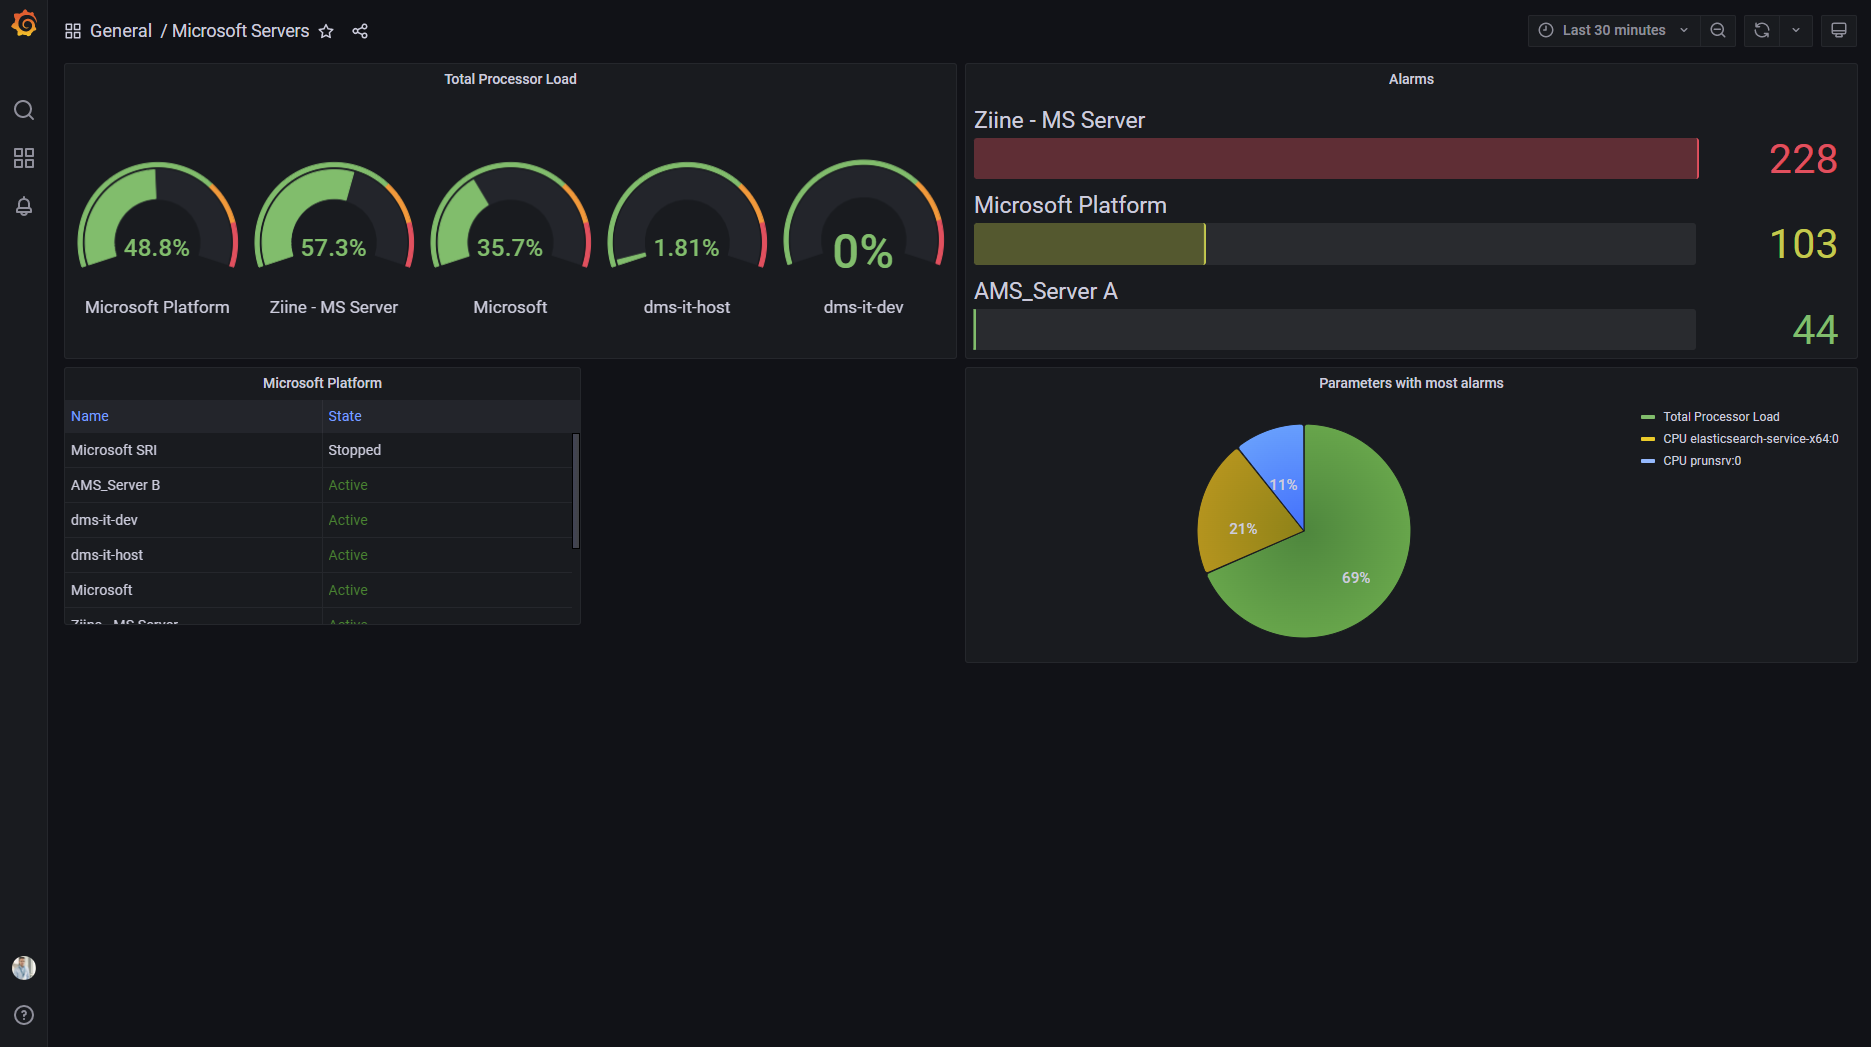 Let's start with a couple of Grafana examples. This screenshot shows metrics and parameters coming from several Microsoft operating systems managed by DataMiner, e.g. the number of alarms and total processor load per server, and this in real time.
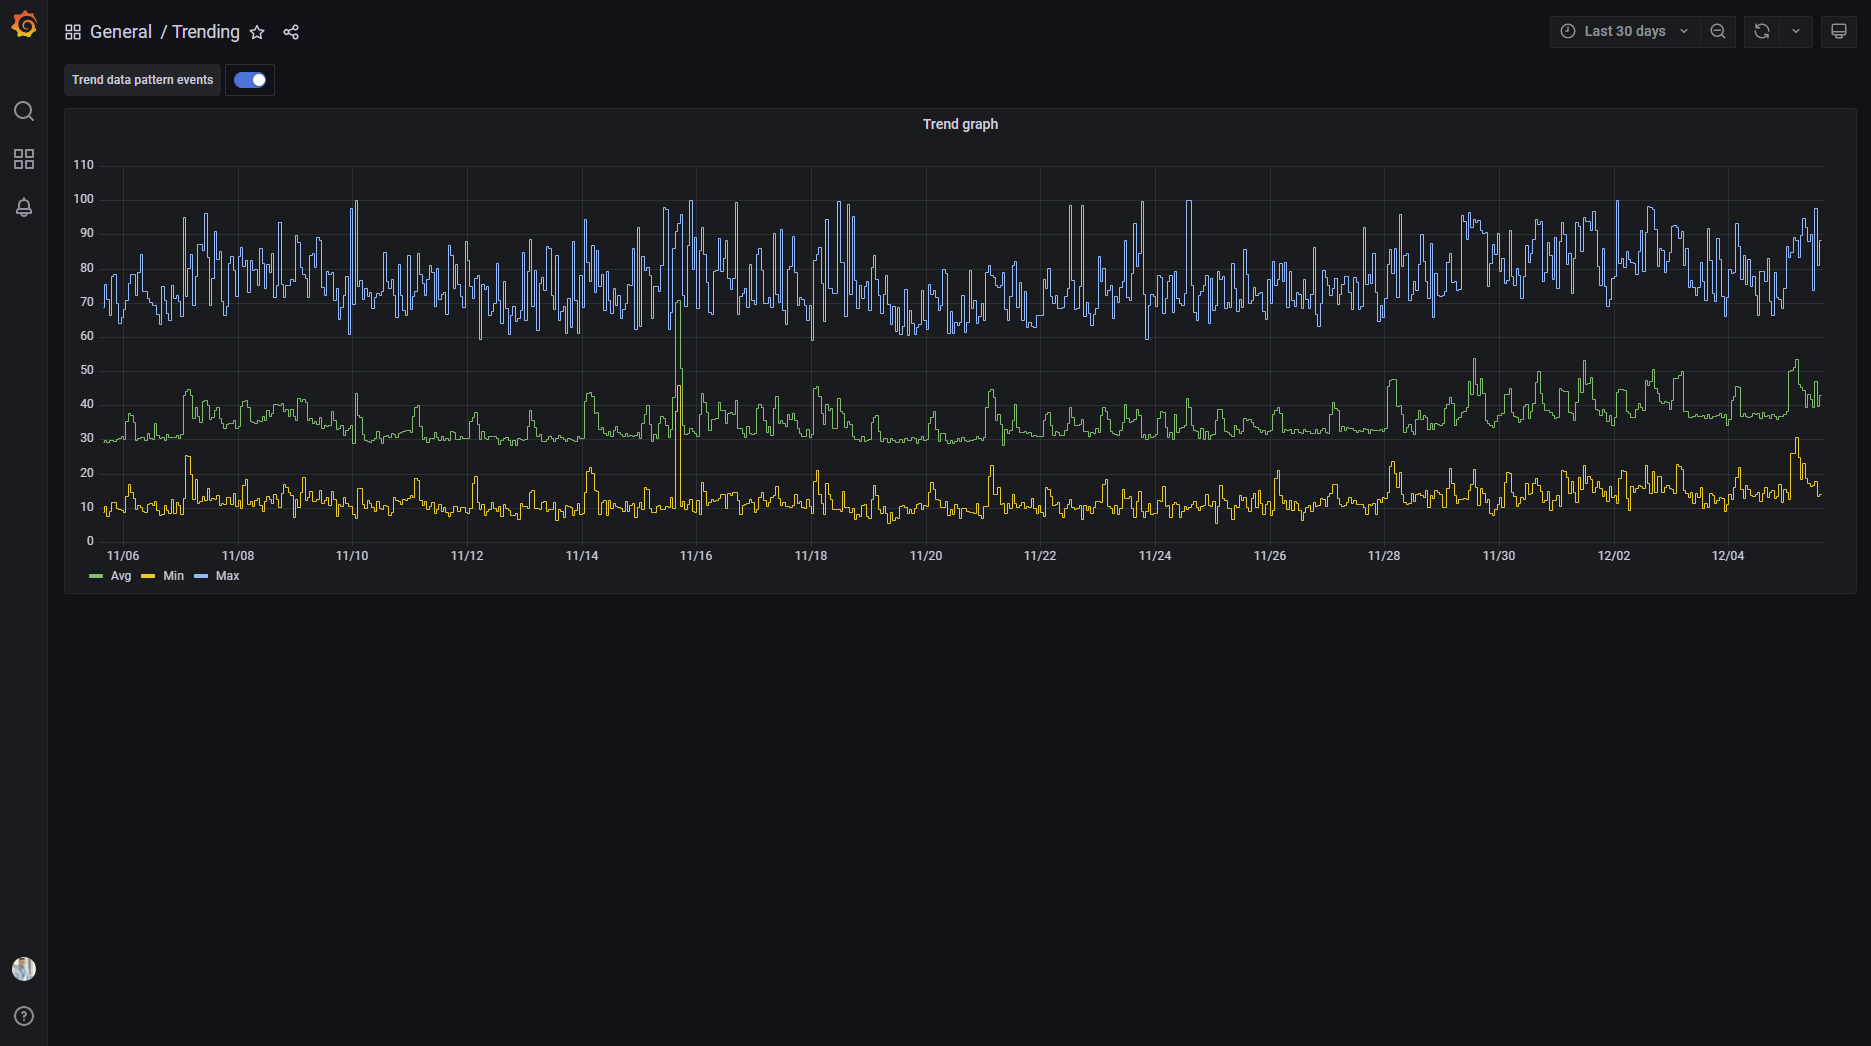 Here you can see some trend graphs stored in the DataMiner database, where DataMiner calculates the minimum, maximum, and average values via its built-in Generic Query Interface (GQI) before Grafana grabs the calculated data.
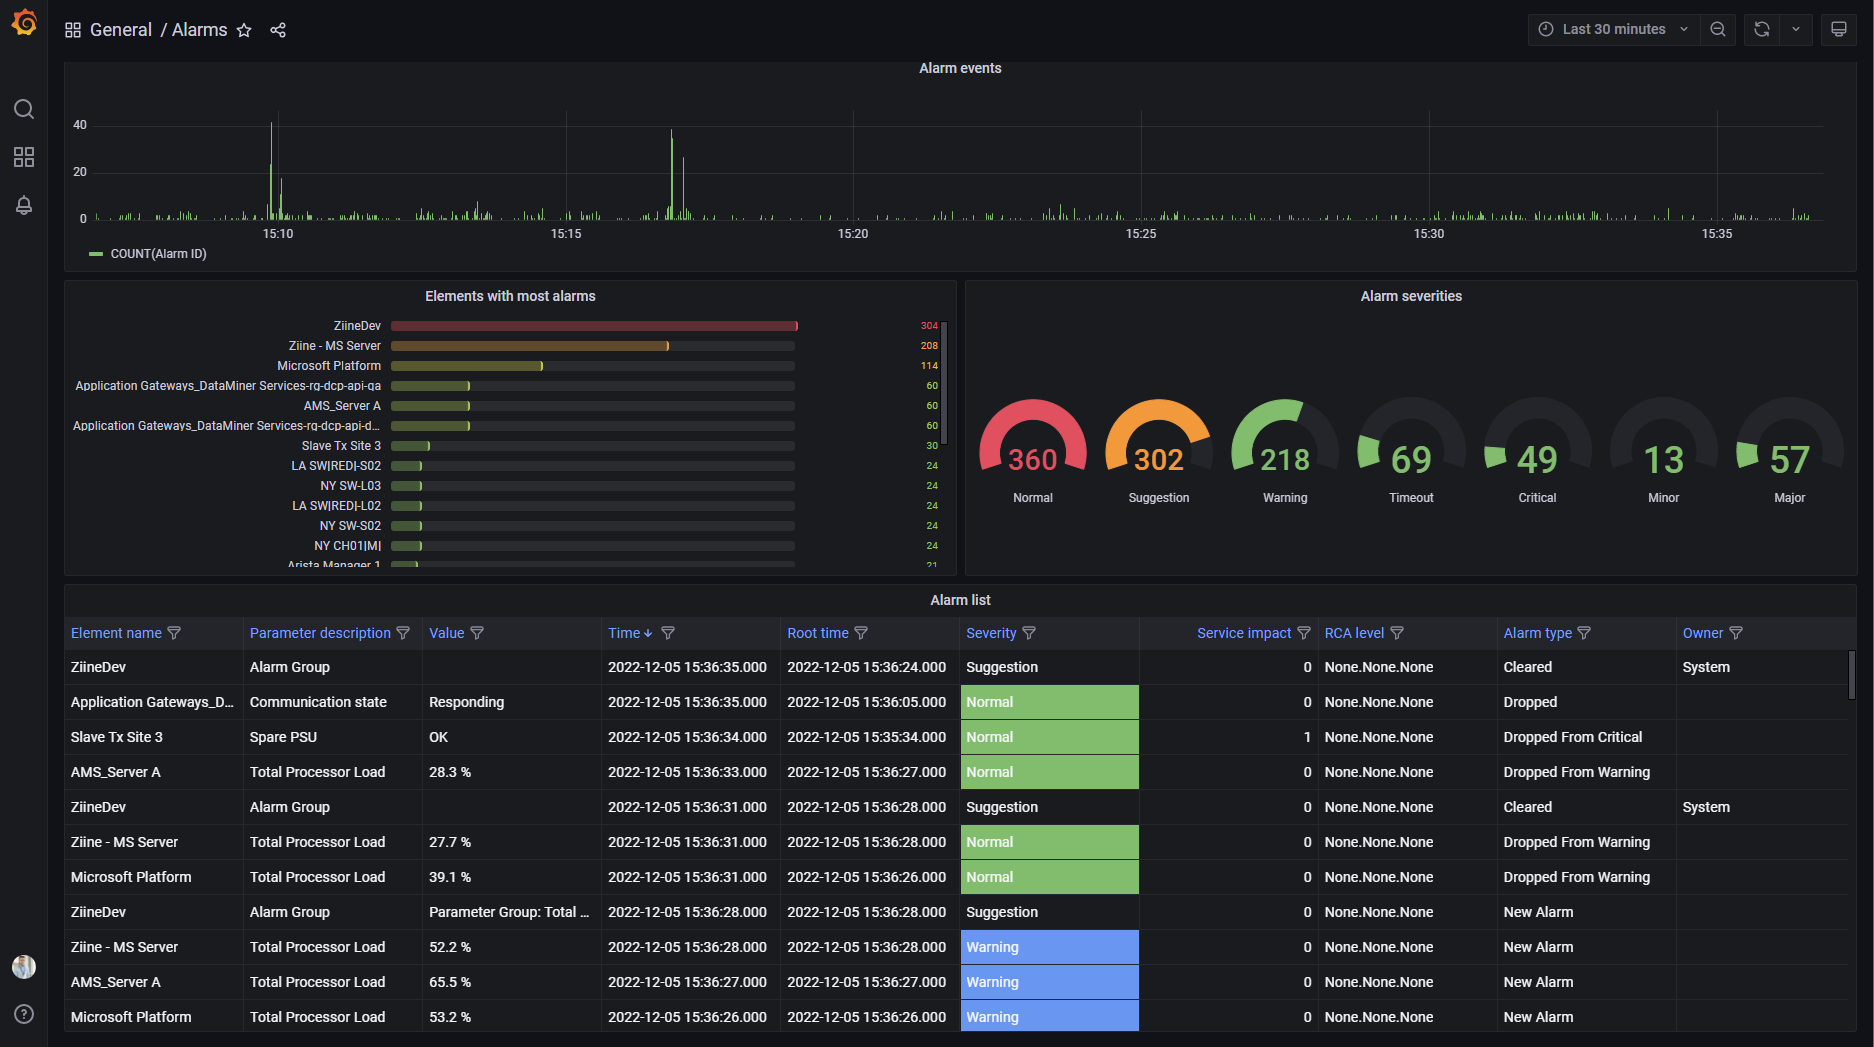 You can also access DataMiner alarms, their severity, and their history, and display this on Grafana.
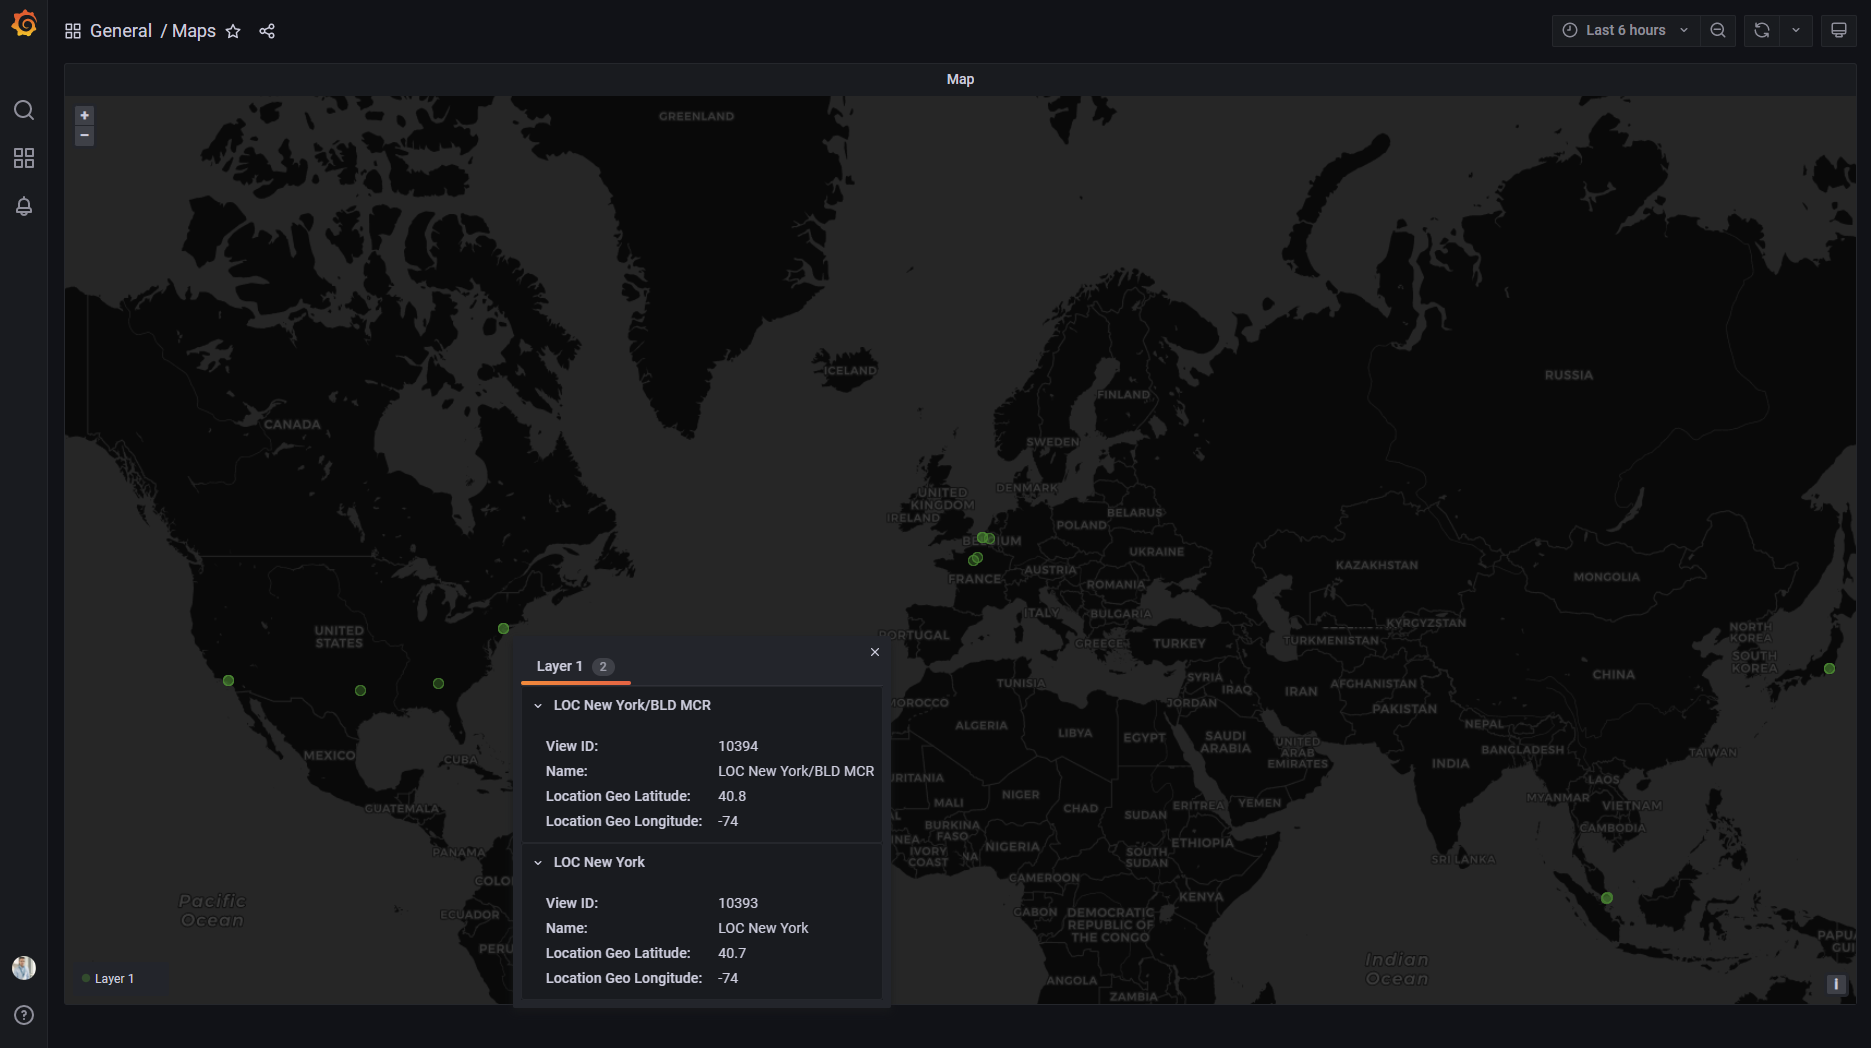 This screenshot shows a Grafana map component that displays geo information managed by DataMiner's IDP (Infrastructure Discovery and Provisioning) suite of tools.
 Here you can see the Grafana dashboard embedded in a DataMiner dashboard, combined with a DataMiner bar chart component.
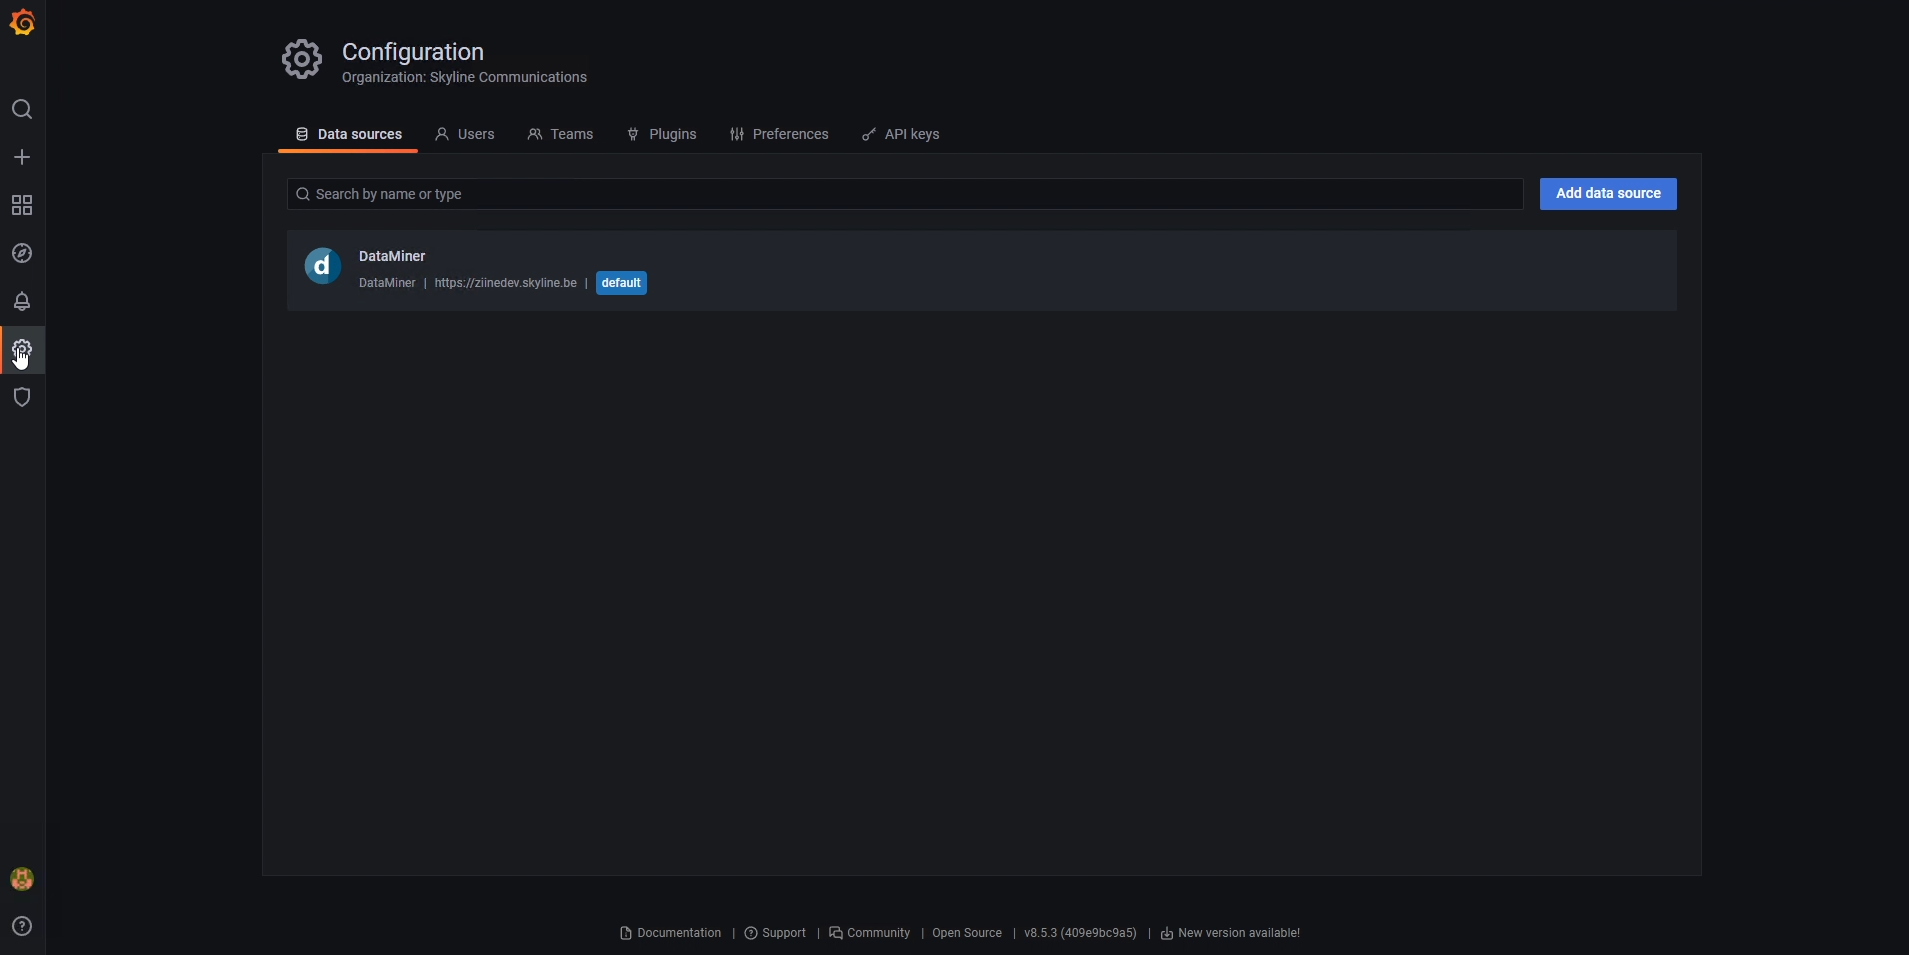 Wondering how this is done? You will soon find a Skyline data source plugin in the Grafana store. Don't hesitate to reach out to our team if you want to give this a try.
2 thoughts on “Grafana Integration”
Leave a Reply
You must be logged in to post a comment.
Nice! It would also be nice to have an Exporter for Grafana. That would reduce dependency by far, and use a basic prometheus for timeseries storage.
Would you have a course to better understand?