integration Use Case
DataMiner PTP app
2110

Check out this use case to see our PTP app in action at one of our customers in Japan.
USE CASE DETAILS
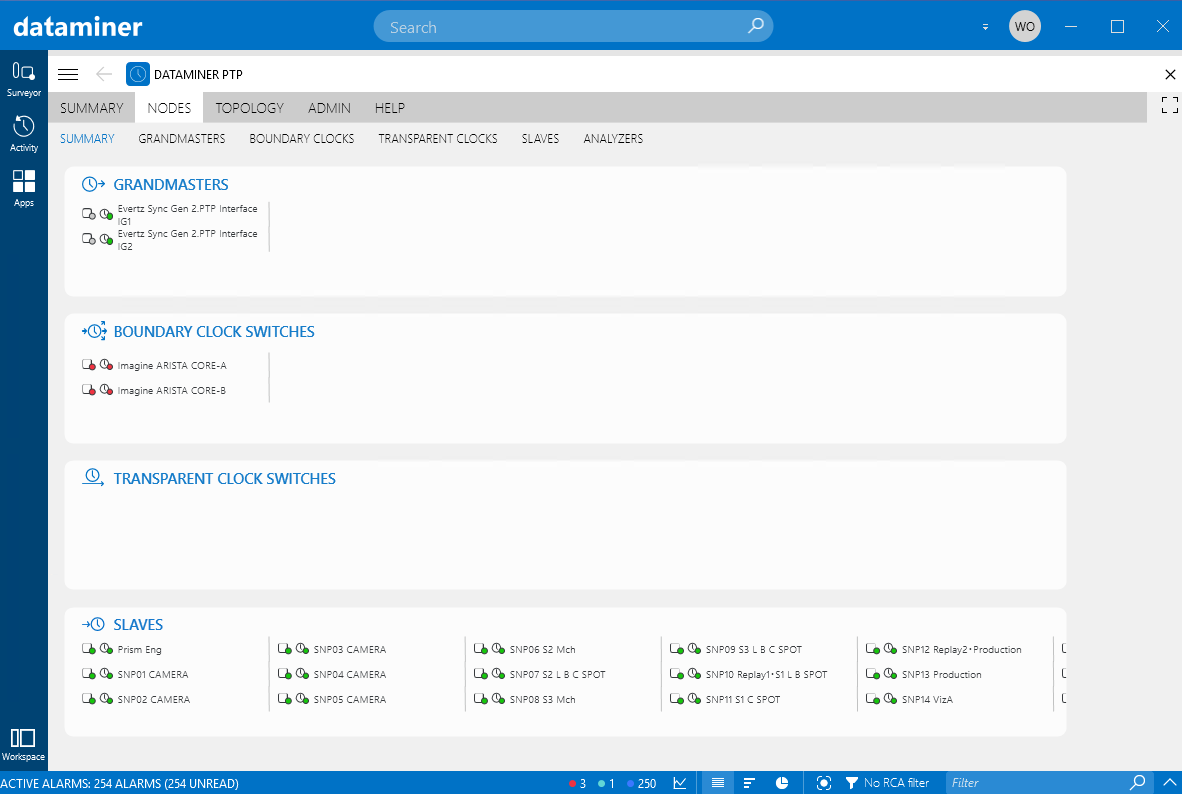
DataMiner PTP app comes with a set of pre-configured UIs. When you open the PTP app, you end up on the summary page.
This tab shows an overall summary of the entire PTP stack.
The information in this tab is displayed in several separate blocks.
 The PTP system summary block in the top-left corner shows:
At the top, the number of PTP nodes that are reporting the current active grandmaster. Clicking the table icon next to this counter opens a window listing the nodes that are not reporting a preferred grandmaster.
From left to right, the total number of grandmaster, boundary clock, transparent clock, and slave devices. For each of these, a summary icon displays the alarm color of the most severe PTP-related alarm on these devices. Clicking this icon opens a filtered alarm tab with the relevant alarms.
On the right, the currently active probe. This is the probe in charge of identifying the current active grandmaster clock in the PTP topology. A cogwheel icon next to the probe allows you to select a different probe.
The PTP system summary block in the top-left corner shows:
At the top, the number of PTP nodes that are reporting the current active grandmaster. Clicking the table icon next to this counter opens a window listing the nodes that are not reporting a preferred grandmaster.
From left to right, the total number of grandmaster, boundary clock, transparent clock, and slave devices. For each of these, a summary icon displays the alarm color of the most severe PTP-related alarm on these devices. Clicking this icon opens a filtered alarm tab with the relevant alarms.
On the right, the currently active probe. This is the probe in charge of identifying the current active grandmaster clock in the PTP topology. A cogwheel icon next to the probe allows you to select a different probe.
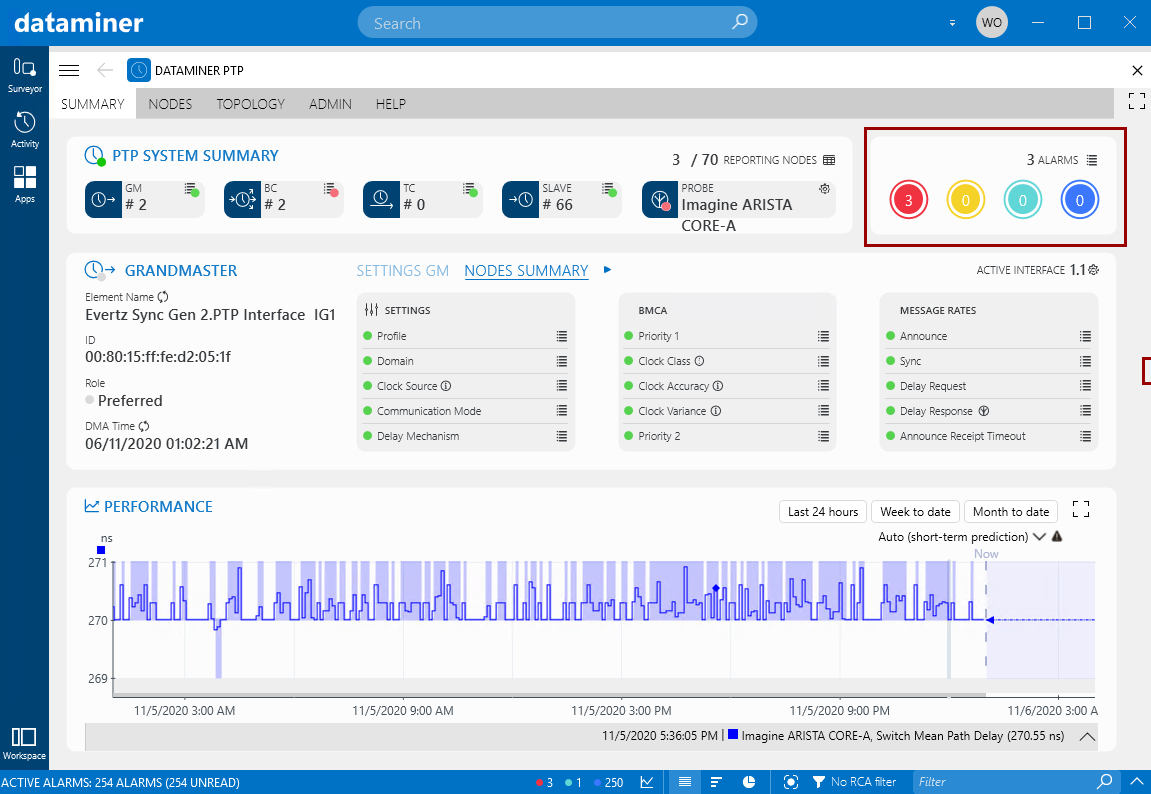 The alarms block in the top-right corner shows a summary of all PTP-related alarms in the entire system (total, critical, major, minor and warning). Clicking the list icon next to the total alarm count will open an alarm tab listing all these alarms. Clicking one of the four other alarm counters will open an alarm tab with these alarms filtered on the alarm severity in question.
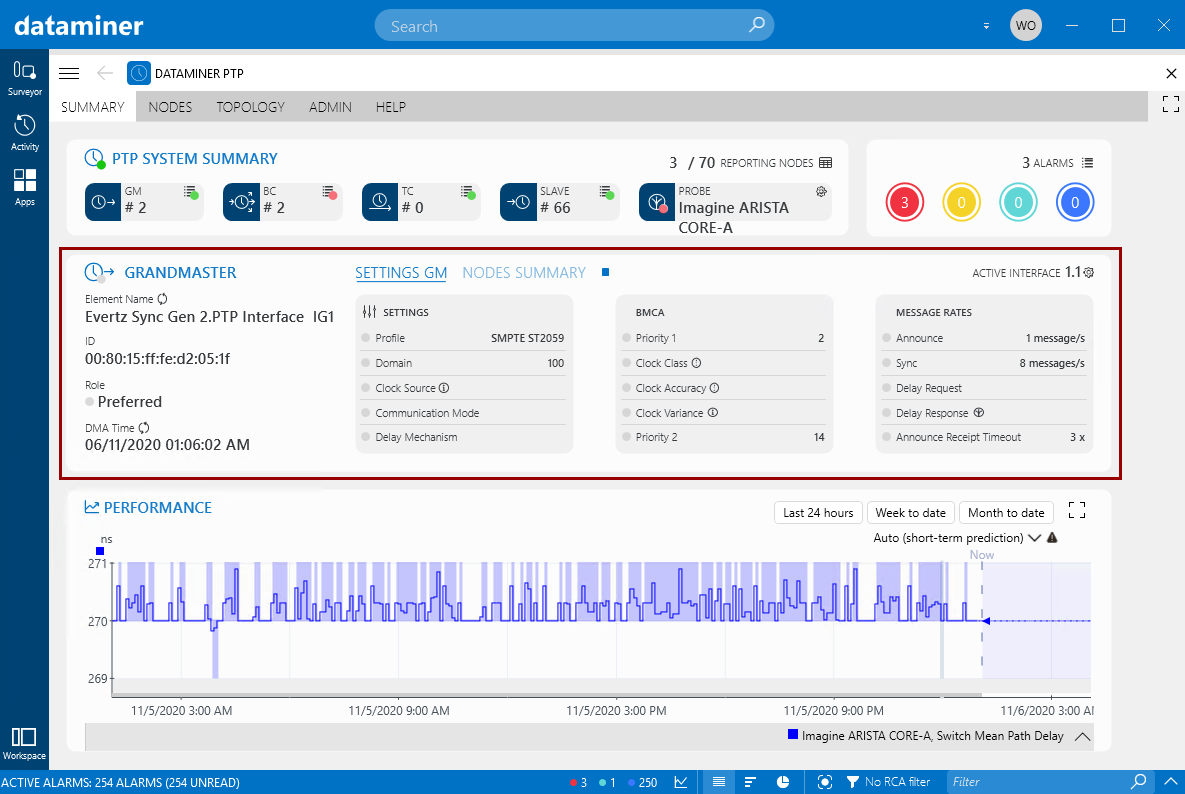 In the grandmaster block, you can find the following information:
On the left, a block with general information about the grandmaster:
The name of the current grandmaster clock (i.e. the grandmaster clock reported by the PTP probe). A toggle button next to the name allows you to switch between the element name in DataMiner or the alias.
The ID of the current grandmaster clock.
The role of the current grandmaster clock. This can be either Potential or Preferred. If it is Preferred, this means that this grandmaster should always be used to synchronize if possible.
The time of the DMA or the grandmaster clock. A toggle button allows you to switch between these. The DMA time is the local time of the DataMiner Agent, which is not equal to the PTP time, unless the DataMiner Agent is synchronized with the PTP domain.
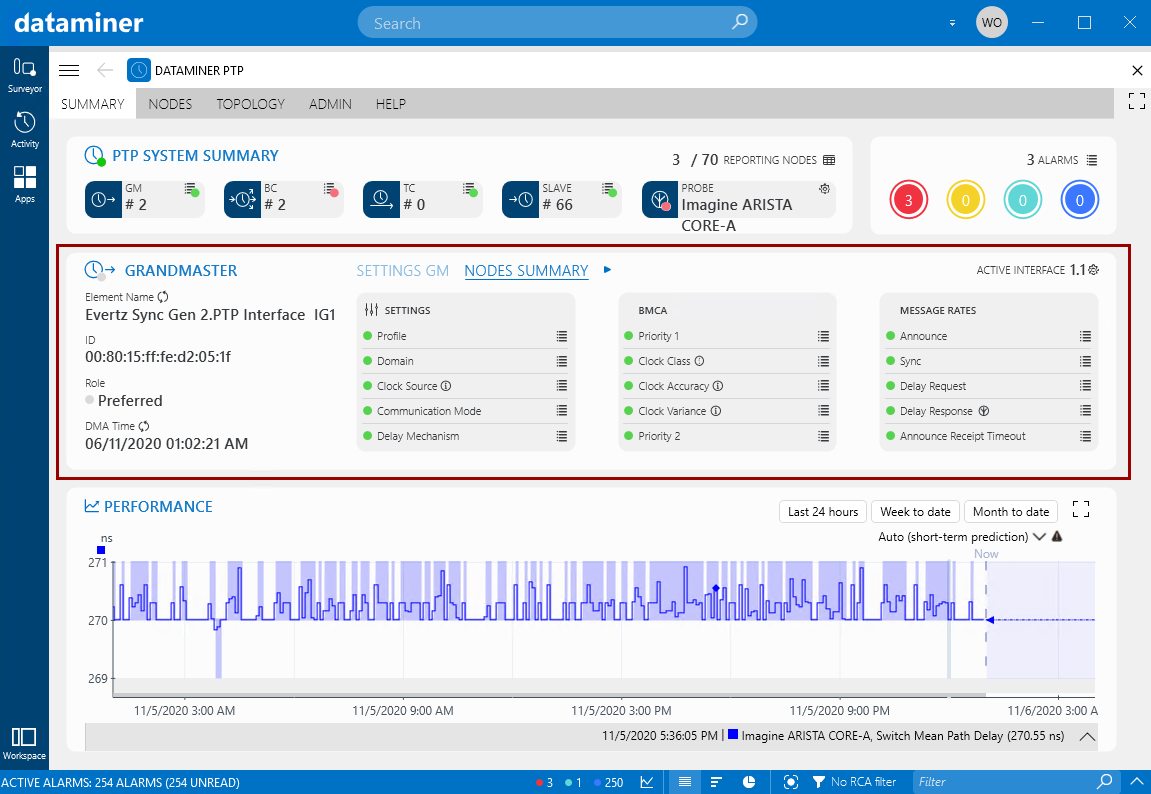
In the grandmaster block, you can find the following information:
On the left, a block with general information about the grandmaster:
The name of the current grandmaster clock (i.e. the grandmaster clock reported by the PTP probe). A toggle button next to the name allows you to switch between the element name in DataMiner or the alias.
The ID of the current grandmaster clock.
The role of the current grandmaster clock. This can be either Potential or Preferred. If it is Preferred, this means that this grandmaster should always be used to synchronize if possible.
The time of the DMA or the grandmaster clock. A toggle button allows you to switch between these. The DMA time is the local time of the DataMiner Agent, which is not equal to the PTP time, unless the DataMiner Agent is synchronized with the PTP domain.
 Next to this, two tabs are available:
In the Settings GM tab, the Settings, BMCA (Best Master Clock Algorithm) and Message Rates columns show the information related to the grandmaster.
The Nodes Summary tab, these same columns show the aggregated alarm information for all nodes. Next to each parameter, a list icon is available that opens a filtered alarm tab when clicked.
Next to the tab names, an icon is available that can be clicked to switch between “play” and “stop” mode. In “play” mode, the app will automatically switch between the two tabs at regular intervals. In “stop” mode, only the last selected tab remains displayed.
In the top-right corner, the name of the current grandmaster interface is displayed. Click the cogwheel button next to this name to select a different interface.
Next to this, two tabs are available:
In the Settings GM tab, the Settings, BMCA (Best Master Clock Algorithm) and Message Rates columns show the information related to the grandmaster.
The Nodes Summary tab, these same columns show the aggregated alarm information for all nodes. Next to each parameter, a list icon is available that opens a filtered alarm tab when clicked.
Next to the tab names, an icon is available that can be clicked to switch between “play” and “stop” mode. In “play” mode, the app will automatically switch between the two tabs at regular intervals. In “stop” mode, only the last selected tab remains displayed.
In the top-right corner, the name of the current grandmaster interface is displayed. Click the cogwheel button next to this name to select a different interface.
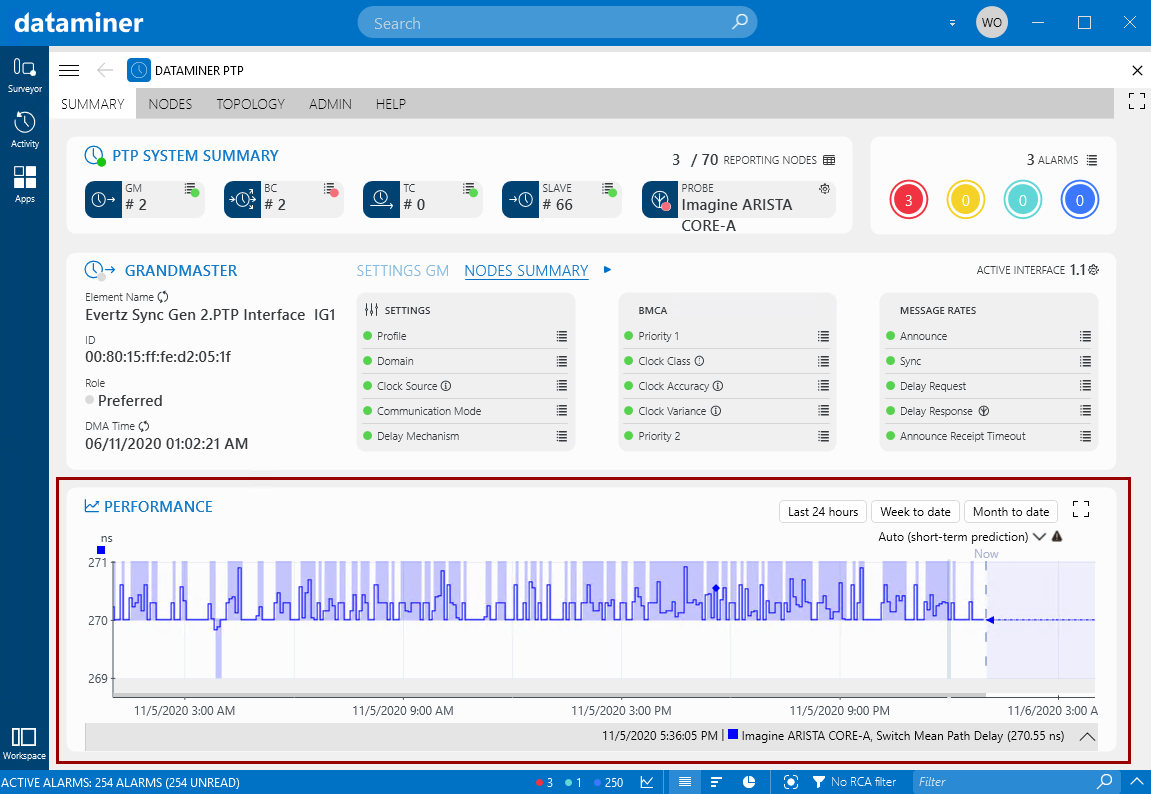 The performance block at the bottom of the tab allows you to track the overall PTP performance by monitoring PTP metrics that have trending activated (e.g. Offset From Master and Mean Path Delay). Below the trend graph, you can select any trended PTP parameter from any PTP node. If you want to display the trend graph in full-screen mode, click the full-screen icon in the top-right corner of this block.
 This tab consists of the following subtabs:
Summary: Lists all PTP nodes in the system, grouped by PTP role, with two icons for each node:
An icon showing the element alarm state. Clicking this icon will open the element card for this device.
An icon showing the overall alarm state of the PTP-related parameters. Clicking this icon will open an alarm tab with the relevant alarms.
For each device type, the nodes are sorted by severity.
This tab consists of the following subtabs:
Summary: Lists all PTP nodes in the system, grouped by PTP role, with two icons for each node:
An icon showing the element alarm state. Clicking this icon will open the element card for this device.
An icon showing the overall alarm state of the PTP-related parameters. Clicking this icon will open an alarm tab with the relevant alarms.
For each device type, the nodes are sorted by severity.
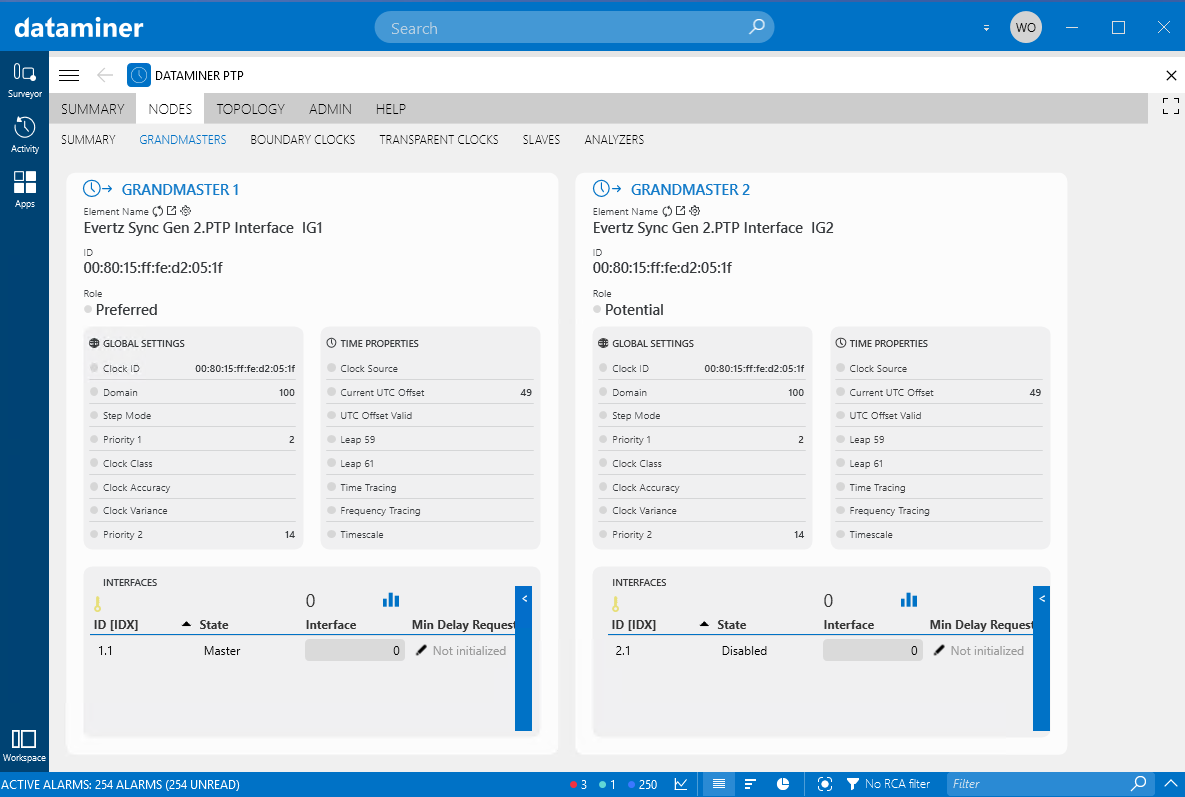 Grandmasters: Allows you to compare a number of parameters as well as the PTP interfaces of two grandmaster clocks.
Above the element name or alias of each displayed grandmaster clock, three icons are available:
A toggle icon that allows you to switch between displaying the name of the grandmaster clock or its alias.
An icon that opens the element card for the grandmaster clock.
A cogwheel icon that allows you to select a different grandmaster clock to compare.
Grandmasters: Allows you to compare a number of parameters as well as the PTP interfaces of two grandmaster clocks.
Above the element name or alias of each displayed grandmaster clock, three icons are available:
A toggle icon that allows you to switch between displaying the name of the grandmaster clock or its alias.
An icon that opens the element card for the grandmaster clock.
A cogwheel icon that allows you to select a different grandmaster clock to compare.
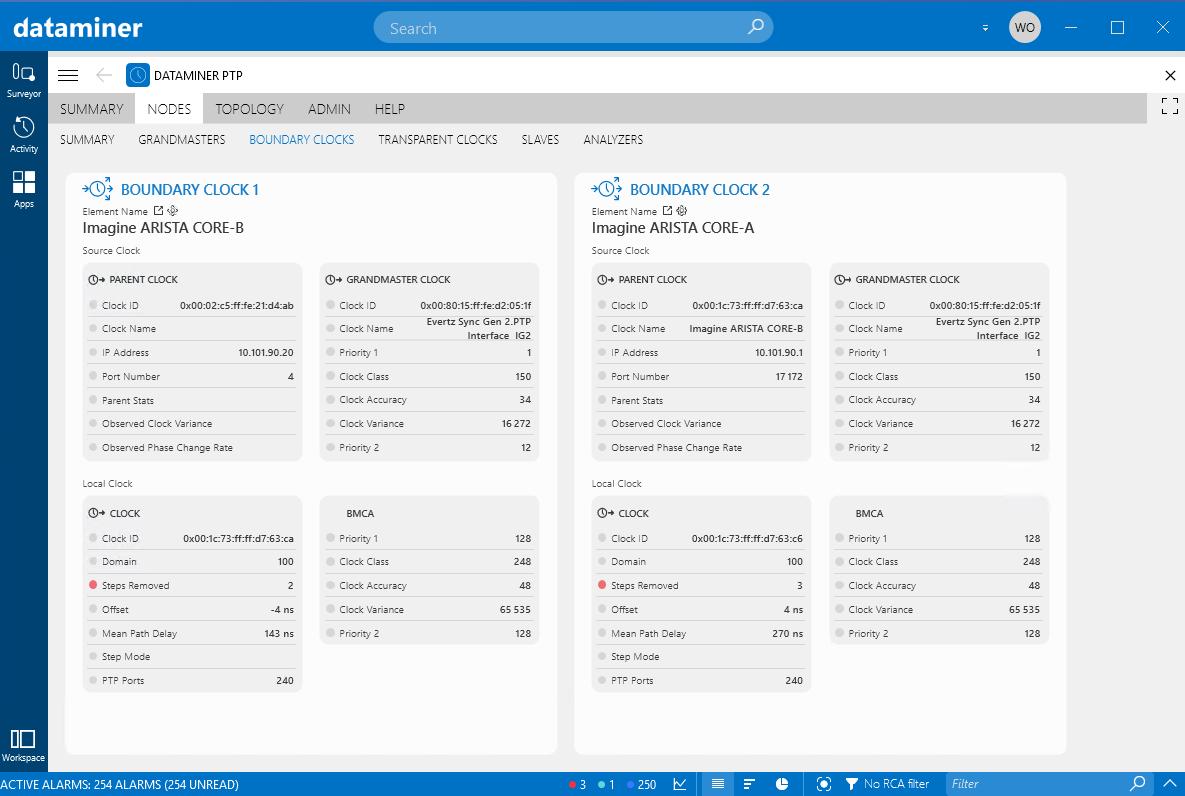 Boundary clocks: Allows you to compare a number of parameters of two boundary clocks.
Two random boundary clocks are selected by default. Above the name of each displayed boundary clock, two icons are available:
An icon that will open the element card of the boundary clock, which contains in-depth information on all PTP interfaces of the clock.
A cogwheel icon that allows you to select a different boundary clock to compare with.
Boundary clocks: Allows you to compare a number of parameters of two boundary clocks.
Two random boundary clocks are selected by default. Above the name of each displayed boundary clock, two icons are available:
An icon that will open the element card of the boundary clock, which contains in-depth information on all PTP interfaces of the clock.
A cogwheel icon that allows you to select a different boundary clock to compare with.
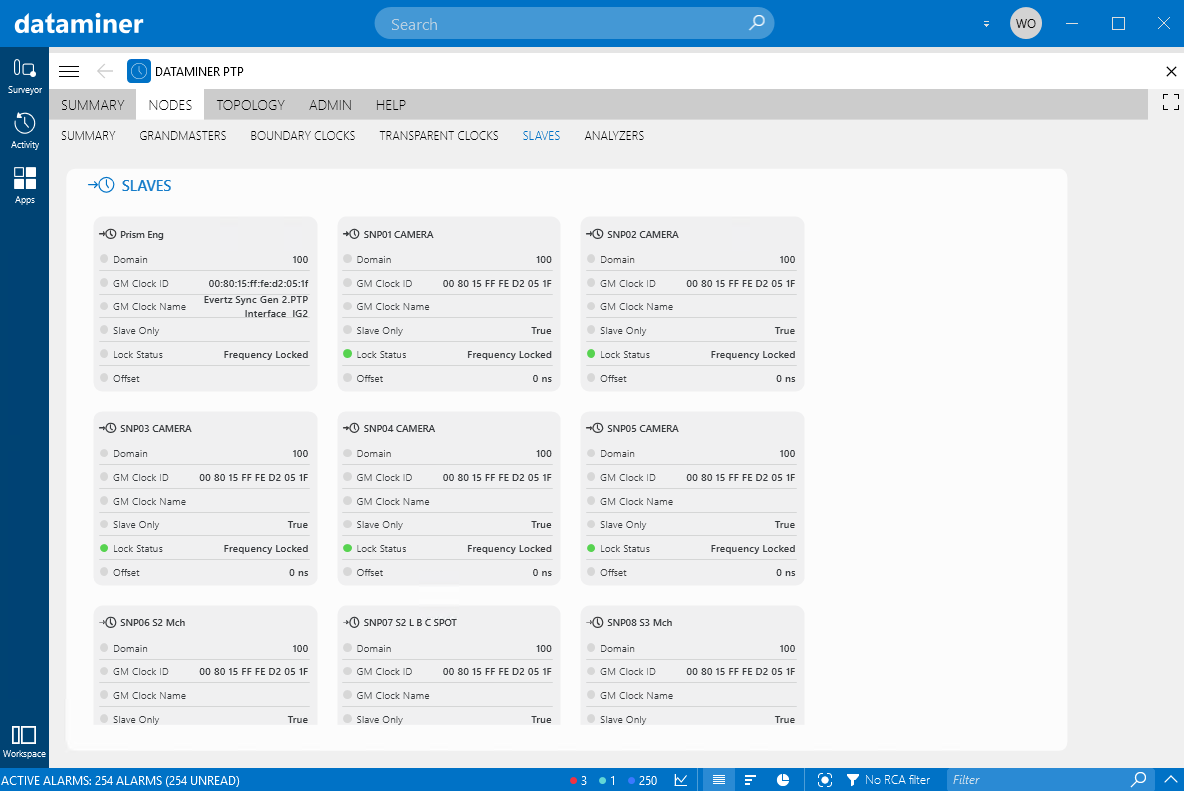 Slaves: Lists all slaves in the PTP topology, each with a number of PTP-related parameters.
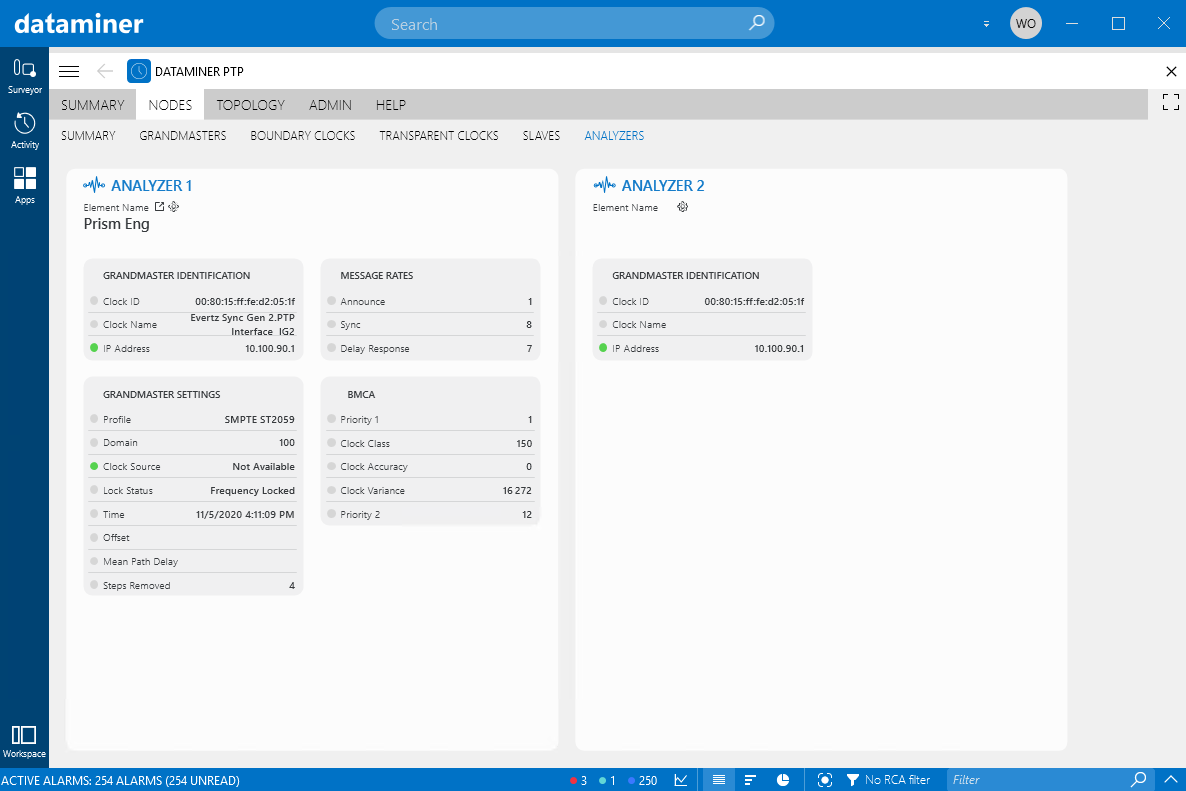 Analyzers: Allows you to compare a number of parameters of two PTP analyzers, i.e. slave devices that have been specially assigned to monitor and analyze the PTP signal they retrieve from a clock.
Above the element name of each displayed PTP analyzer, two icons are available:
An icon that will open the element card of the PTP analyzer.
A cogwheel icon that can be used to select a different PTP analyzer to compare with.
Analyzers: Allows you to compare a number of parameters of two PTP analyzers, i.e. slave devices that have been specially assigned to monitor and analyze the PTP signal they retrieve from a clock.
Above the element name of each displayed PTP analyzer, two icons are available:
An icon that will open the element card of the PTP analyzer.
A cogwheel icon that can be used to select a different PTP analyzer to compare with.
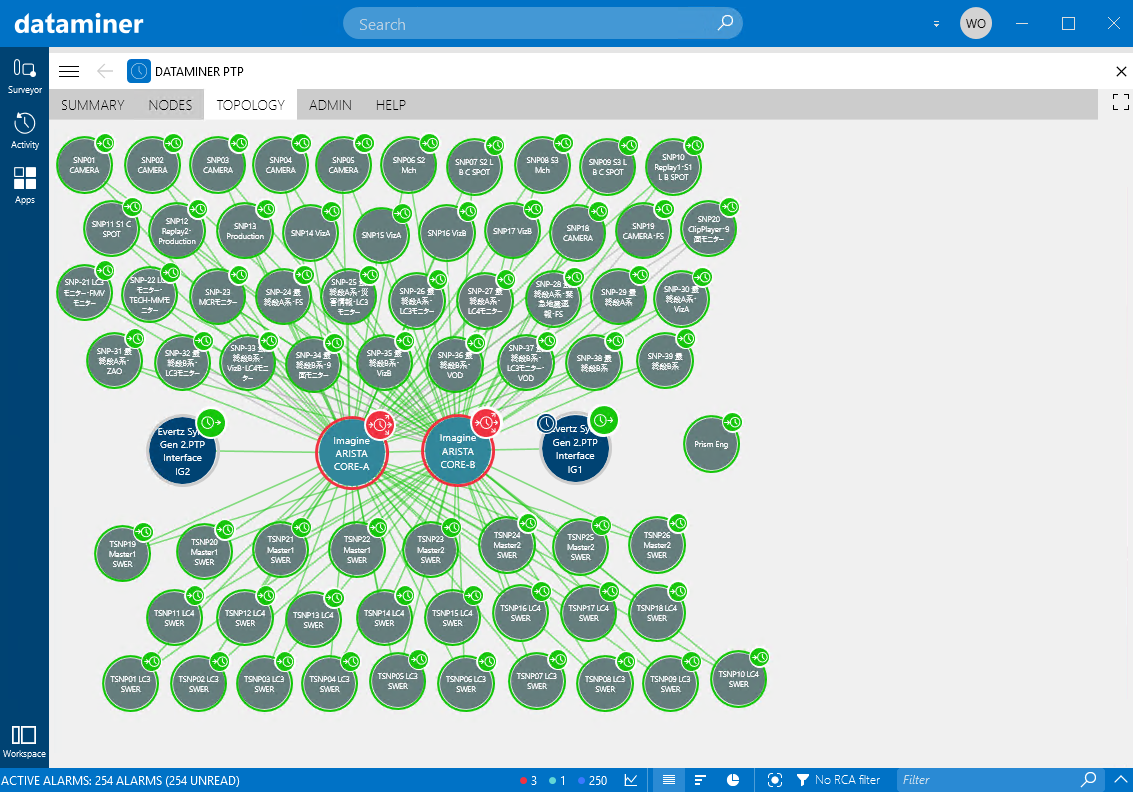 This tab shows a graphical overview of how the different PTP nodes are connected, using DataMiner DCF. For each node, an icon is displayed indicating the type of node. Note that for the grandmaster clocks, the current active grandmaster (as detected by the PTP probe) is indicated by a small clock icon on the left.
Clicking the name of a PTP node opens the element card of the node. Clicking the icon marking the type of node opens the PTP alarm tab, showing the list of active PTP alarms associated with the node. Clicking a connection line will open a pop-up window, showing more information about the connection.
To change the position of the nodes, right-click anywhere on the topology overview, click Arrange, and drag and drop the nodes to the position where you want them. To exit arrange mode, click Apply in the top-right corner.
Alarm states are indicated as follows:
The color of the border around the name of the PTP node indicates the overall alarm state of that node (taking into account all parameters of the node).
The color of the icon marking the type of node indicates the PTP alarm state of that node (taking into account only the PTP-related parameters of the node).
If a line connecting two nodes has an alarm color, this means that there is an alarm on the interface table (e.g. interface not connected).
This tab shows a graphical overview of how the different PTP nodes are connected, using DataMiner DCF. For each node, an icon is displayed indicating the type of node. Note that for the grandmaster clocks, the current active grandmaster (as detected by the PTP probe) is indicated by a small clock icon on the left.
Clicking the name of a PTP node opens the element card of the node. Clicking the icon marking the type of node opens the PTP alarm tab, showing the list of active PTP alarms associated with the node. Clicking a connection line will open a pop-up window, showing more information about the connection.
To change the position of the nodes, right-click anywhere on the topology overview, click Arrange, and drag and drop the nodes to the position where you want them. To exit arrange mode, click Apply in the top-right corner.
Alarm states are indicated as follows:
The color of the border around the name of the PTP node indicates the overall alarm state of that node (taking into account all parameters of the node).
The color of the icon marking the type of node indicates the PTP alarm state of that node (taking into account only the PTP-related parameters of the node).
If a line connecting two nodes has an alarm color, this means that there is an alarm on the interface table (e.g. interface not connected).
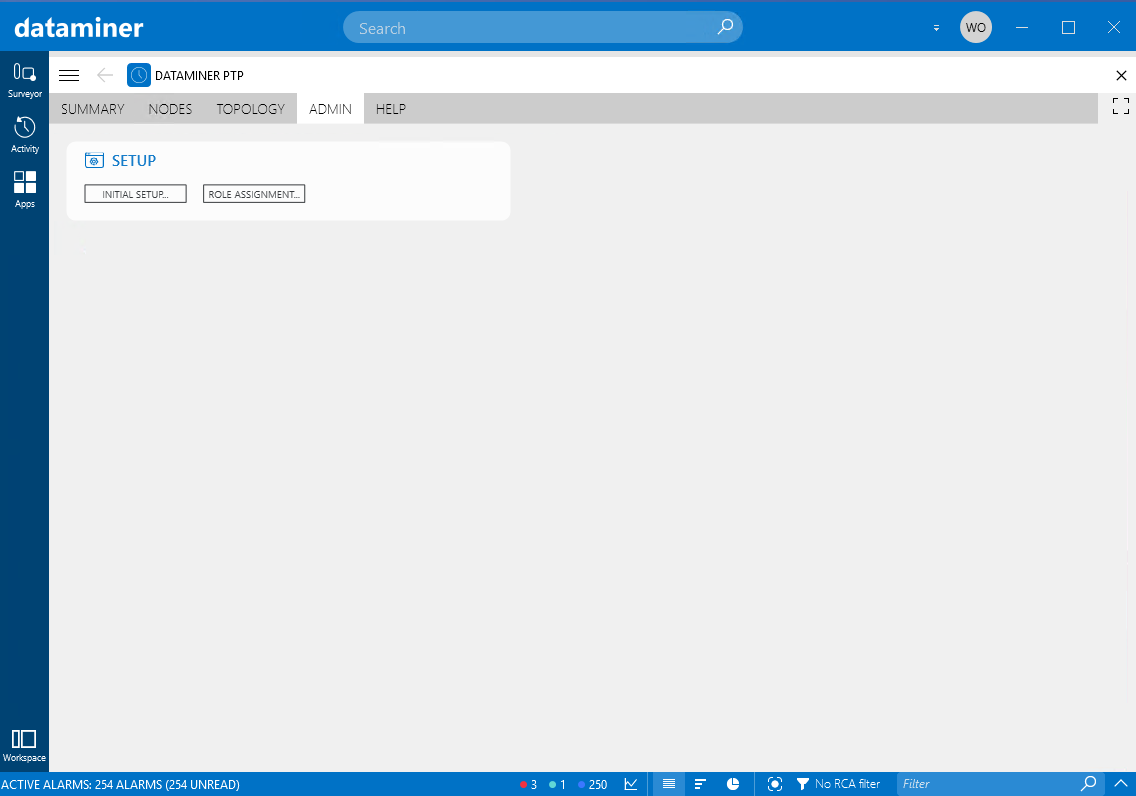 This tab contains two buttons:
Initial setup: Launches the setup wizard again, allowing you to reconfigure the entire PTP topology.
Role assignment: Launches the role assignment wizard, allowing you to change the roles that were assigned to the different PTP devices, or to assign roles to newly added devices.
This tab contains two buttons:
Initial setup: Launches the setup wizard again, allowing you to reconfigure the entire PTP topology.
Role assignment: Launches the role assignment wizard, allowing you to change the roles that were assigned to the different PTP devices, or to assign roles to newly added devices.