example Use Case
Cisco Dashboards
Cisco
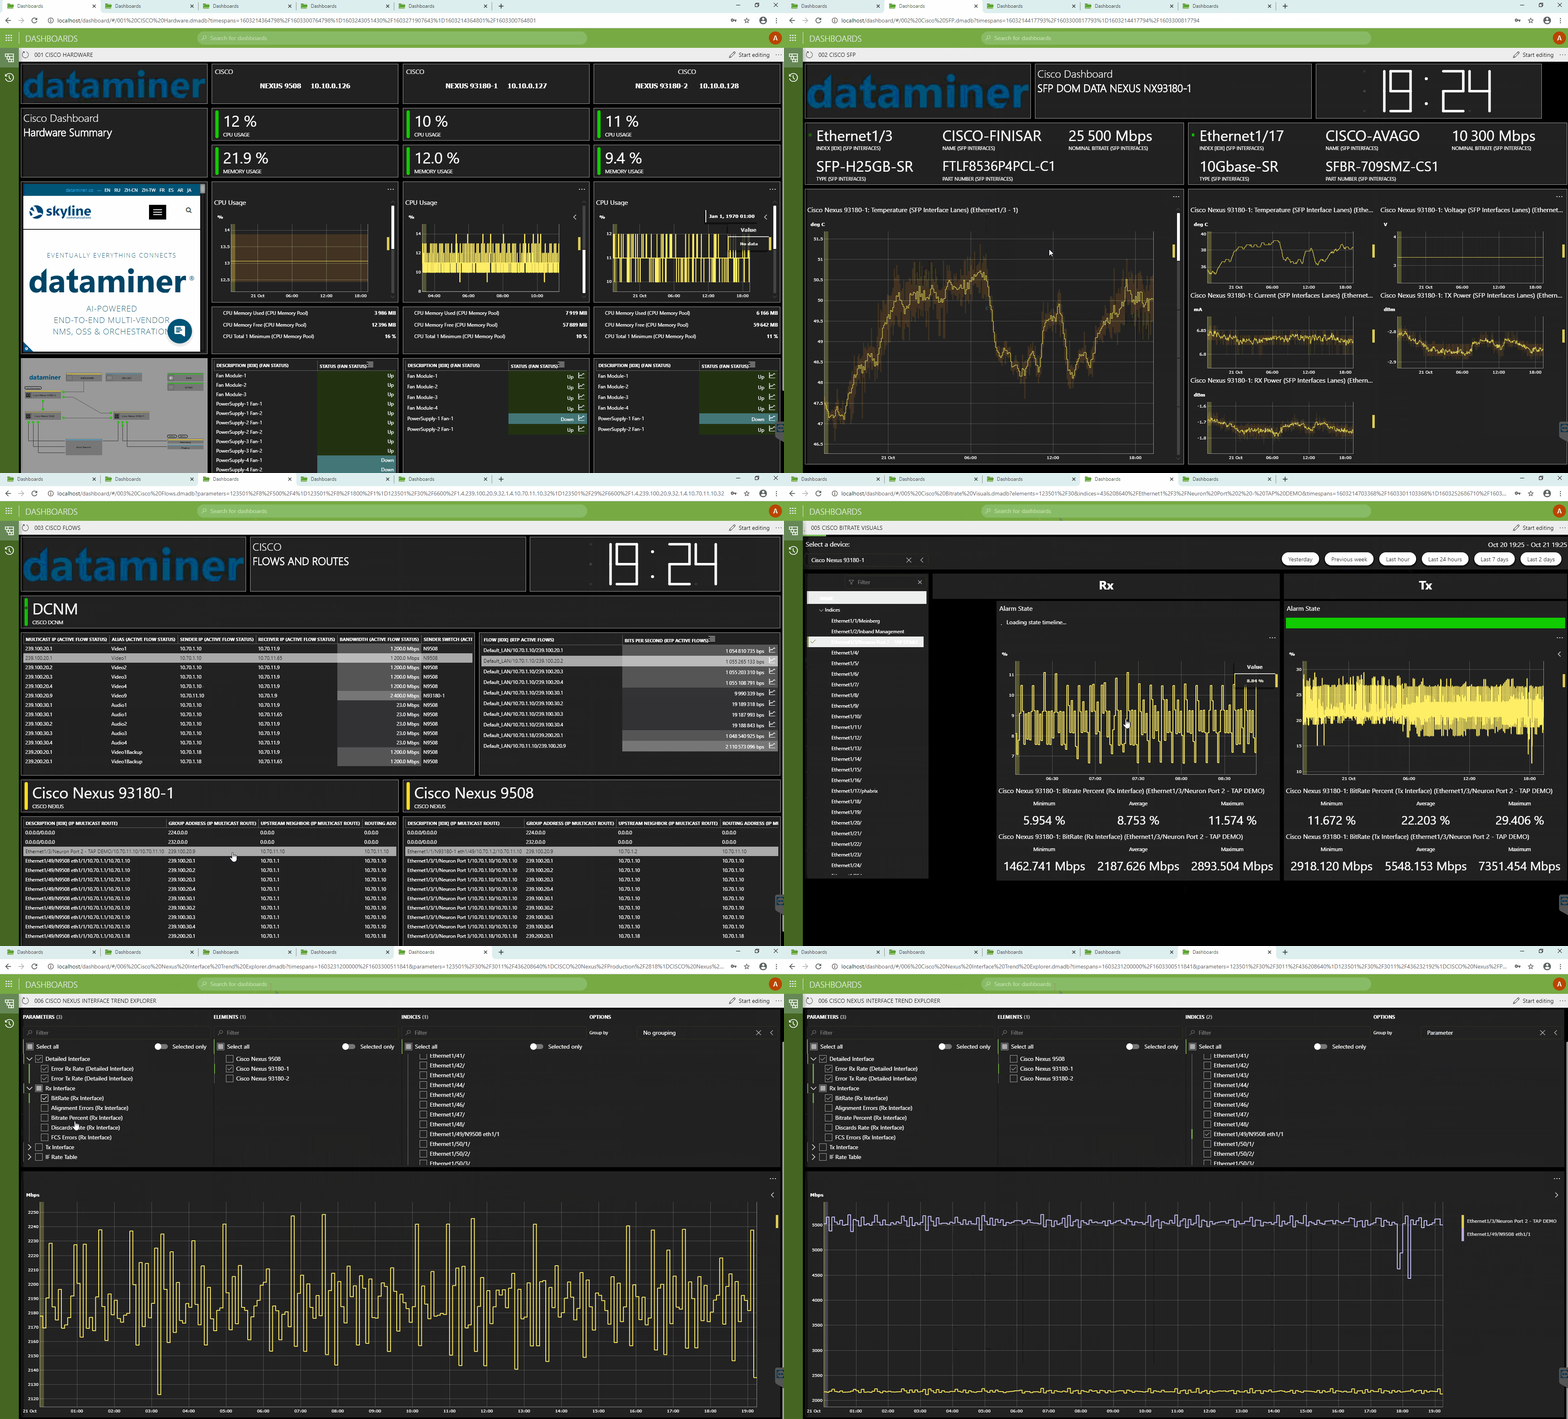
All of your important KPIs and metrics at your fingertips – in real time.
USE CASE DETAILS
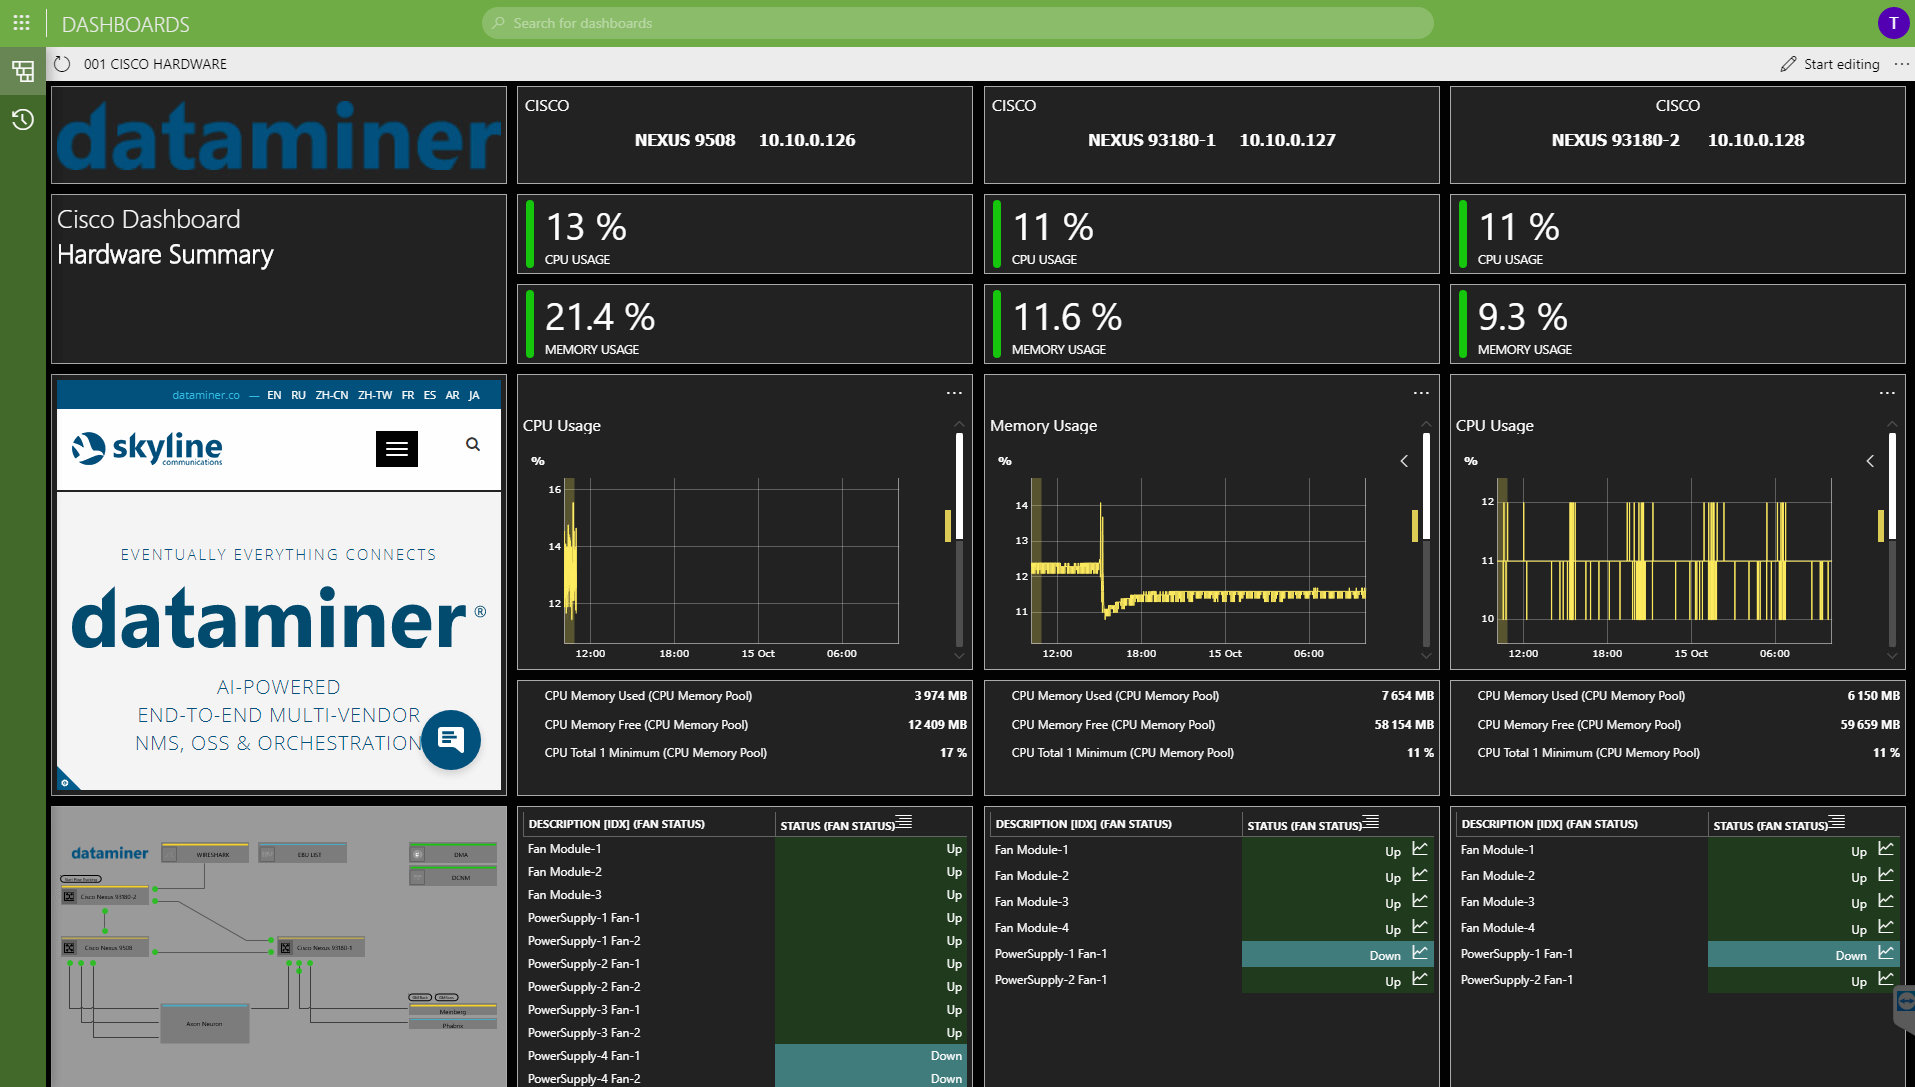
 Check your switch environmental parameters, e.g. CPU usage, memory usage, fan status, power supplies.
Add any external website to your dashboard and combine your dashboards with DataMiner Visual Overviews.
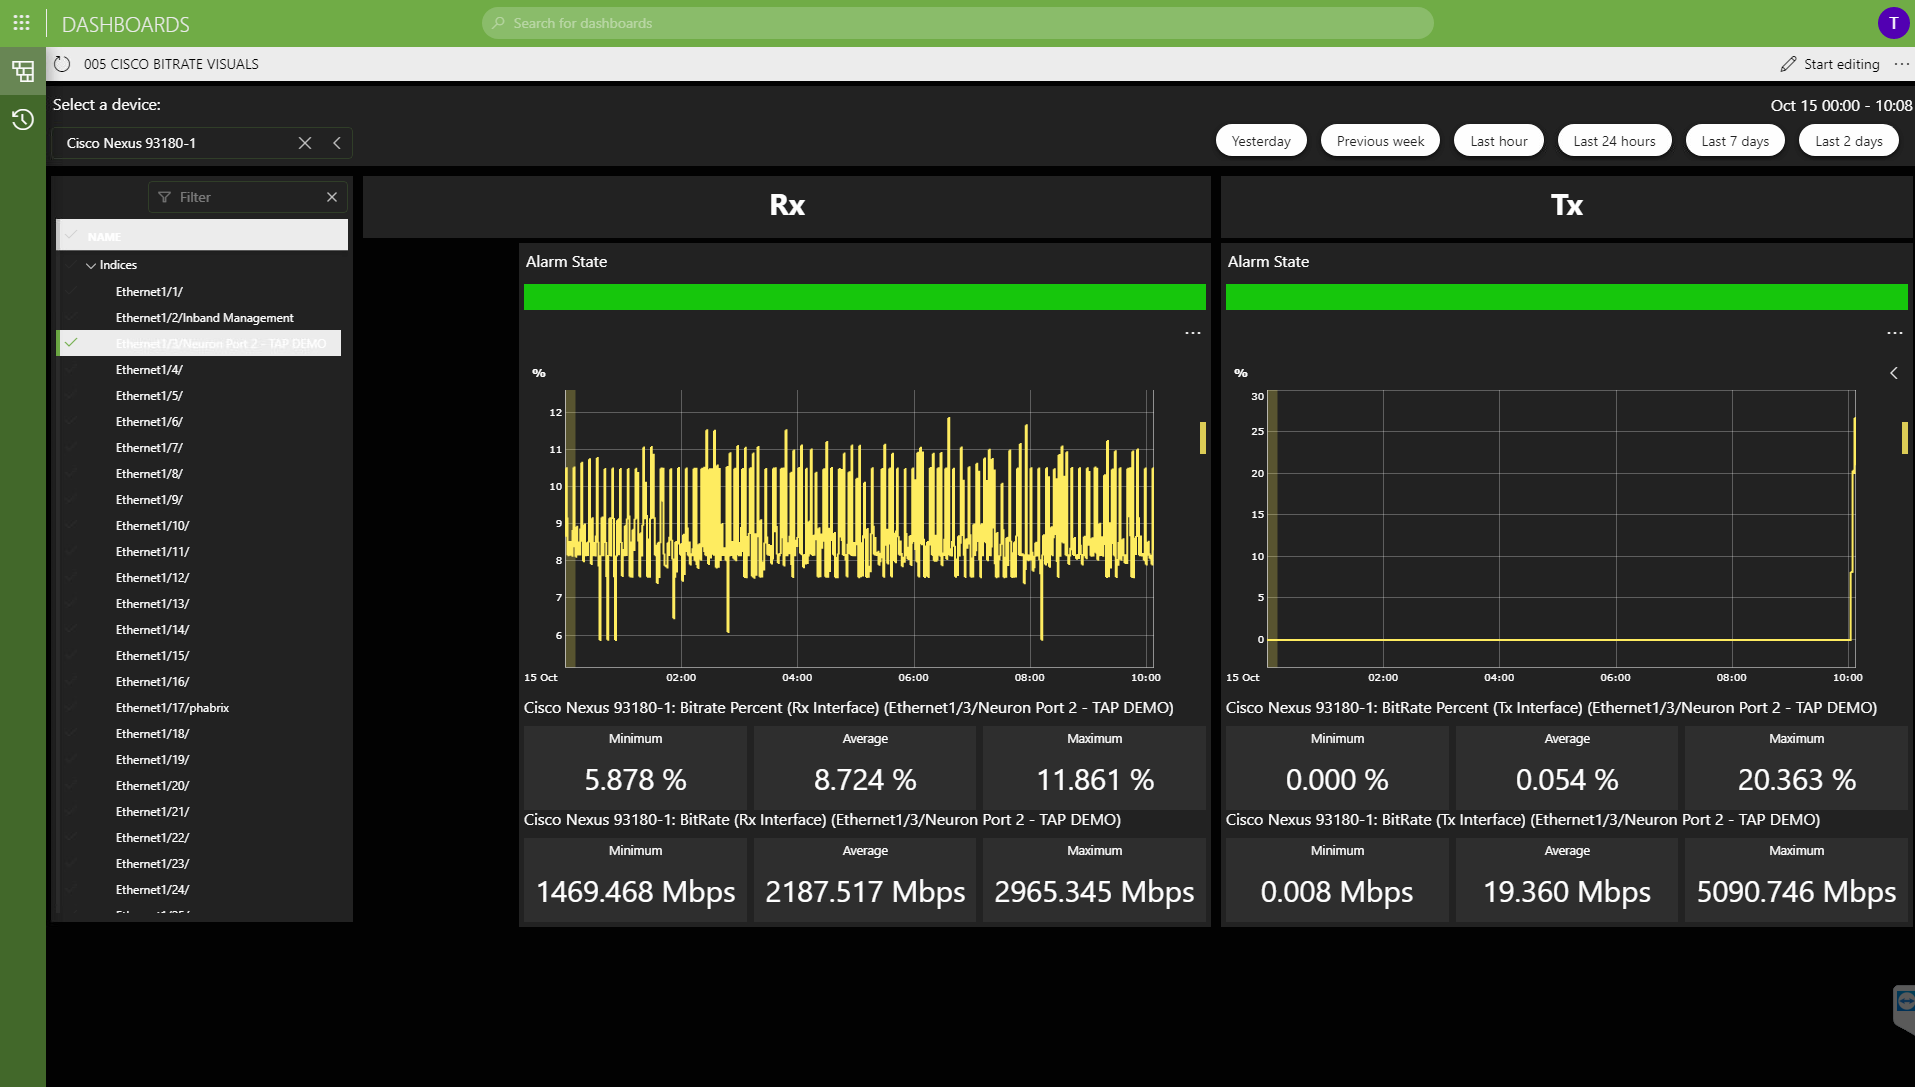 Select one of your switches or a time range and access your most important KPIs. See the parameter's alarm state of the last 24 hours, and the minimum, maximum, and average values.
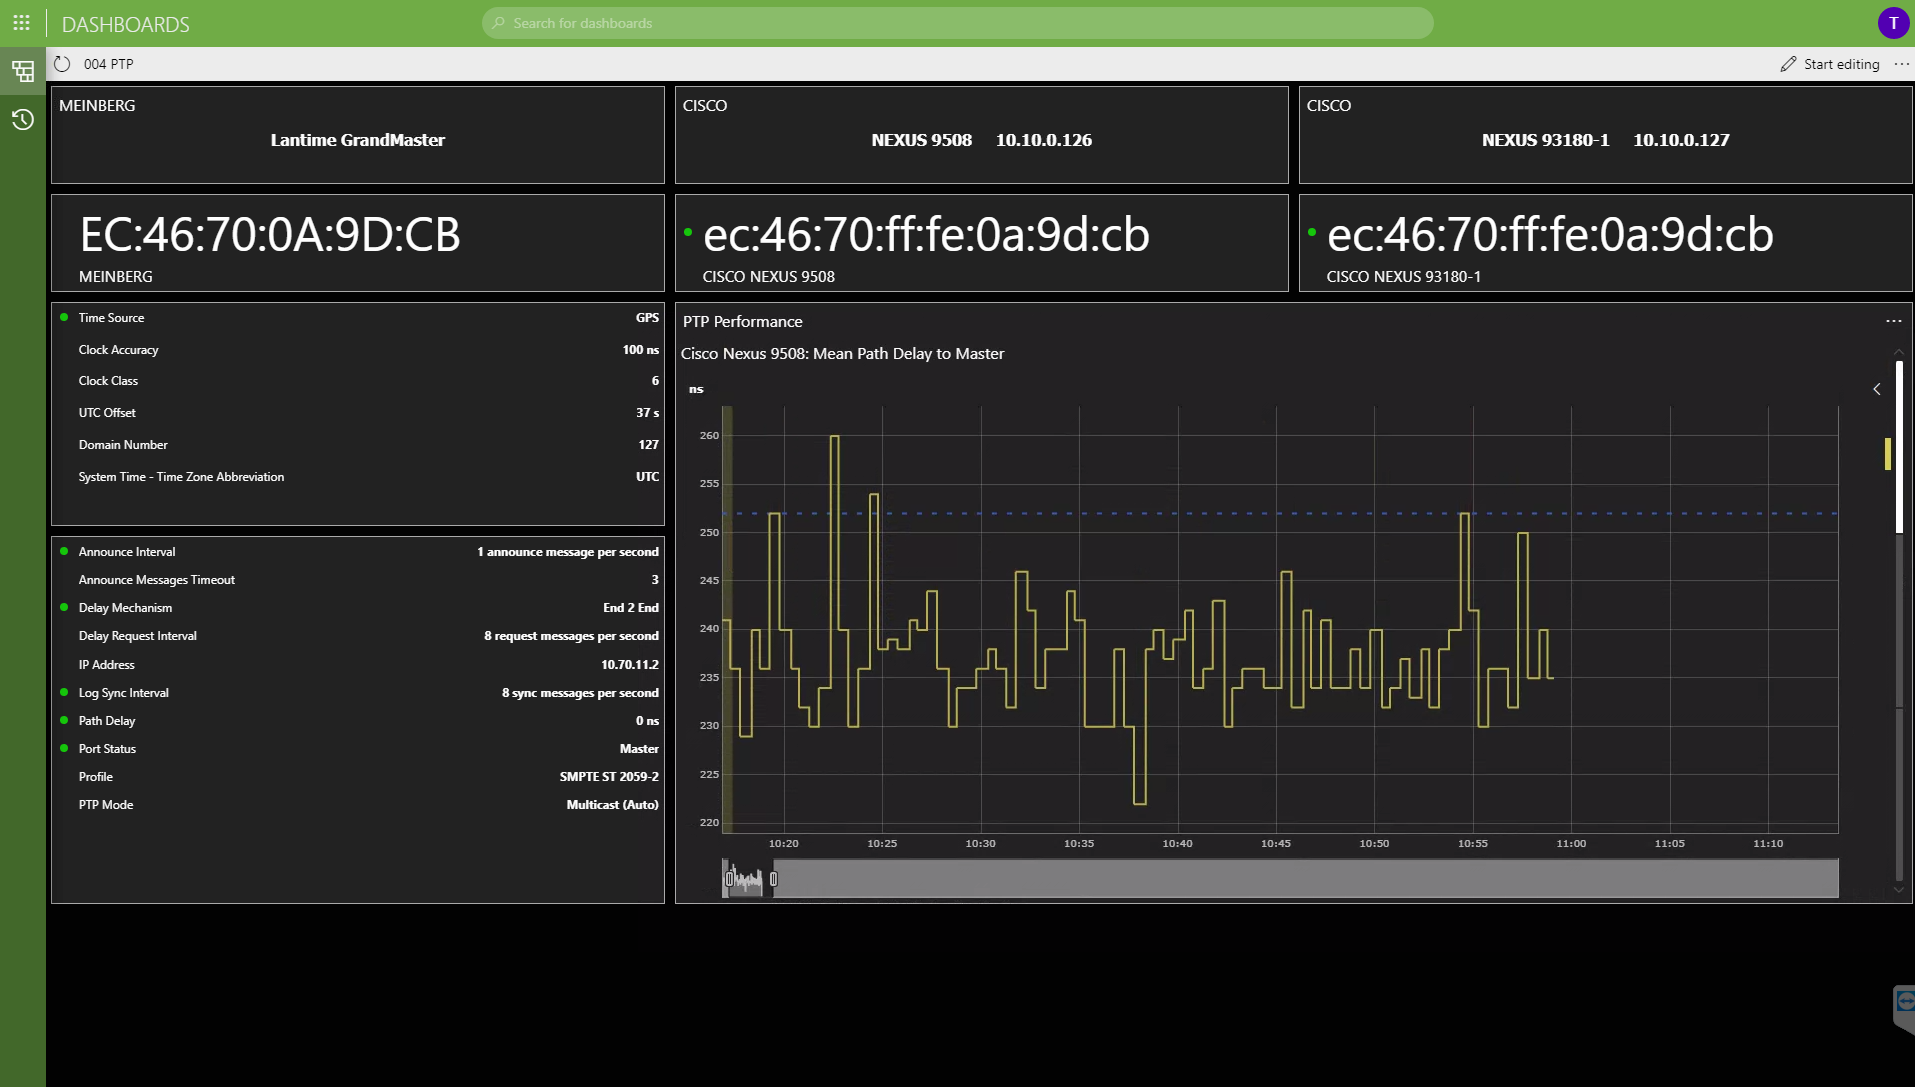 All of your PTP boundary clock metrics at a glance. Track your offset from master and meanpath delay performance. It is not limited to your switches, also include the status of your PTP GrandMaster.
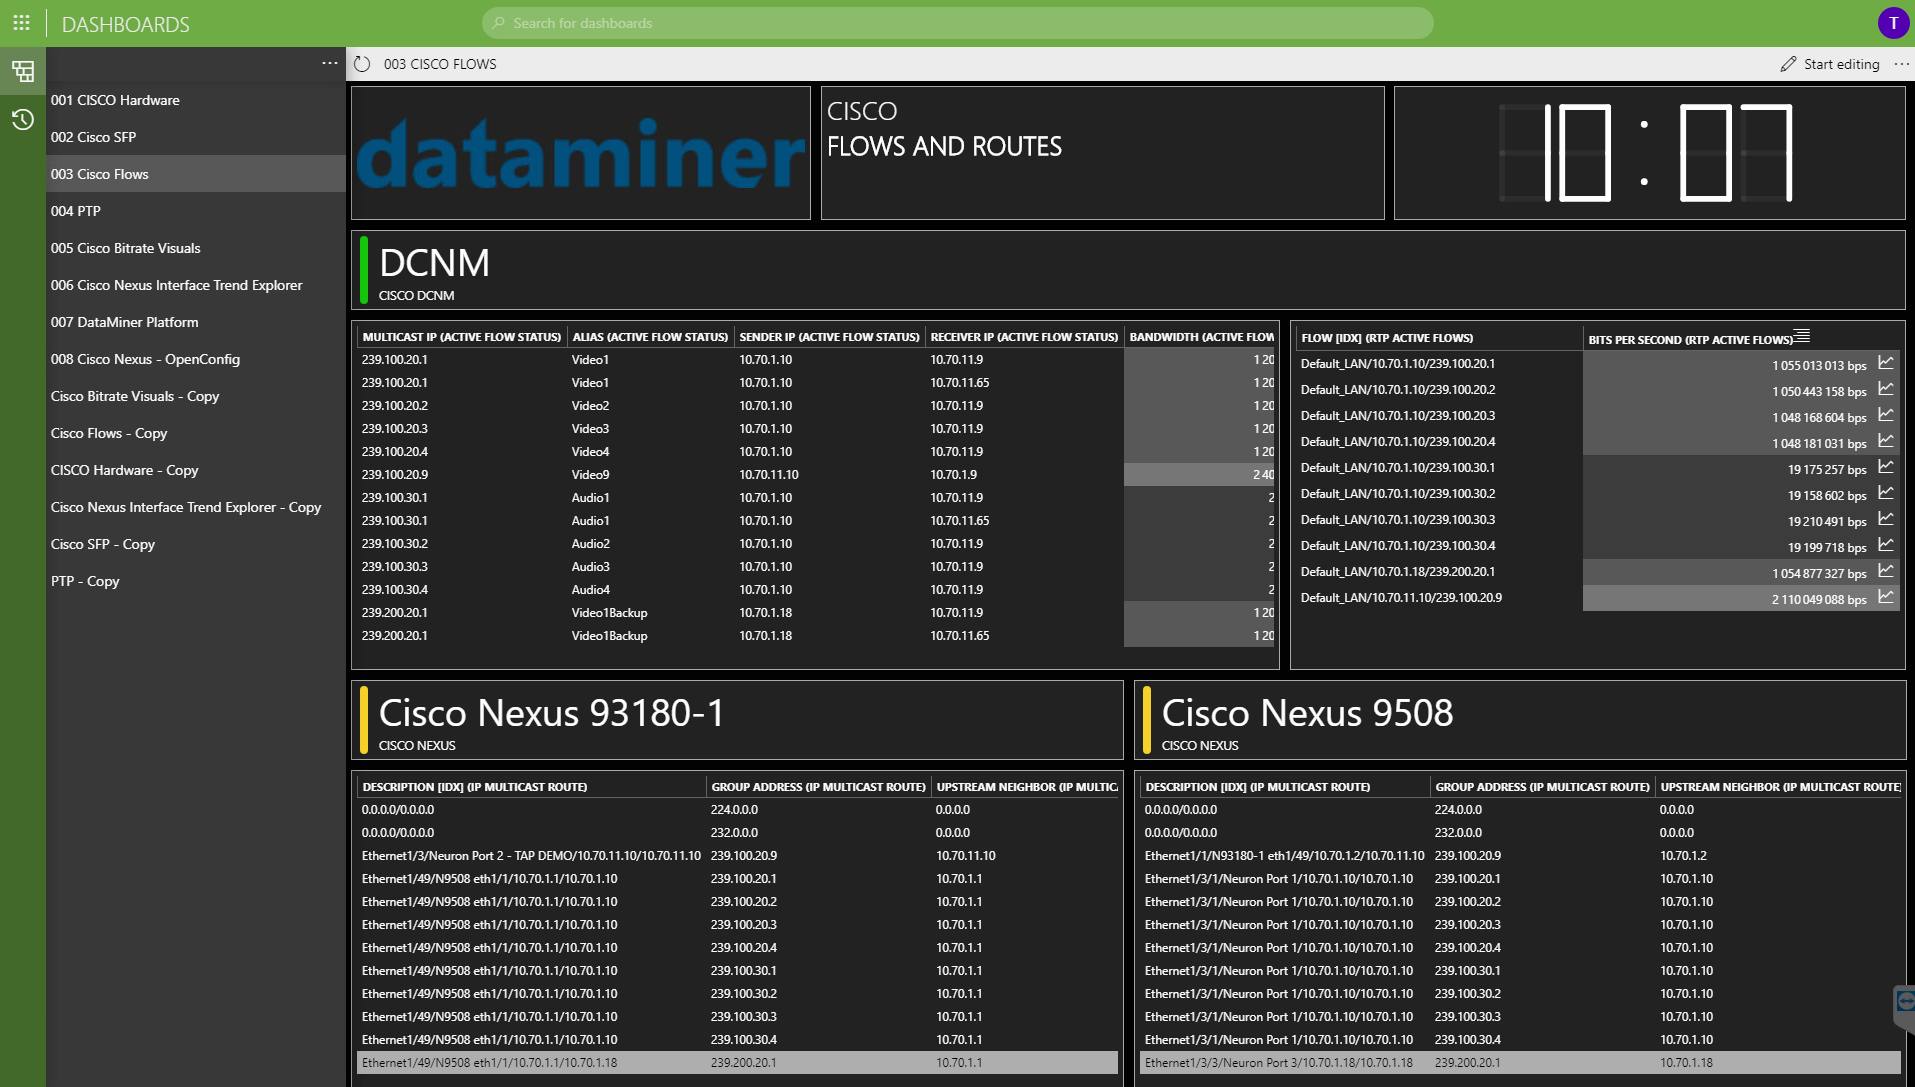 Combined dashboard aggregating information from Cisco DCNM and multicast tables retrieved directly from the switches.
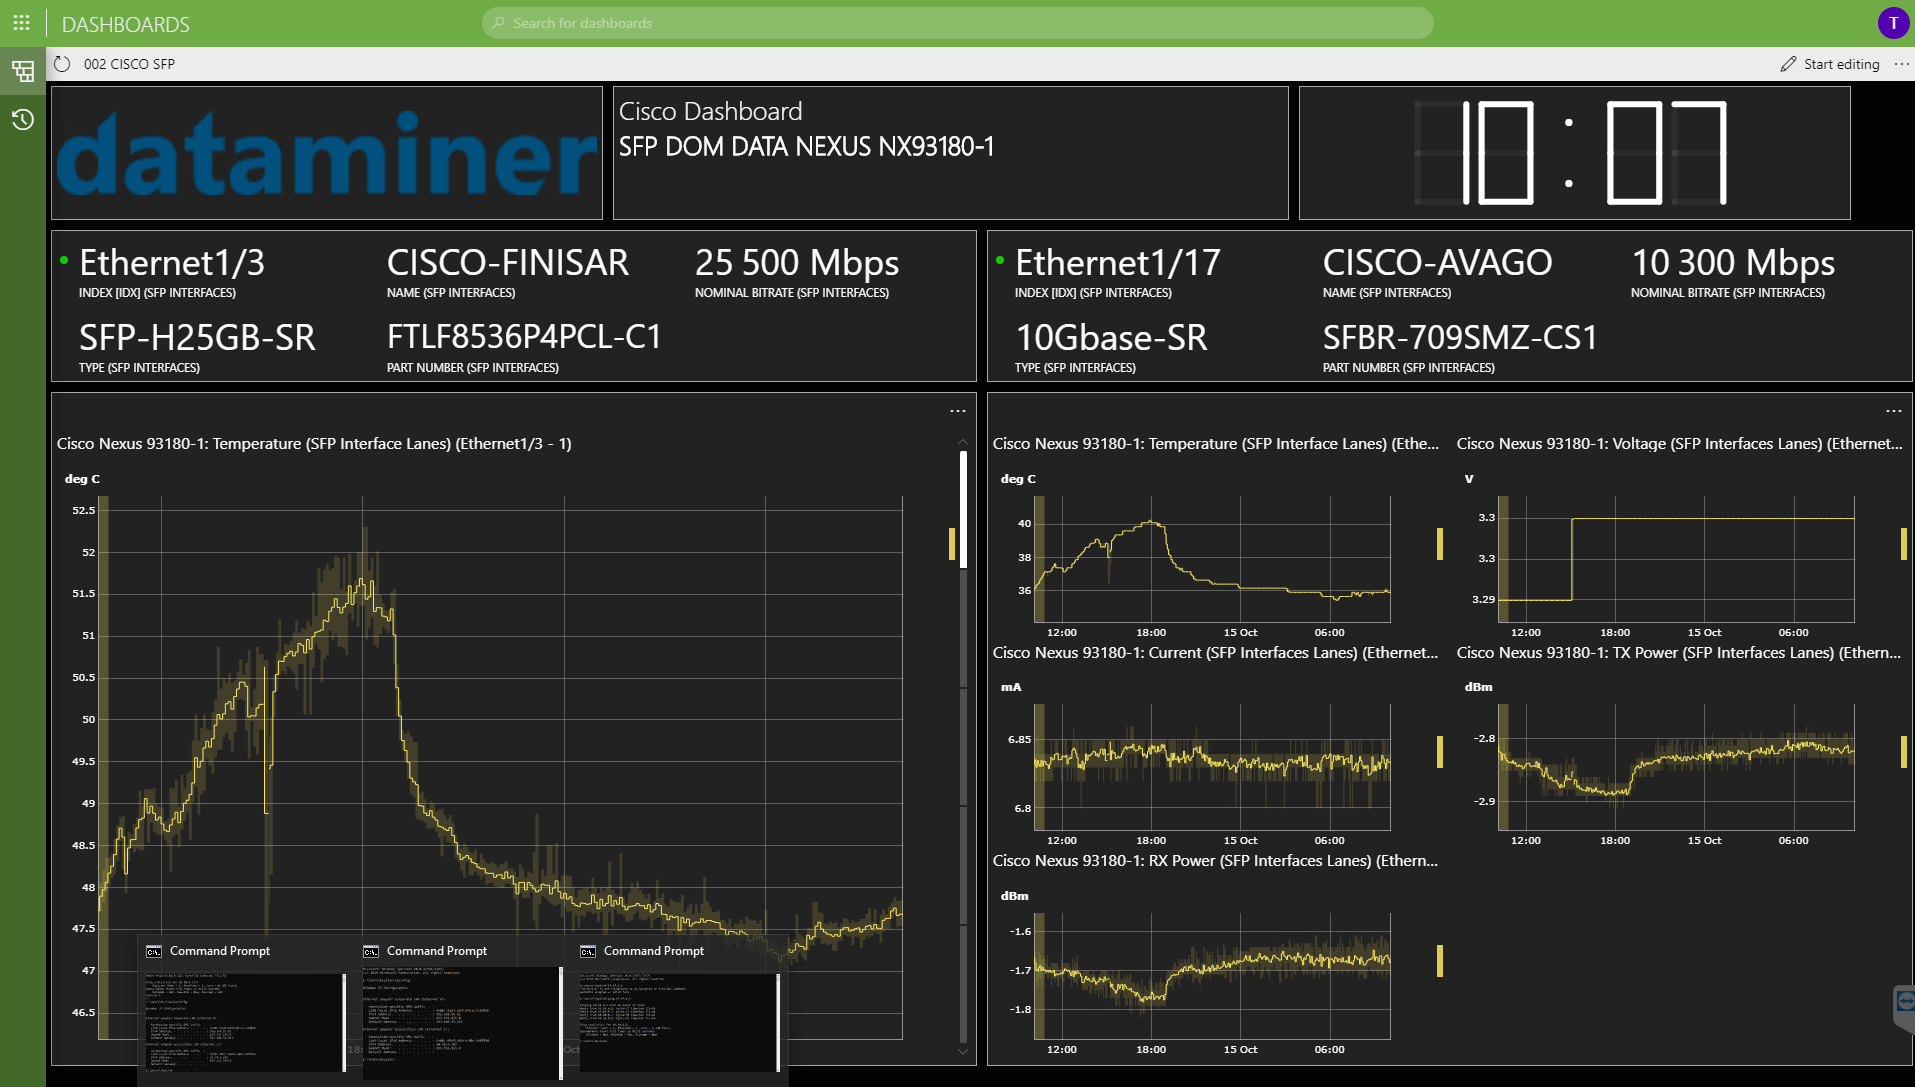 DOM (digital optical monitoring) made easy.
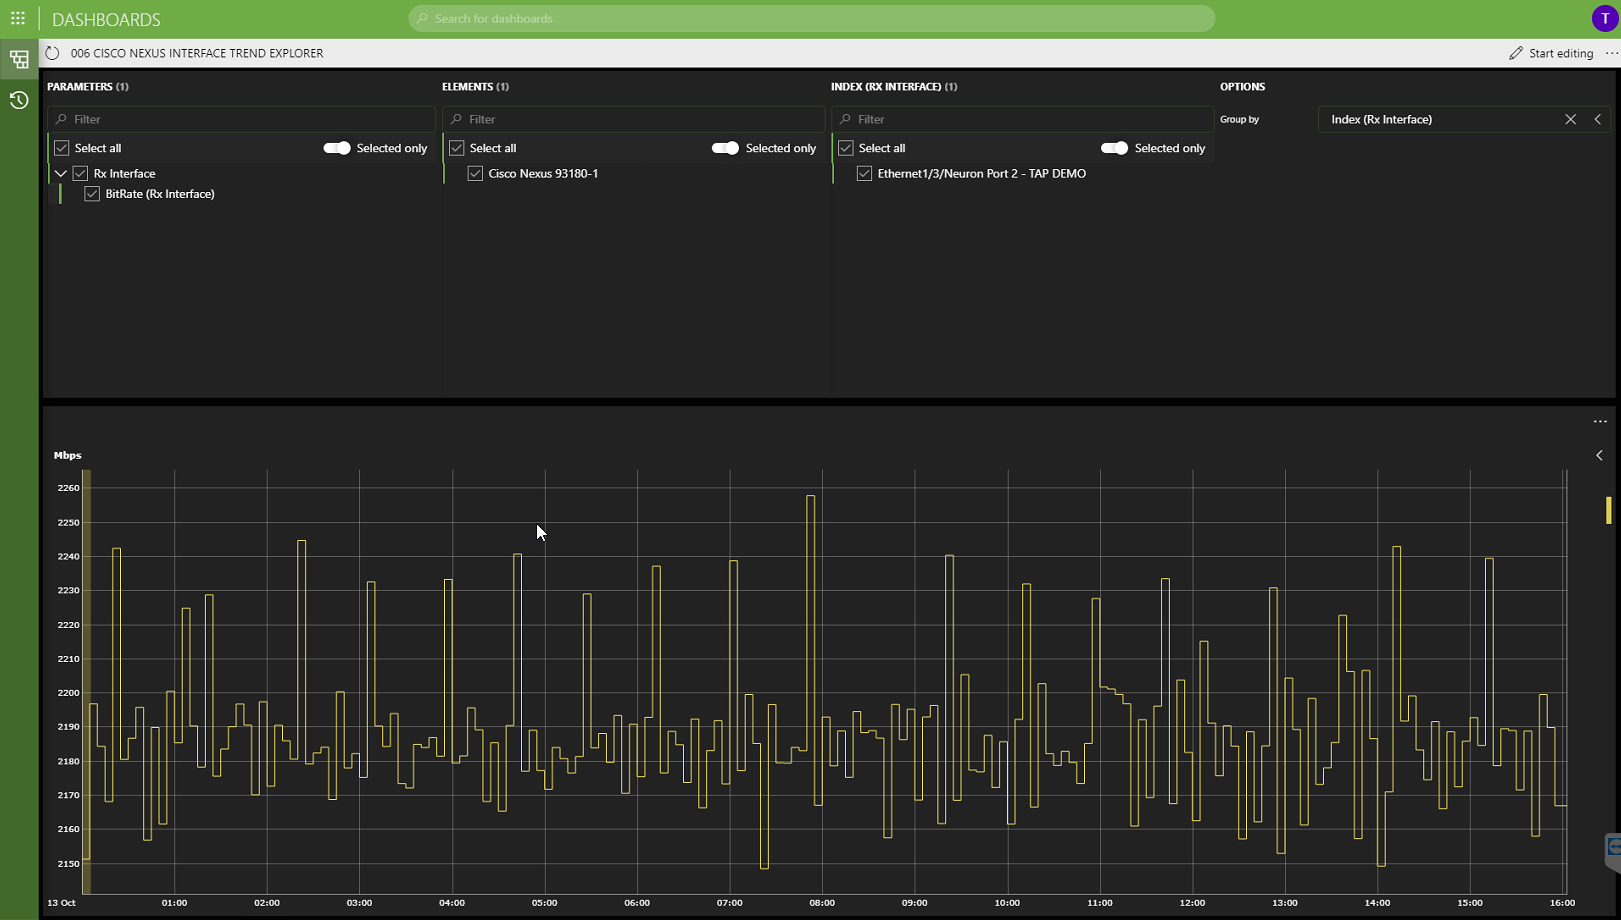 Select one or multiple KPIs from one or multiple switches and multiple interfaces, all in one dashboard.