example Use Case
AI-assisted SFP performance monitoring
A SFP (small form-factor pluggable) is a compact, hot-pluggable network interface module. An SFP interface on networking hardware is a modular slot for a media-specific transceiver in order to connect a fiber-optic cable or sometimes a copper cable. With that individual ports can be equipped with any suitable type of transceiver which gives a lot of flexibility.
Monitoring your SFPs and their performance, especially when those are fiber ones, is essential. SFPs belong to OSI layer1. Performance issues on the latter will have a direct impact on all other OSI layers. You might see something going wrong on your higher level application layer, the root cause however might be related to a problem with your SFP, identifying those requires knowledge of all layers.
There is a plethora of SFP types and vendors available. DataMiner’s connector’s for switches from different vendors (e.g. Cisco, Arista, Huawei, Mellanox, Juniper, etc..) have built-in monitoring capabilities for your SFPs.
This use case describes how you can use the most common metrics provided by the DOM (Digital Optical Monitoring) standard to monitor transceivers in an efficient manner. You will also see how a combination of DataMiner’s AI capabilities and its alarm templates using thresholds help detecting upcoming issues with your optical SFPs proactively.
USE CASE DETAILS
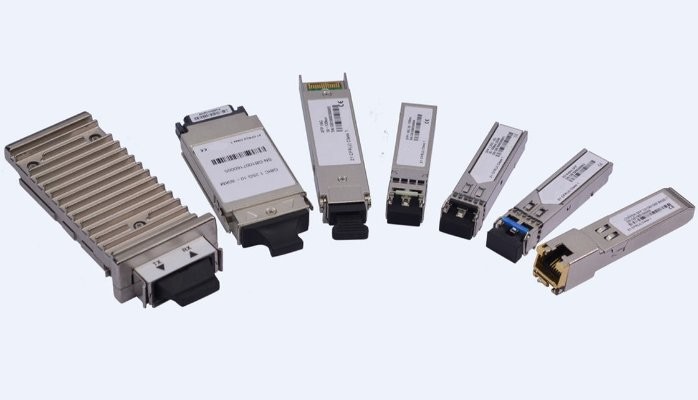 Optical transceivers come with different form factors and models. They are not only used in Ethernet systems but also in FTTH (GPON, GEPON, Point to Point), mobile base stations and fiber channel environments.
SFP is often used as a common term for all optical transceivers, depending on the type of connections, data transmission speed as well as packing forms, those transceivers have different names: SFP, SFP+, QSFP, XFP, X2, Xenpak GBIC etc..
There are multimode, single mode as well as WDM (CWDM, DWDM) modules available.
Optical transceivers come with different form factors and models. They are not only used in Ethernet systems but also in FTTH (GPON, GEPON, Point to Point), mobile base stations and fiber channel environments.
SFP is often used as a common term for all optical transceivers, depending on the type of connections, data transmission speed as well as packing forms, those transceivers have different names: SFP, SFP+, QSFP, XFP, X2, Xenpak GBIC etc..
There are multimode, single mode as well as WDM (CWDM, DWDM) modules available.
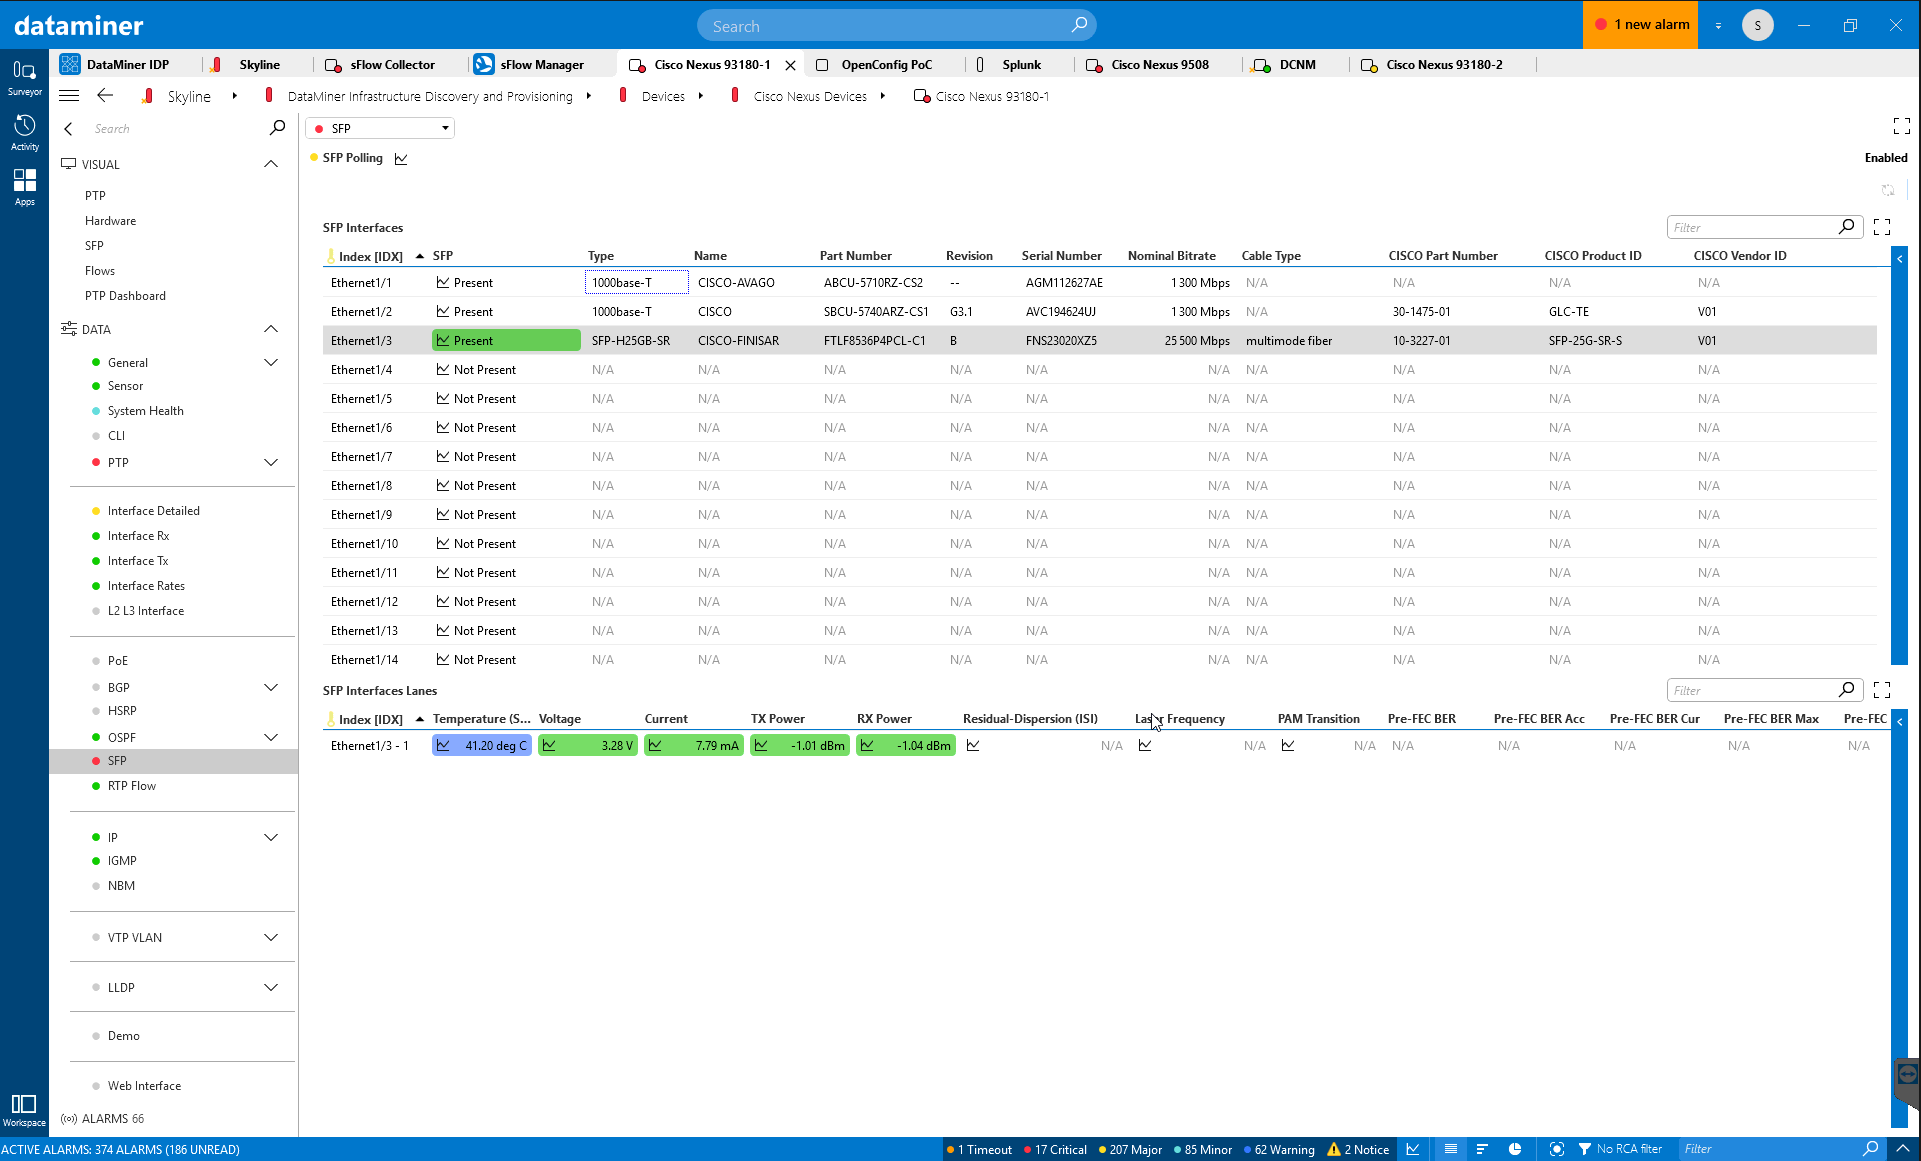 This screenshot is an example of a DataMiner Cisco Nexus connector. The Nexus switch has three SFPs plugged in, two of them are copper ones, one is a fiber SFP.
All SFPs expose basic parameters like Type, Name, Serial Number and Nominal Bitrate. Whenever a SFP will be removed from the switch, an alarm will be raised immediately.
The Fiber SFP supports the Digital Optical Monitoring (DOM) standard and its metrics: as a minimum Temperature, Voltage, Current and TX & RX Power must be supported by the SFP vendor. Additional metrics such as bit error rate, dispersion, signal-to-noise ratio can also be monitored by DataMiner whenever supported by the SFP vendor.
DataMiner monitors those metrics over time and analyzes its behavior with its built-in AI capabilities in real-time.
This screenshot is an example of a DataMiner Cisco Nexus connector. The Nexus switch has three SFPs plugged in, two of them are copper ones, one is a fiber SFP.
All SFPs expose basic parameters like Type, Name, Serial Number and Nominal Bitrate. Whenever a SFP will be removed from the switch, an alarm will be raised immediately.
The Fiber SFP supports the Digital Optical Monitoring (DOM) standard and its metrics: as a minimum Temperature, Voltage, Current and TX & RX Power must be supported by the SFP vendor. Additional metrics such as bit error rate, dispersion, signal-to-noise ratio can also be monitored by DataMiner whenever supported by the SFP vendor.
DataMiner monitors those metrics over time and analyzes its behavior with its built-in AI capabilities in real-time.
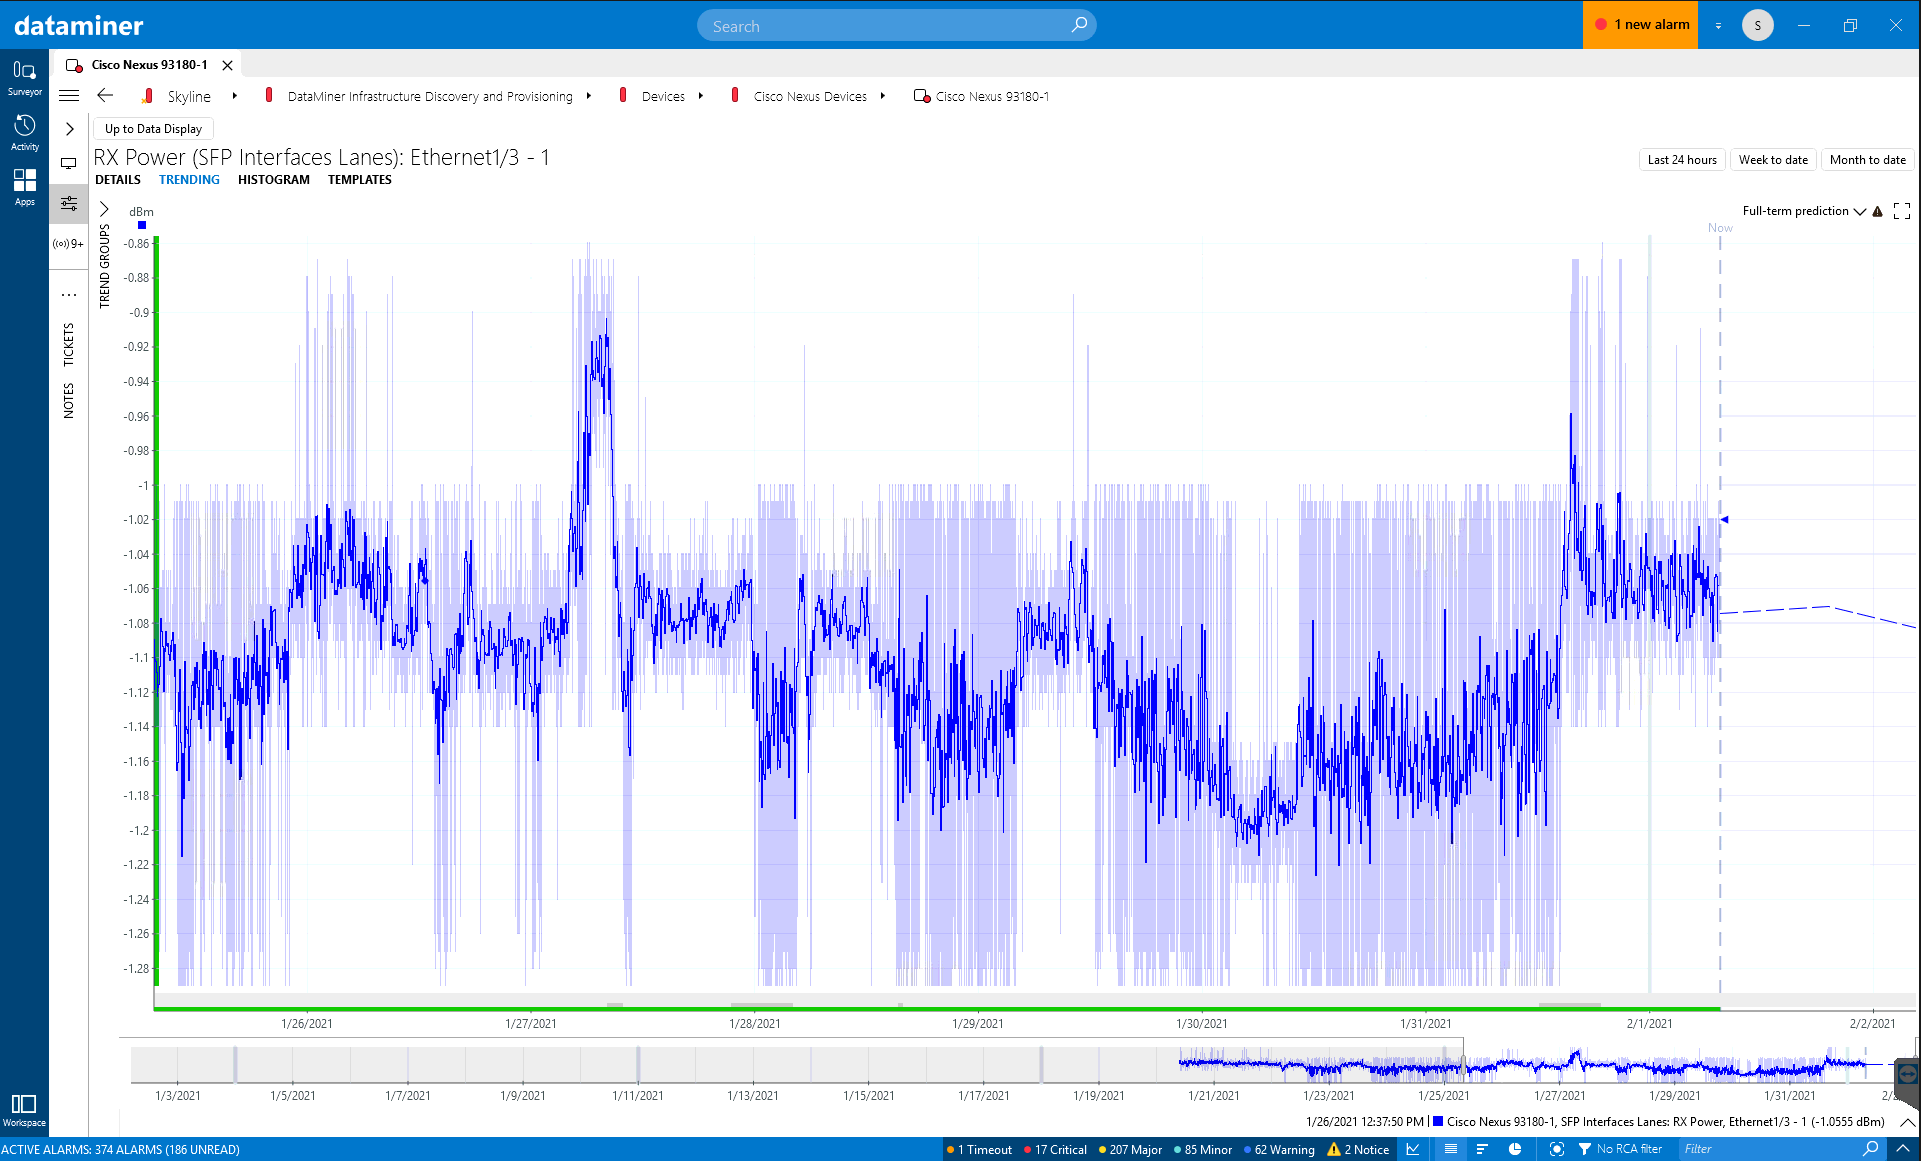 Trend graph "RX Power"
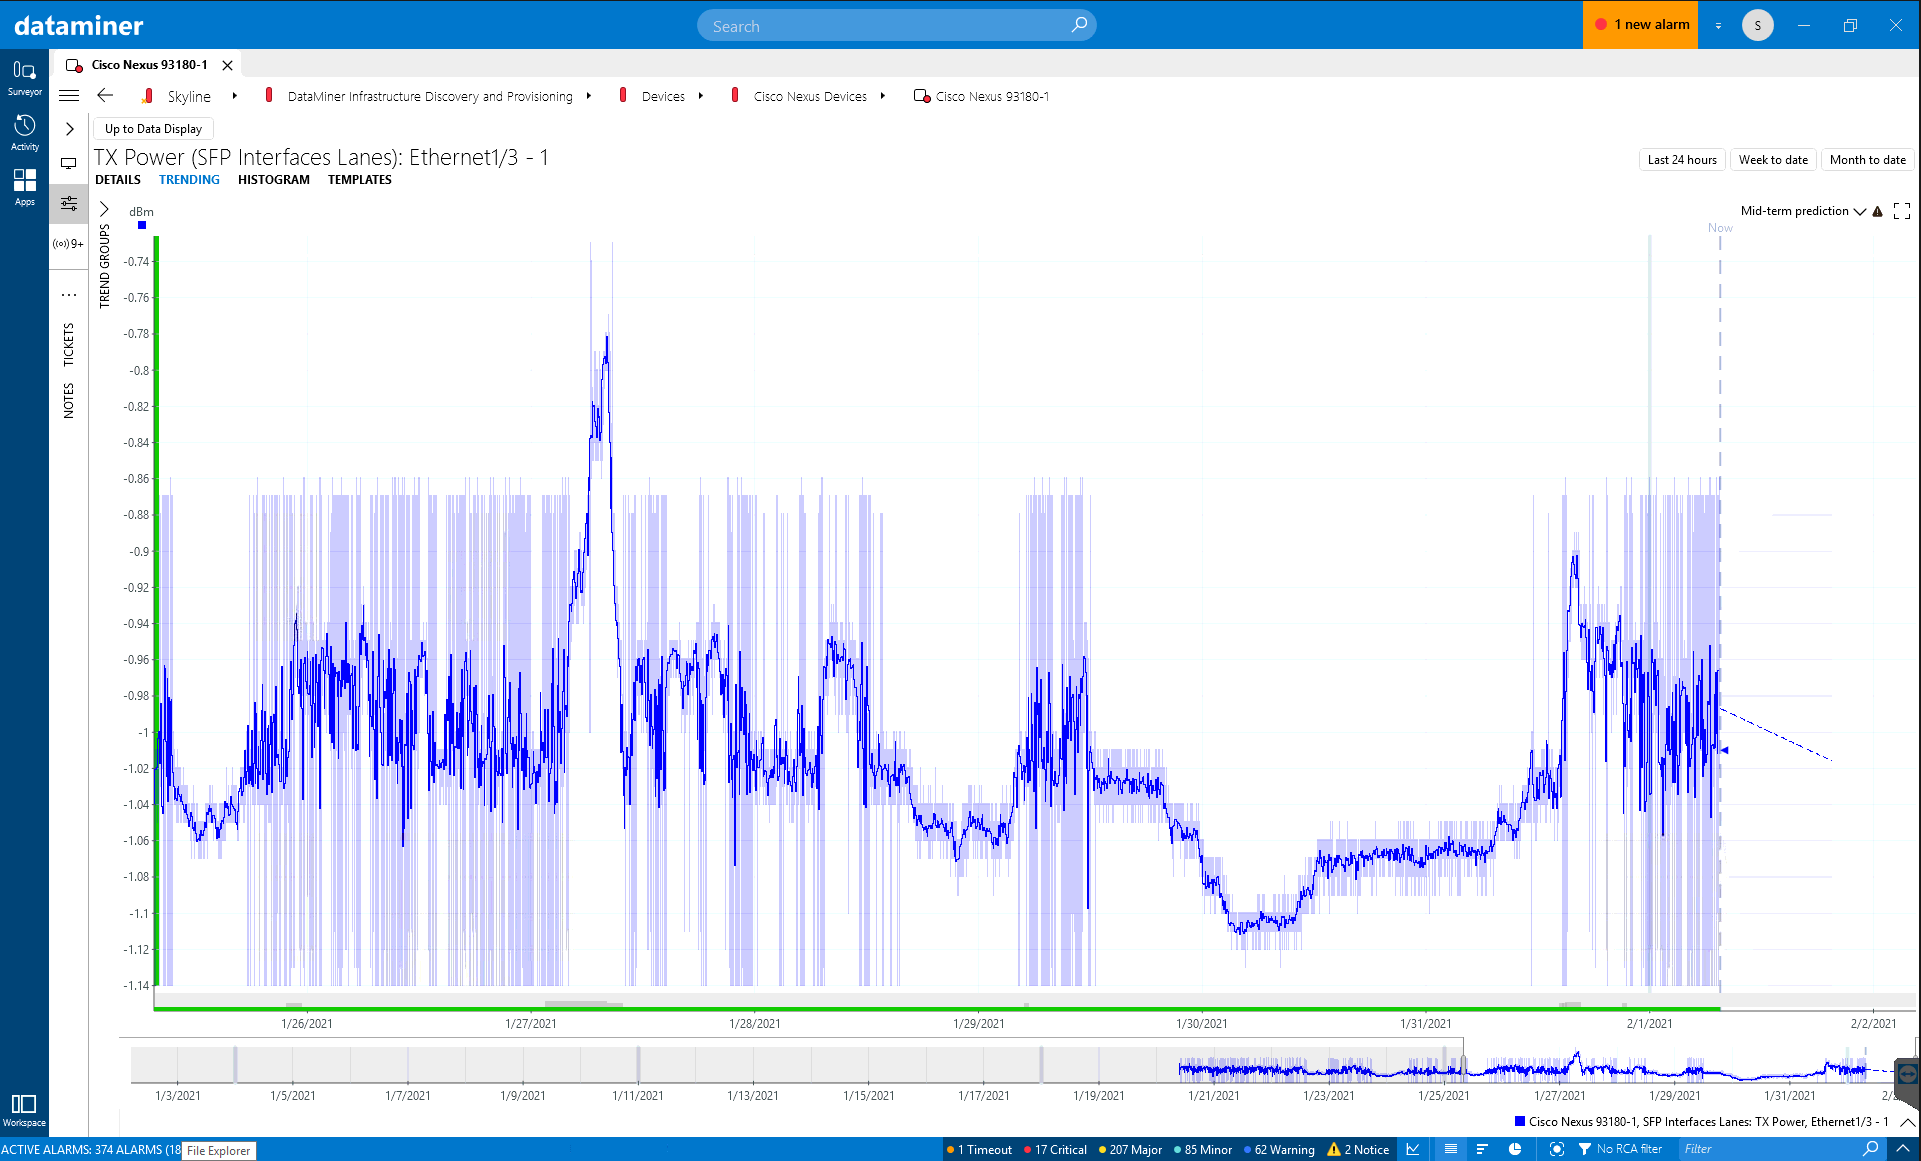 Trend graph "TX Power"
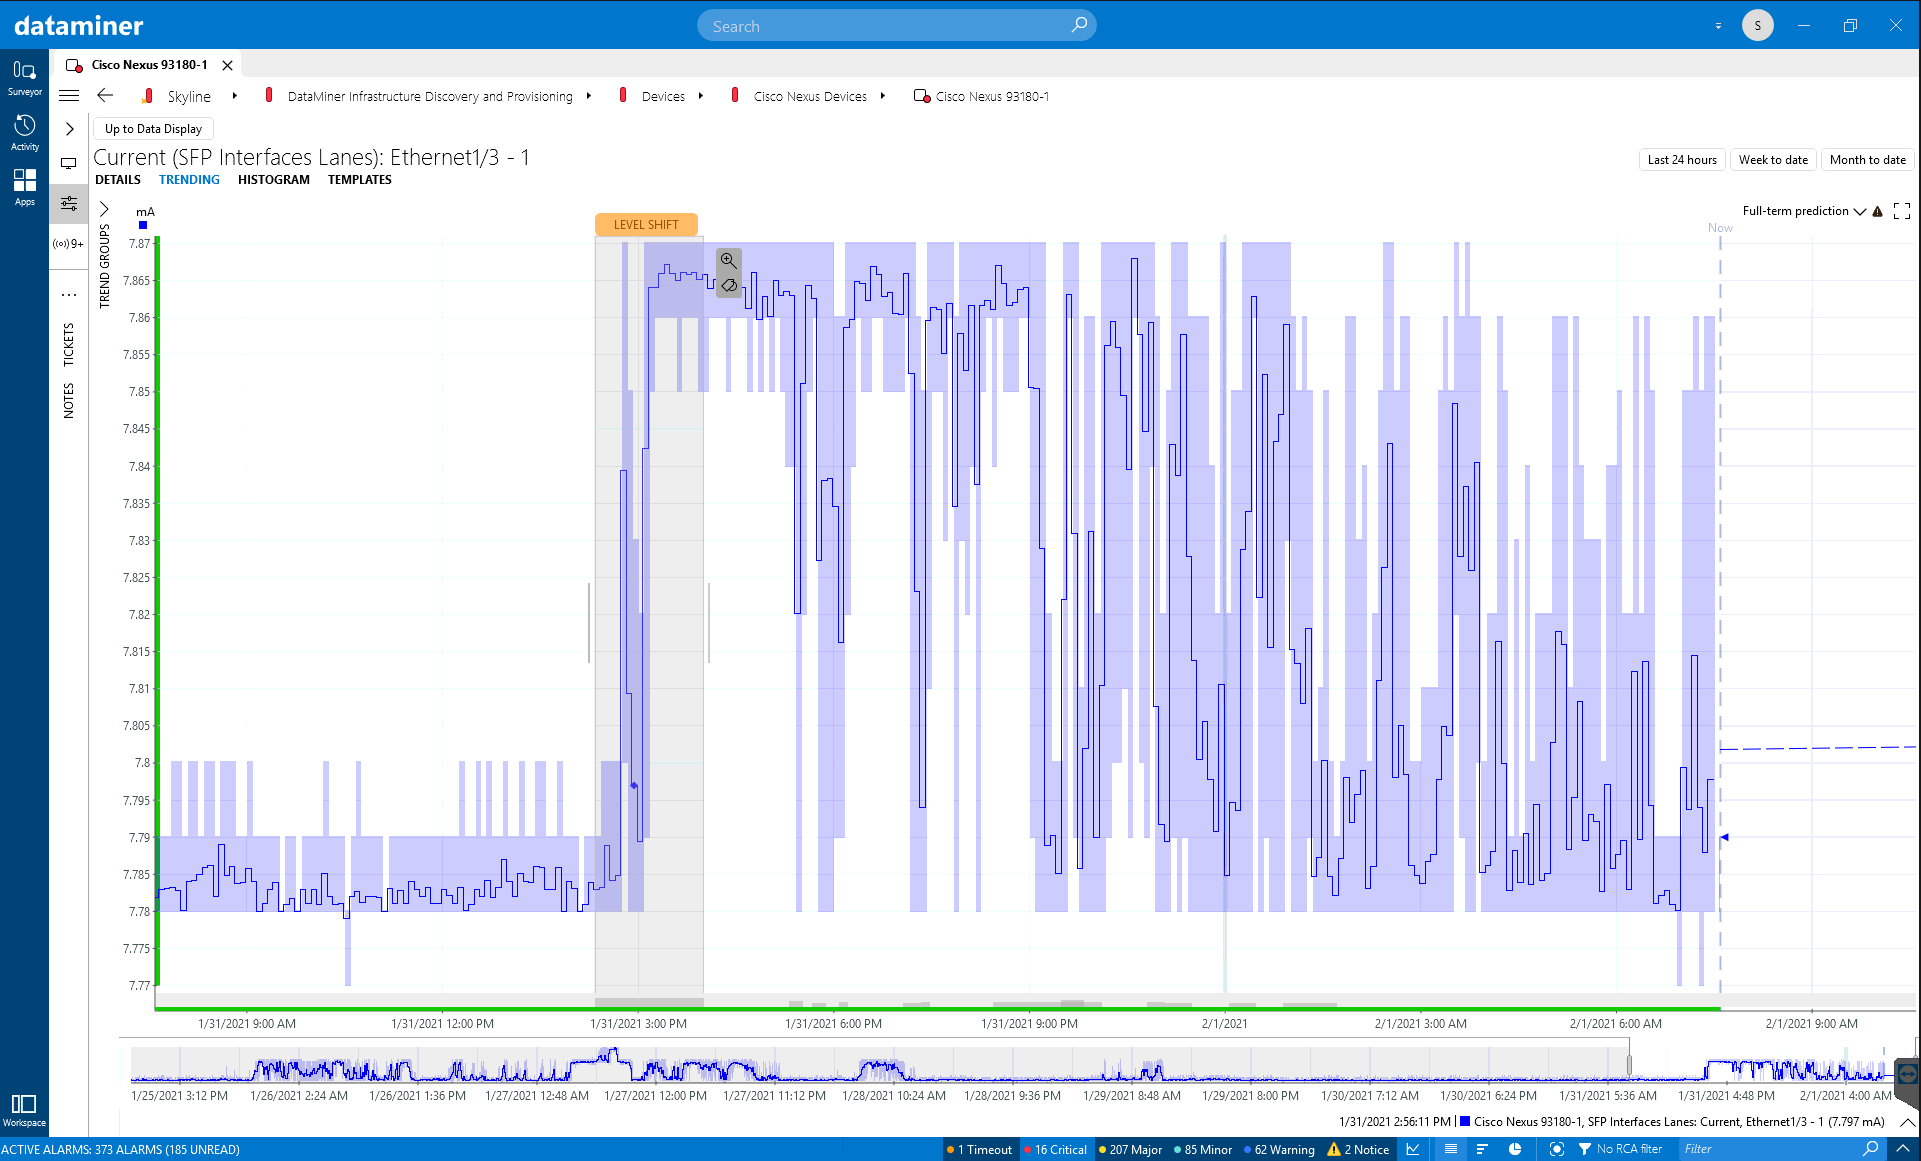
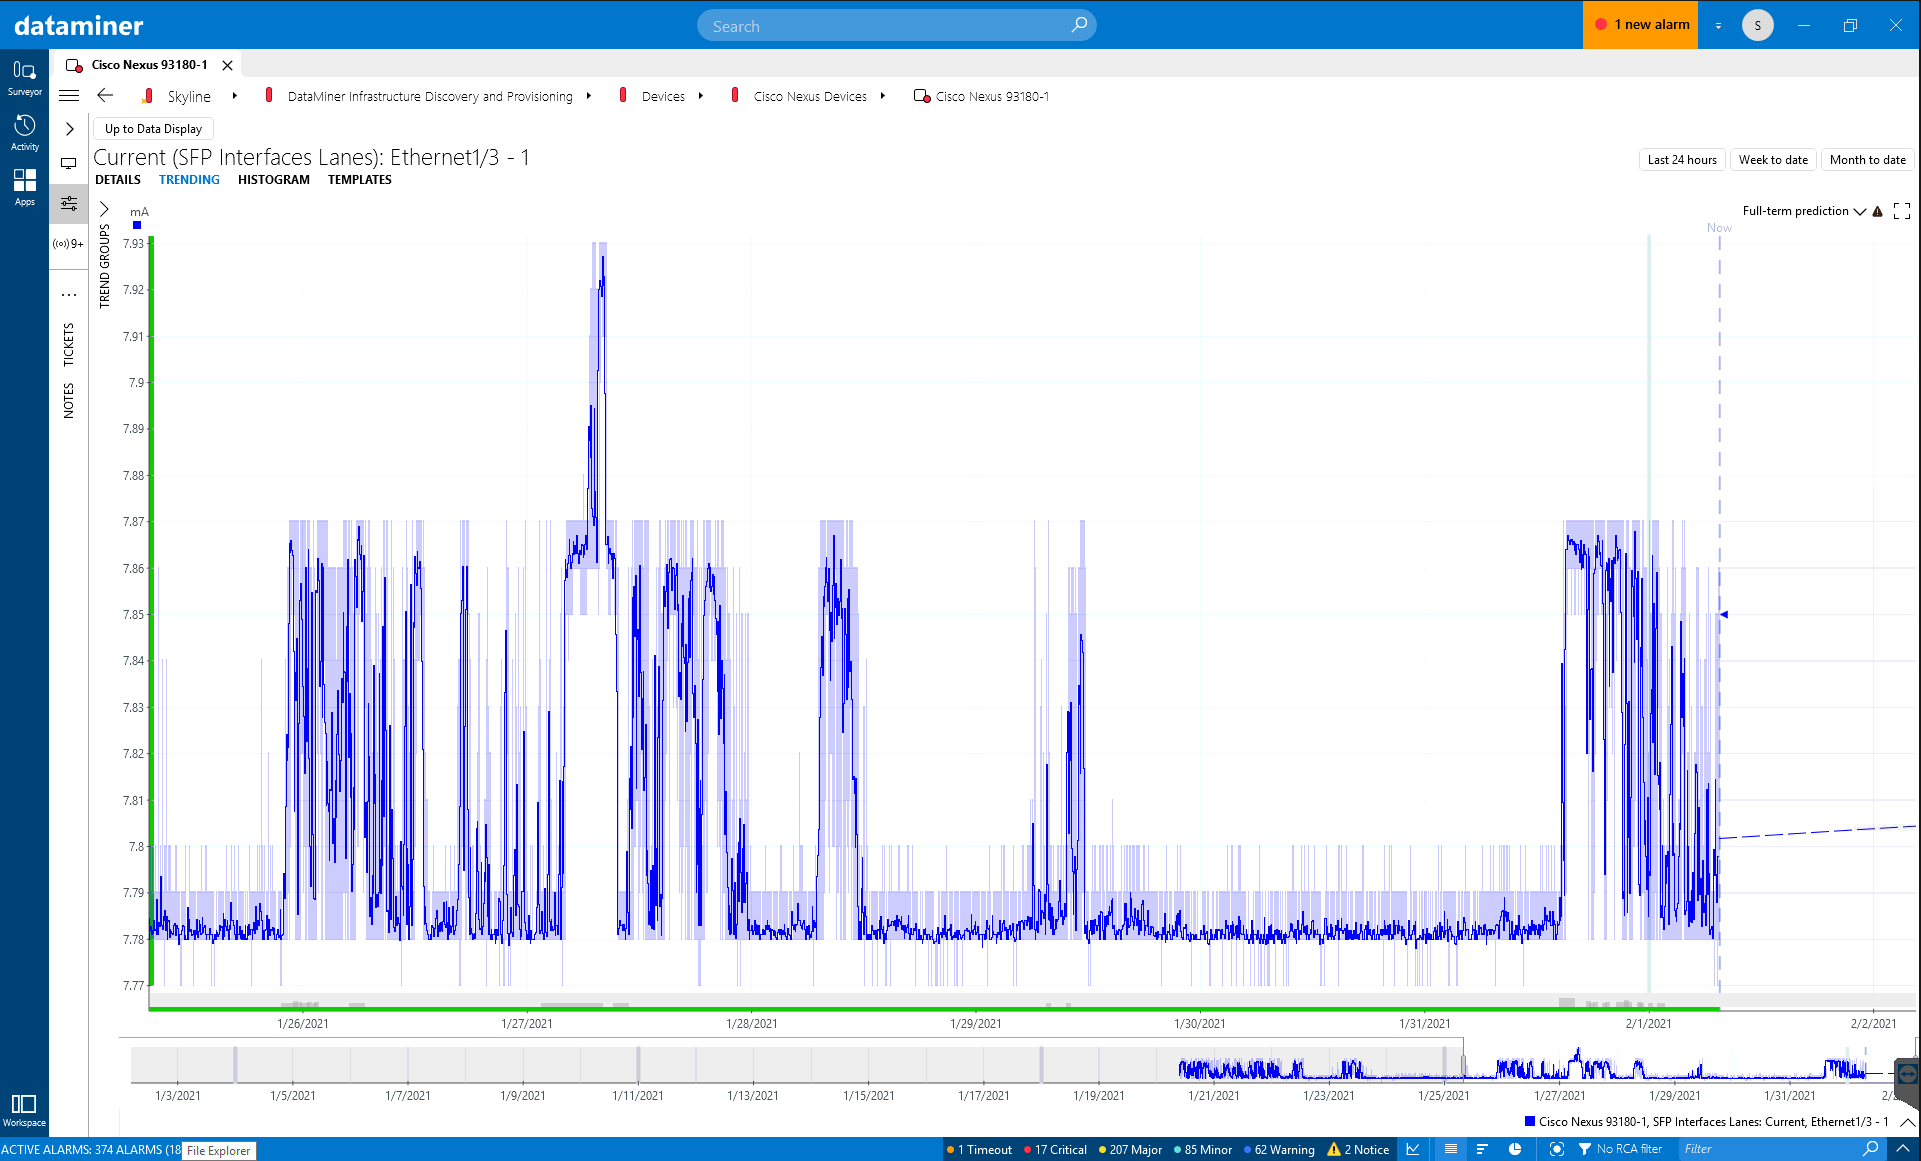 Trend graph "Current"
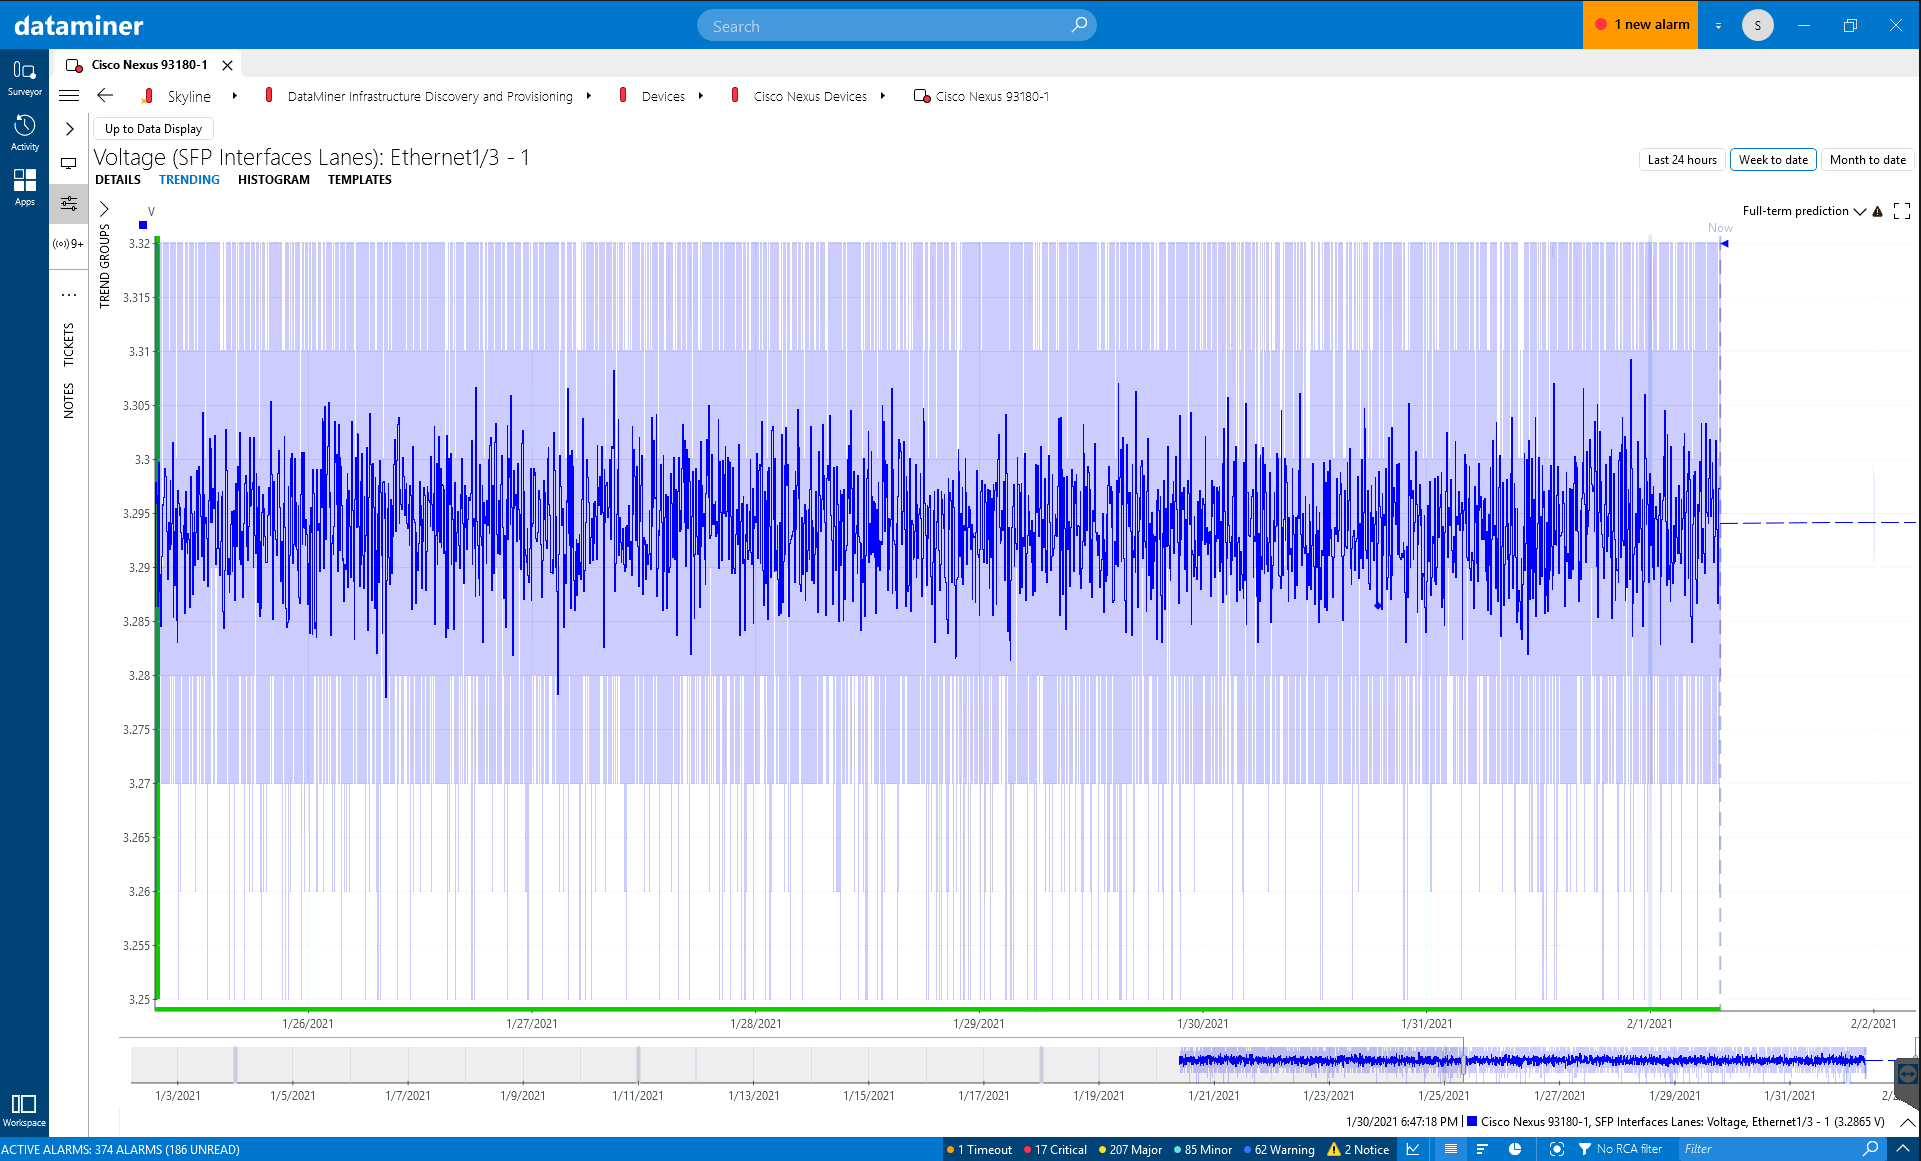 Trend graph "Voltage"
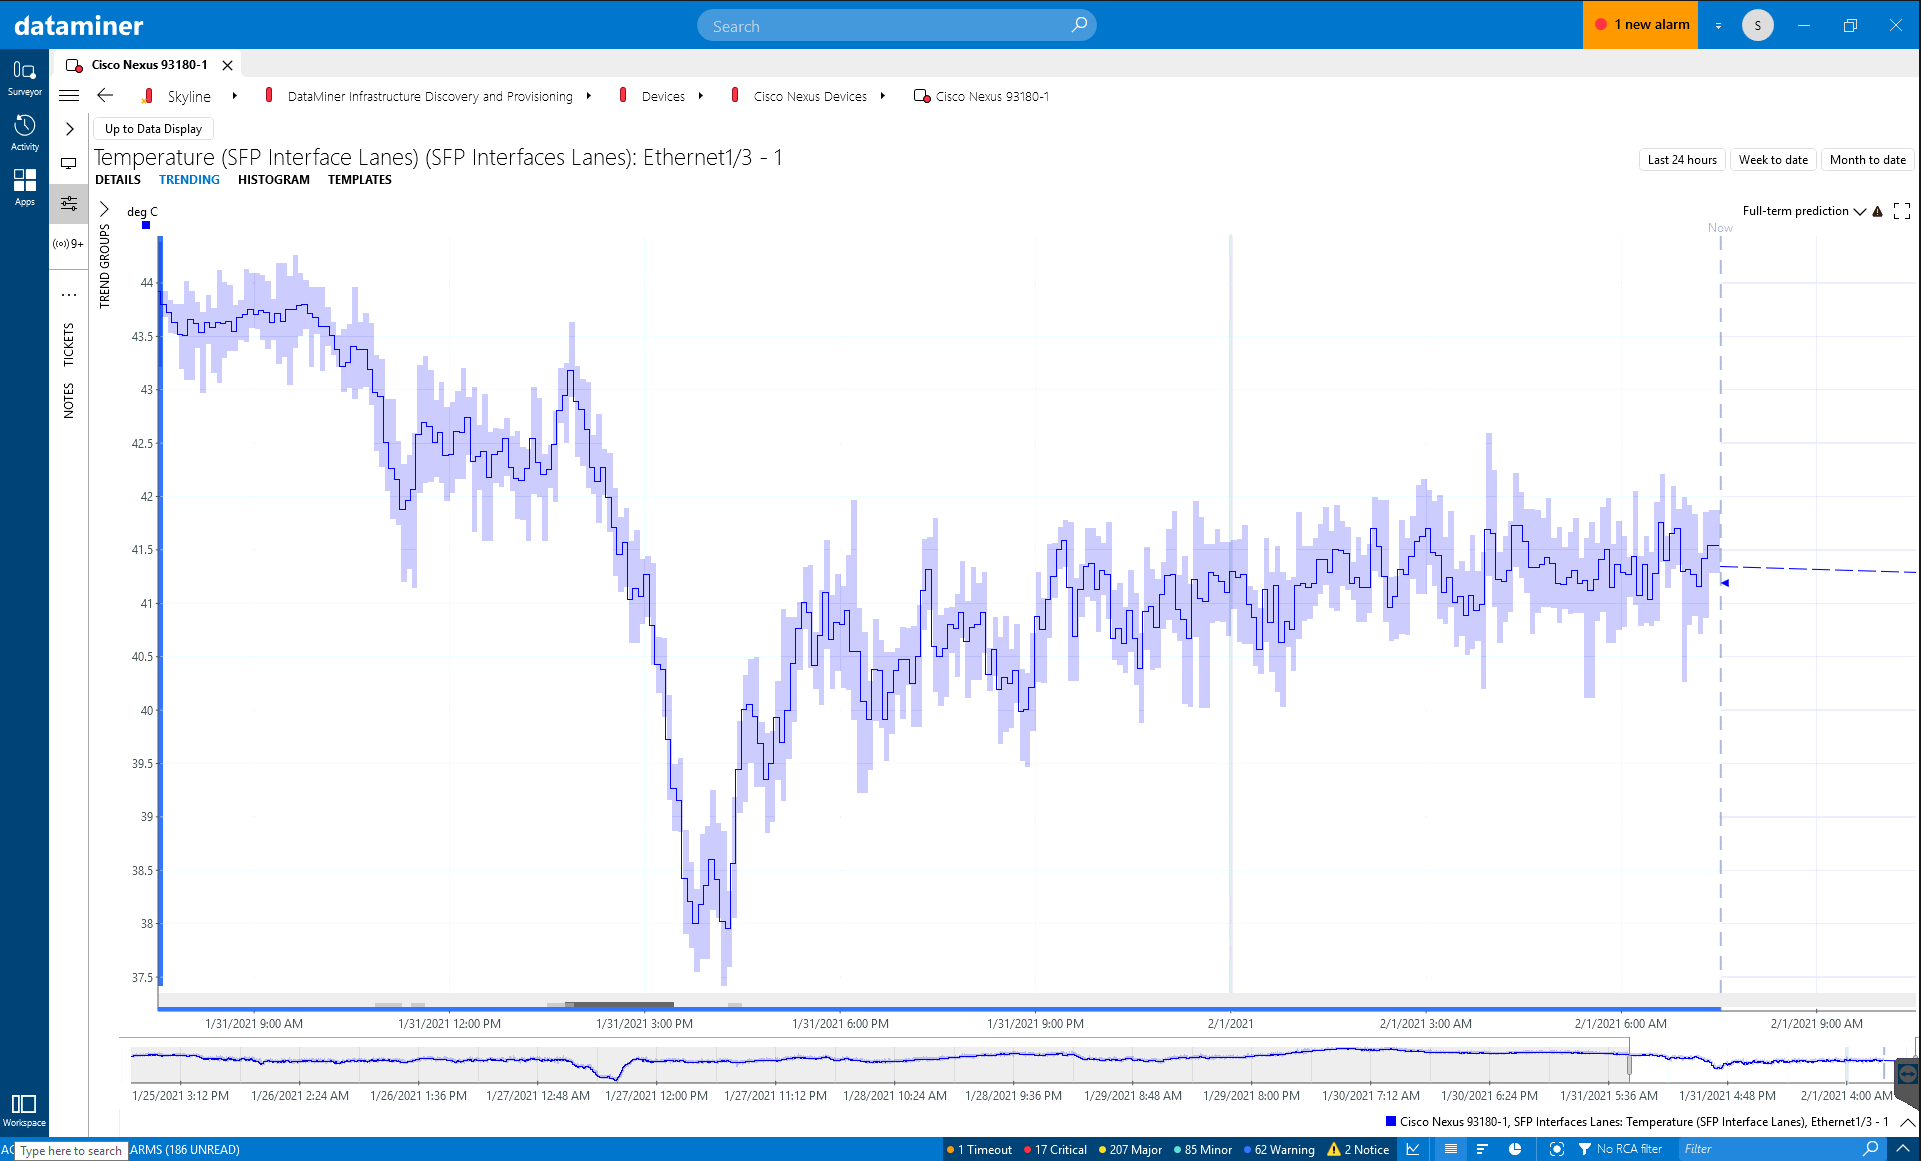 Trend graph "Temperature"
Let's have a closer look at the "Current" trend graph. DataMiner's AI engine has detected a behavioral anomaly, i.e. an unexpected level shift. As this change was a rather minor one, it was classified as not critical by the AI engine, no alarm has been raised in this scenario.
Trend graph "Temperature"
Let's have a closer look at the "Current" trend graph. DataMiner's AI engine has detected a behavioral anomaly, i.e. an unexpected level shift. As this change was a rather minor one, it was classified as not critical by the AI engine, no alarm has been raised in this scenario.
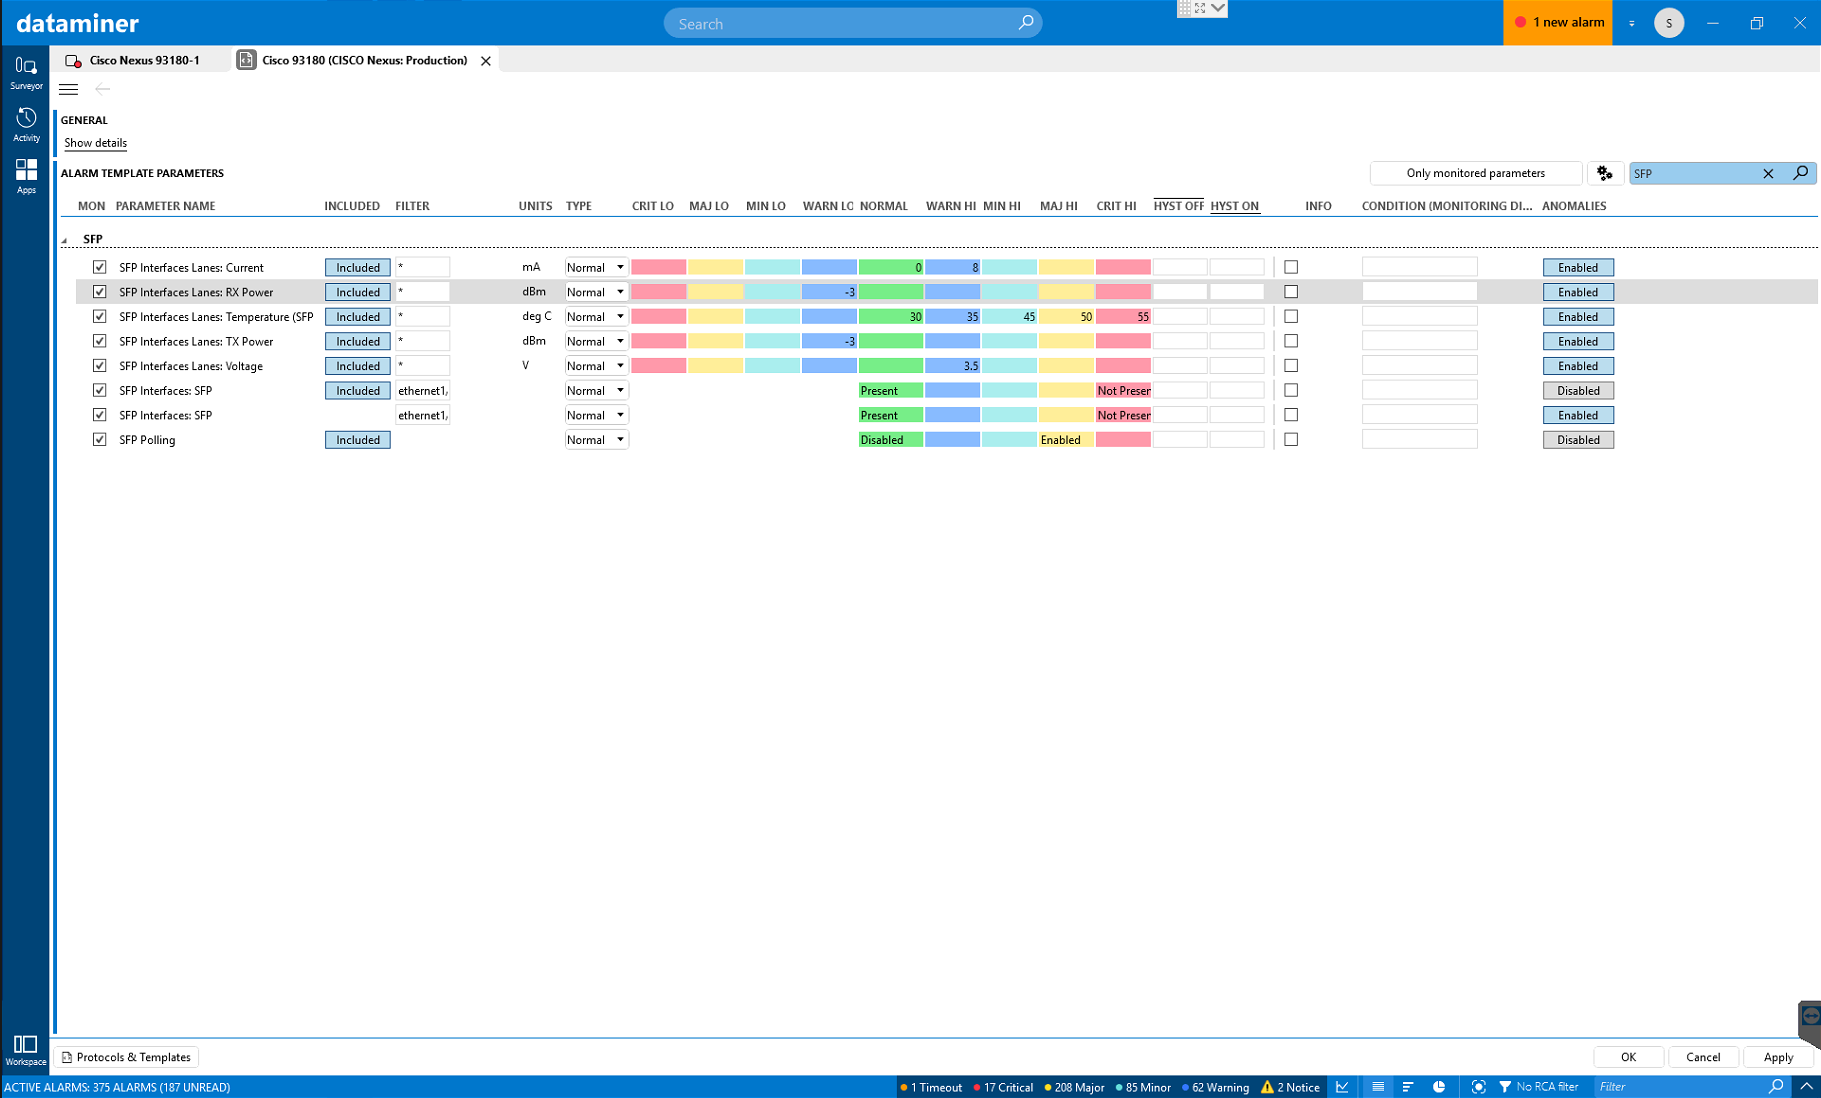 What do you need to do to benefit from DataMiner's AI capabilities: just turn it on! This screenshot is an example of a DataMiner alarm template with Anomaly Detection turned on to monitor your SFPs. Just click on the buttons on the right to activate the AI engine for those metrics.
And remember: there is no need to configure anything upfront.
In an upcoming release, DataMiner's AI capabilities will even go one step further. The AI engine will not only look into a single SFP but will check all SFPs and will learn relationships between those. Imagine the ambient temperature in the data center changes, temperature of all SFPs might go up or down. Instead of presenting plenty of standalone alarms, DataMiner will correlate those alarms into a single one automatically and will show the root cause of the problem. This is possible when you not only monitor the SFPs but also include environmental probes such as temperature sensors.
What do you need to do to benefit from DataMiner's AI capabilities: just turn it on! This screenshot is an example of a DataMiner alarm template with Anomaly Detection turned on to monitor your SFPs. Just click on the buttons on the right to activate the AI engine for those metrics.
And remember: there is no need to configure anything upfront.
In an upcoming release, DataMiner's AI capabilities will even go one step further. The AI engine will not only look into a single SFP but will check all SFPs and will learn relationships between those. Imagine the ambient temperature in the data center changes, temperature of all SFPs might go up or down. Instead of presenting plenty of standalone alarms, DataMiner will correlate those alarms into a single one automatically and will show the root cause of the problem. This is possible when you not only monitor the SFPs but also include environmental probes such as temperature sensors.
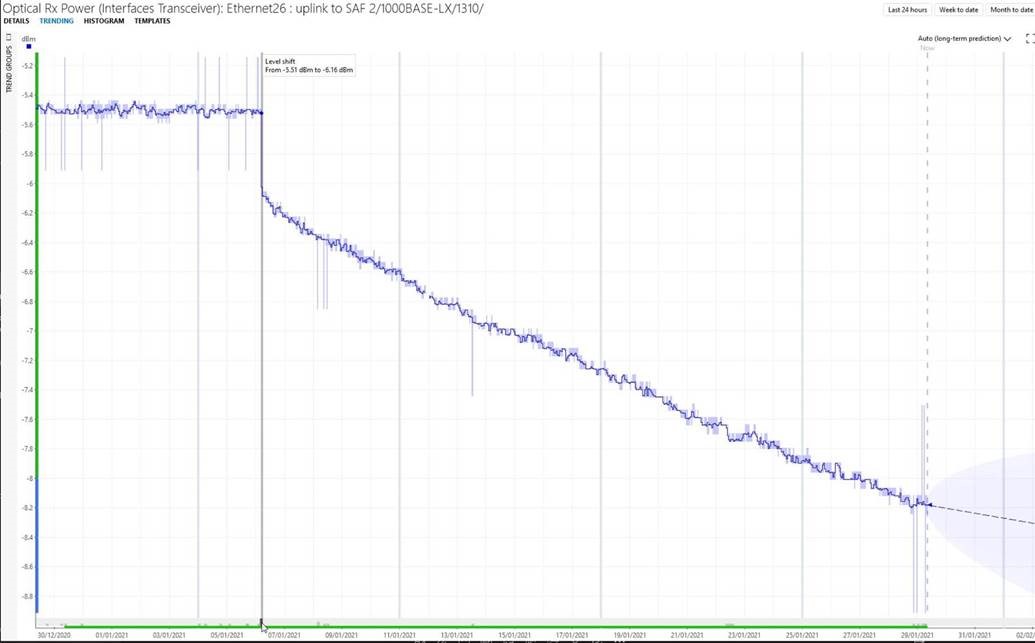 This screenshot show a real-life scenario from one of our customers. "RX Power" is constantly monitored by DataMiner and was stable for many months, around -5.4 dBm. An alarm template was set during the initial system provisioning to raise an alarm when RX Power is below -8 dBm. As you can see on the screenshot the SFP performance all over sudden started degrading. DataMiner's AI engine automatically detects this change in behavior and can inform the operator with a proactive warning message before the critical value of -8dBM set in the alarm template has been reached. This gives enough time to proactively tackle the issue before things actually go wrong.
DataMiner can even go further: imagine the fact that the AI-engine has detected this problematic SFP, this can now also trigger raising a ticket on a third-party ticketing system or creating a Planned Maintenance Slot (PLM). Alarms will we suppressed whilst planned maintenance is ongoing, but even more DataMiner can recalculate the available network capacity and for example reroute media flows upfront before the SFP gets swapped by the engineering team at the specified time
To achieve all of this, make sure you invest into SFPs which allow in depth monitoring! For more information on planned maintenance, have a look at the APP section on Dojo: https://community.dataminer.services/dataminer-apps/
This screenshot show a real-life scenario from one of our customers. "RX Power" is constantly monitored by DataMiner and was stable for many months, around -5.4 dBm. An alarm template was set during the initial system provisioning to raise an alarm when RX Power is below -8 dBm. As you can see on the screenshot the SFP performance all over sudden started degrading. DataMiner's AI engine automatically detects this change in behavior and can inform the operator with a proactive warning message before the critical value of -8dBM set in the alarm template has been reached. This gives enough time to proactively tackle the issue before things actually go wrong.
DataMiner can even go further: imagine the fact that the AI-engine has detected this problematic SFP, this can now also trigger raising a ticket on a third-party ticketing system or creating a Planned Maintenance Slot (PLM). Alarms will we suppressed whilst planned maintenance is ongoing, but even more DataMiner can recalculate the available network capacity and for example reroute media flows upfront before the SFP gets swapped by the engineering team at the specified time
To achieve all of this, make sure you invest into SFPs which allow in depth monitoring! For more information on planned maintenance, have a look at the APP section on Dojo: https://community.dataminer.services/dataminer-apps/
1 thought on “AI-assisted SFP performance monitoring”
Leave a Reply
You must be logged in to post a comment.
very informative