solution Use Case
5G Interference testing
Teleport reception interferences are problematic; they impact the signal at a phase where it is difficult to compensate or add resilience, impacting customers’ SLAs in unforeseen ways. Dealing with these interferences can be quite a headache, especially when their origin is inconstant as mobile transmissions.
With 5G C-band transmissions moving into the 3.55GHz to 4GHz range, there is a possibility for interference on local teleports. 5G cell tower interference on teleport reception can be complex to detect. The inconsistent nature of cell signals makes them hard to catch.
In this application, DataMiner identifies the interfering tower, carriers, and impacted frequencies, documenting the issue precisely.
To address this challenge effectively, we opted for a directional antenna mounted on a rotator to collect interference readings 360 degrees around the teleport under examination. We employed the CelPlan Cell Scanner and YAESU-compliant rotator controller for this purpose. The system collected PS-RSRP (Primary Synchronization – Reference Signal Received Power) readings every 8 degrees for C-band frequencies between 3.55GHz and 4 GHz. Our reference point for identifying the GSCN channels, bands, and center frequencies used was the standards document “ETSI TS 138 104 v15.5.0 (2022-04)”.
Once all the equipment and communications were in place, the challenge lay in correlating the collected readings with the angle of the antenna. We achieved this by leveraging DataMiner Dashboards with GQI. This correlation allowed us to modify the X/Y axis to represent the RSRP reading level relative to the antenna’s direction.
This display allows technicians to quickly identify potential cell tower direction interference and helps determining what associated provider is the likely culprit based on the channel and PCI value of the reading(s).
USE CASE DETAILS
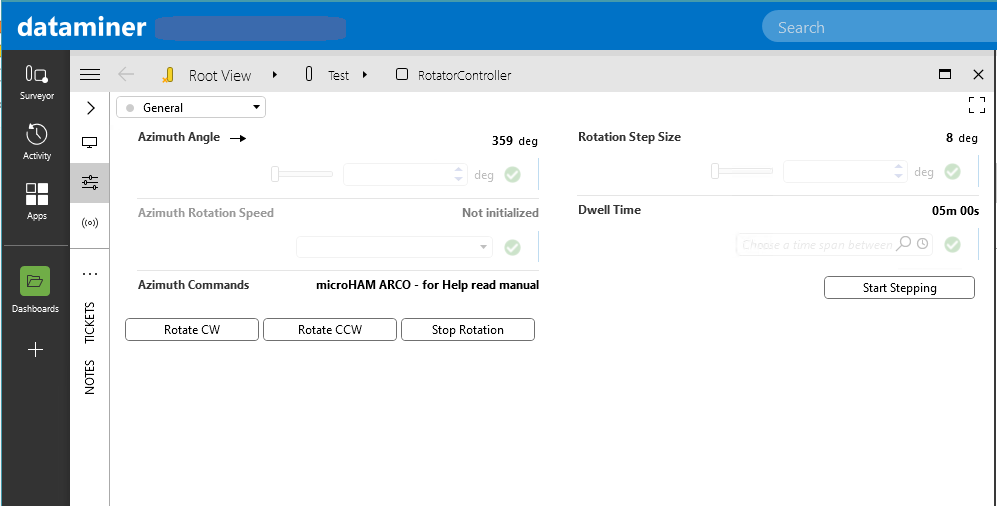 This image shows the Rotator Controller, responsible for managing the Azimuth angle. It operates through a scheduled Automation script, performing full rotations twice a day: once in the morning and again during the evening rush hour.
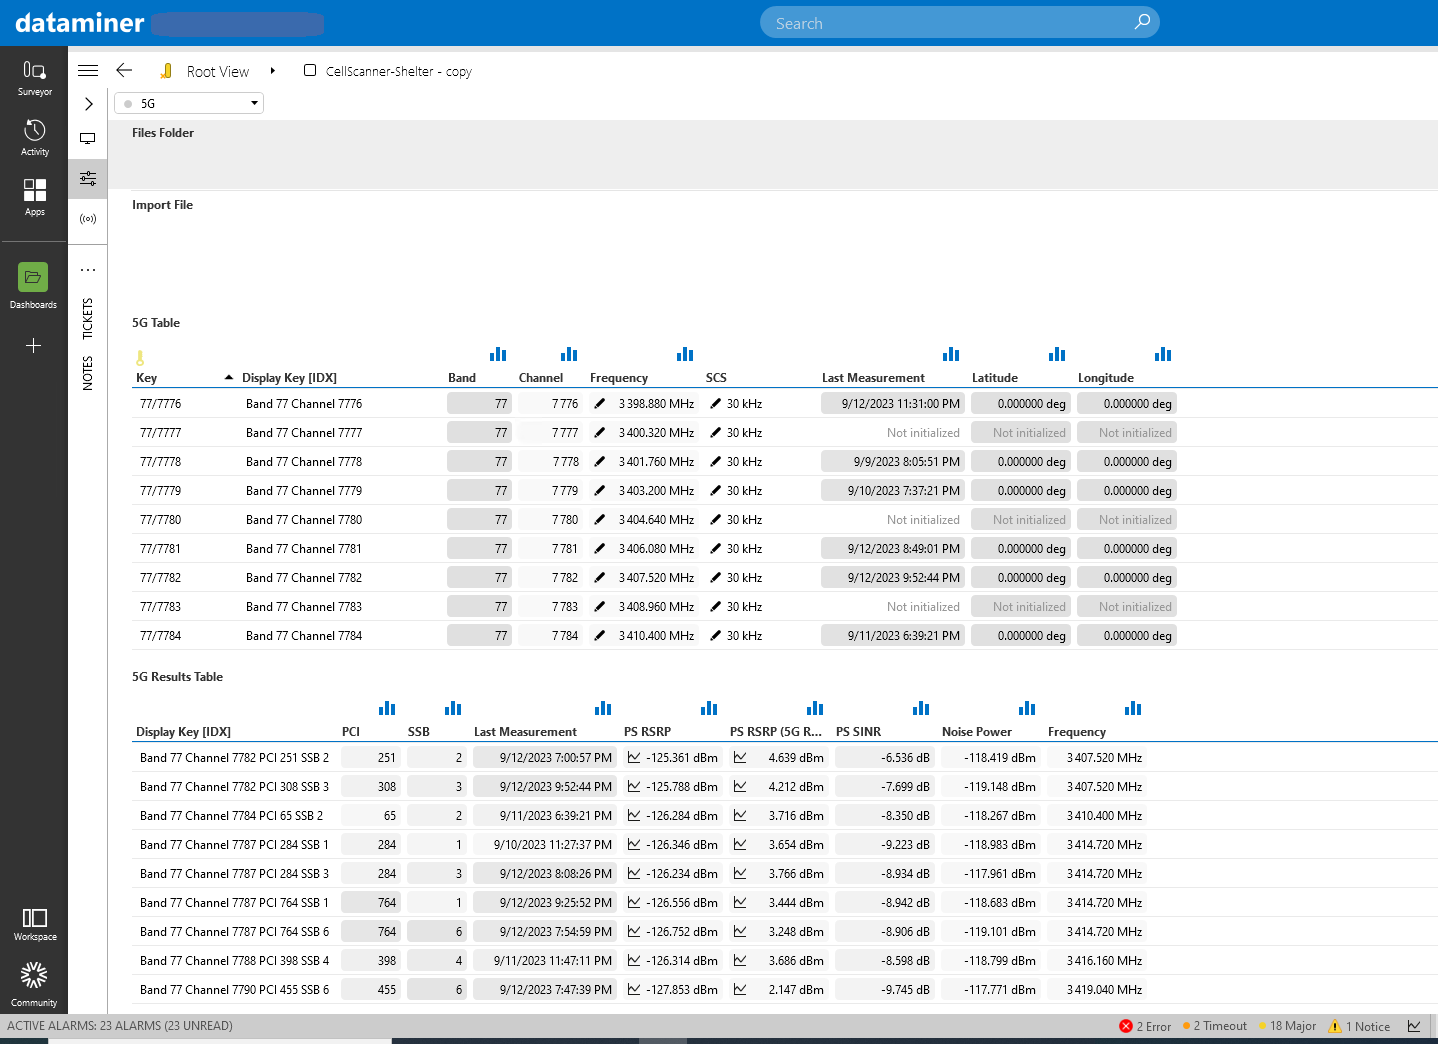 The Cell Scanner is configured to collect readings on 510 GSCN (Global Synchronization Raster Channel) channels.
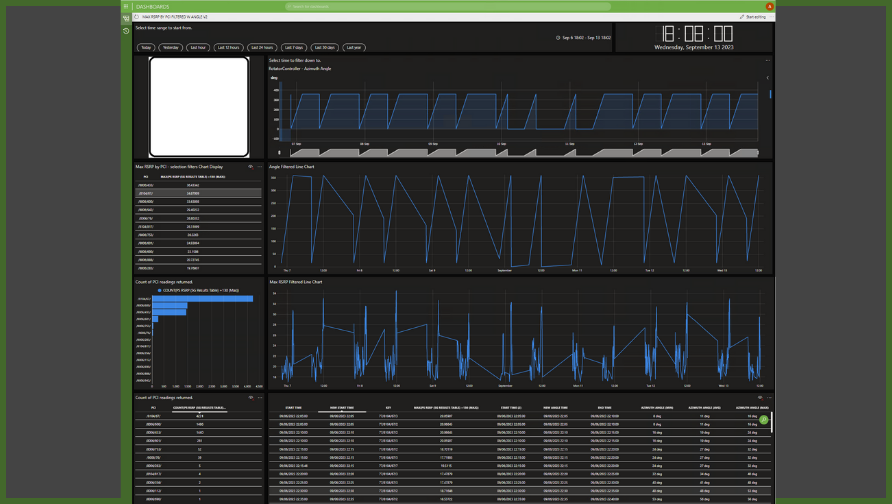
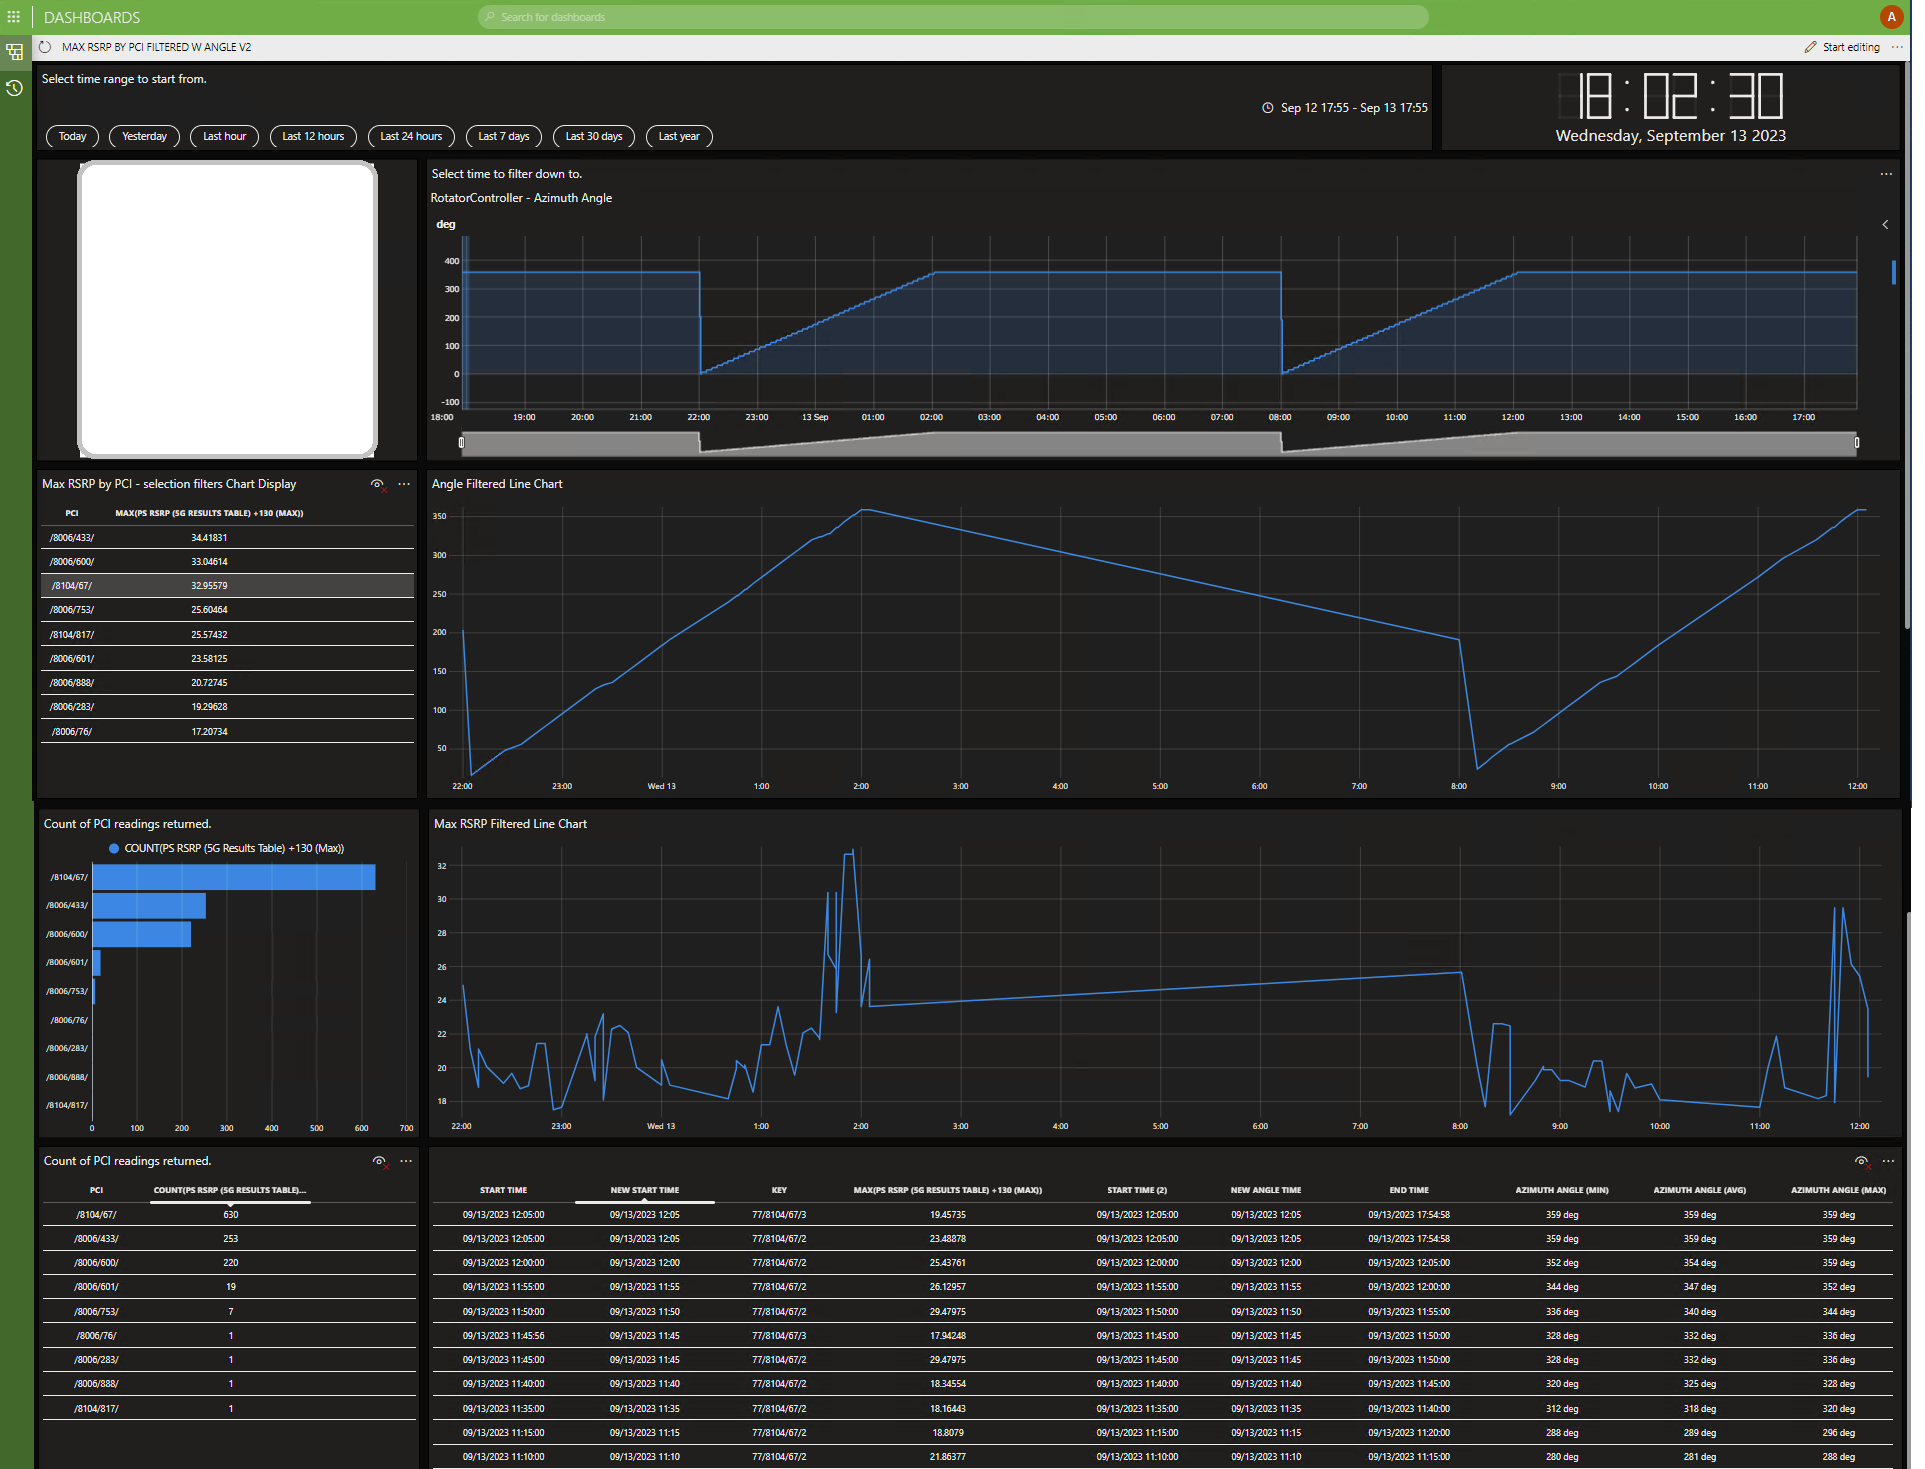 This interactive dashboard allows you to select the reporting time, delve into specific rotation event(s), and choose which PCI to display in the charts on the right. On the left side of the dashboard, you’ll find tables and charts illustrating the maximum RSRP per PCI received and the total number of PCI readings received within the selected timeframe.
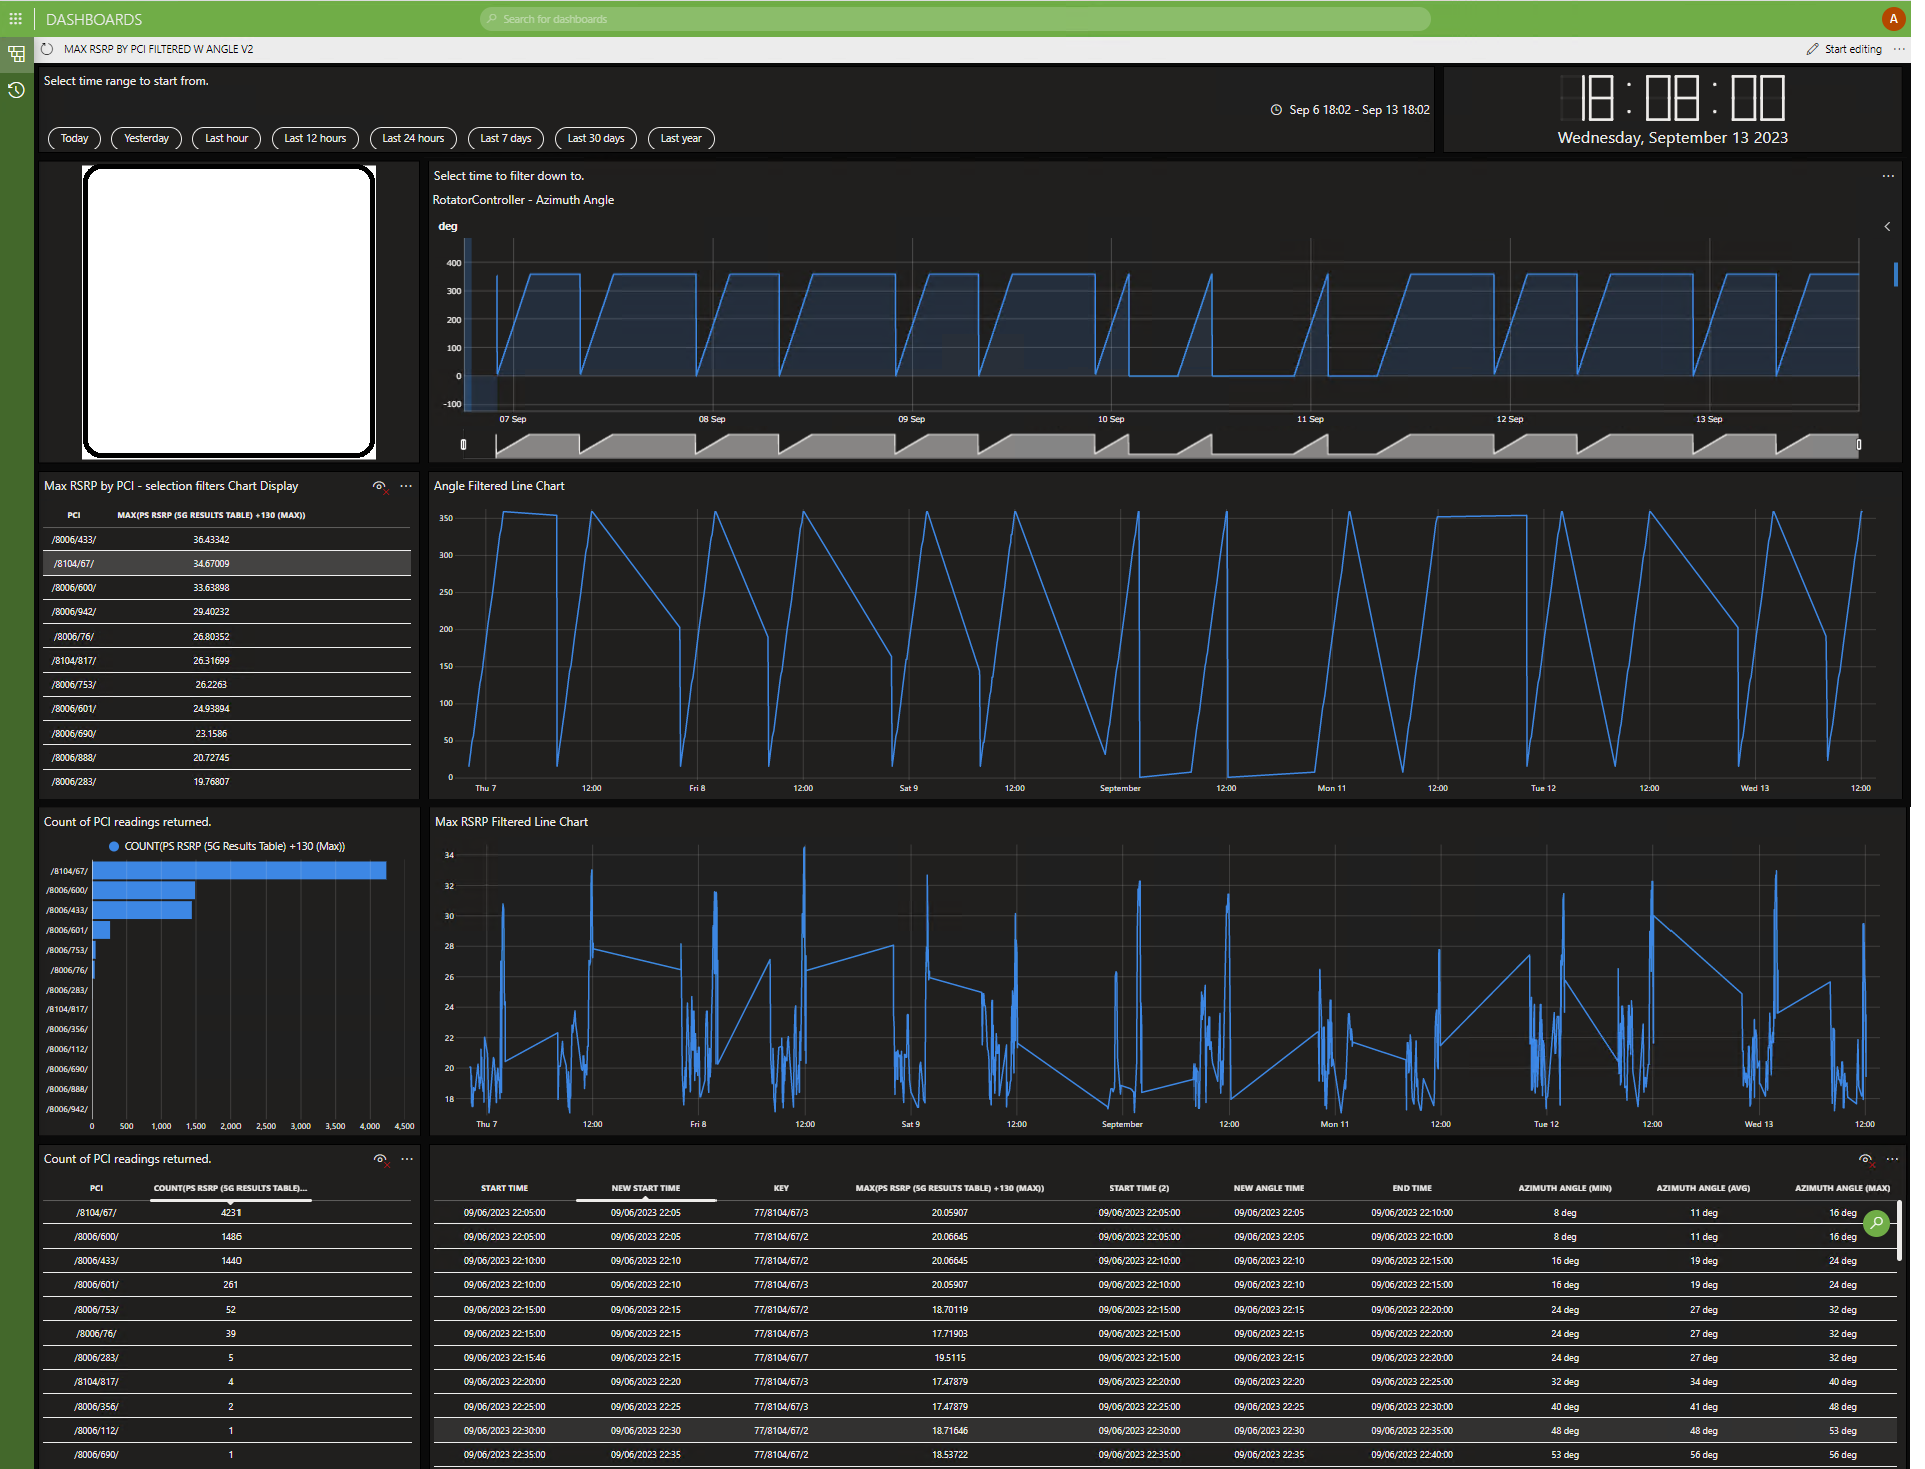 This image shows the results for the last 7 days, enabling you to start identifying patterns in RSRP levels and pinpoint what angle relative to the test site the signal is coming from. In this example, the highest RSRP readings originated from the NNW direction.
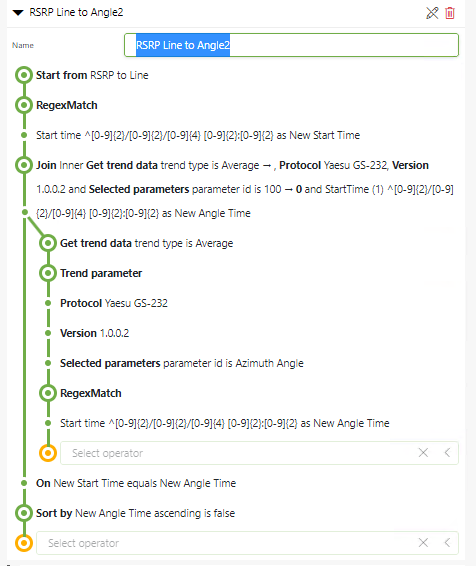 Here’s a sample of the GQI query designed to establish a correlation between the two different trend elements.