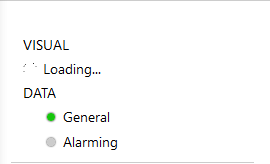
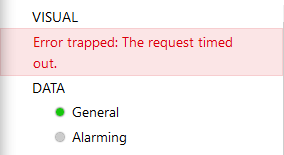
One of Visios needs to load consistently on /monitoring; most times, this results in errors. Sometimes this stalls on 'Loading' and results in 'The request timed out' error. A few times, it displayed tabs, but clicking on them resulted in 'Could not retrieve the image for the Visual Overview'.
The Cube client is working consistently but needs the monitoring App. We are using DMA itself for testing, and the frequency of errors increases when the monitoring app is used outside DMA. DMA has enough resources, CPU usage is always under 10%, and there is plenty of memory space.


Where can I find logs for this monitoring page load? Appreciate if there are any suggestions on best way to debug this issue.
Hi Sri,
A good starting point regarding logging on Visio rendering issues is SLUIProvider.txt in c:\Skyline DataMiner\Logging
The process that's doing the rendering is slhelper. If you look at the process list on your agent, you might find multiple instances of slhelper, that's because the process can also do other things like for example executing GQI query's. Anyway, if you can find the slhelper process linked to the rendering of the Visio's, it's safe to kill it and refresh your browser. Then you'll see that a new session will start in your logging and you can maybe get some clue on what is going on...
If you by accident kill a slhelper process that was executing a GQI, it will only affect the dashboard/app that is using it in its current session. Refreshing that dashboard/app will automatically start a new instance of slhelper again. My point is, killing an slhelper will typically have a very limited impact and will somehow auto-resolve.