Dear Community,
I want to seek your advice on possible ideas for the following use case: "As a DataMiner Operator, I wish to have visibility into new developments deployed in the last month in my environment, such as automation scripts, connectors, visualizations, dashboards, low-code applications, etc... Ideally, this information should be available in a table that could allow me afterward to display it in a dashboard.
Do you have any suggestions on how I can implement this use case? Where can I quickly retrieve this information, or do you have any tips and tricks that could streamline and accelerate the development of this use case?
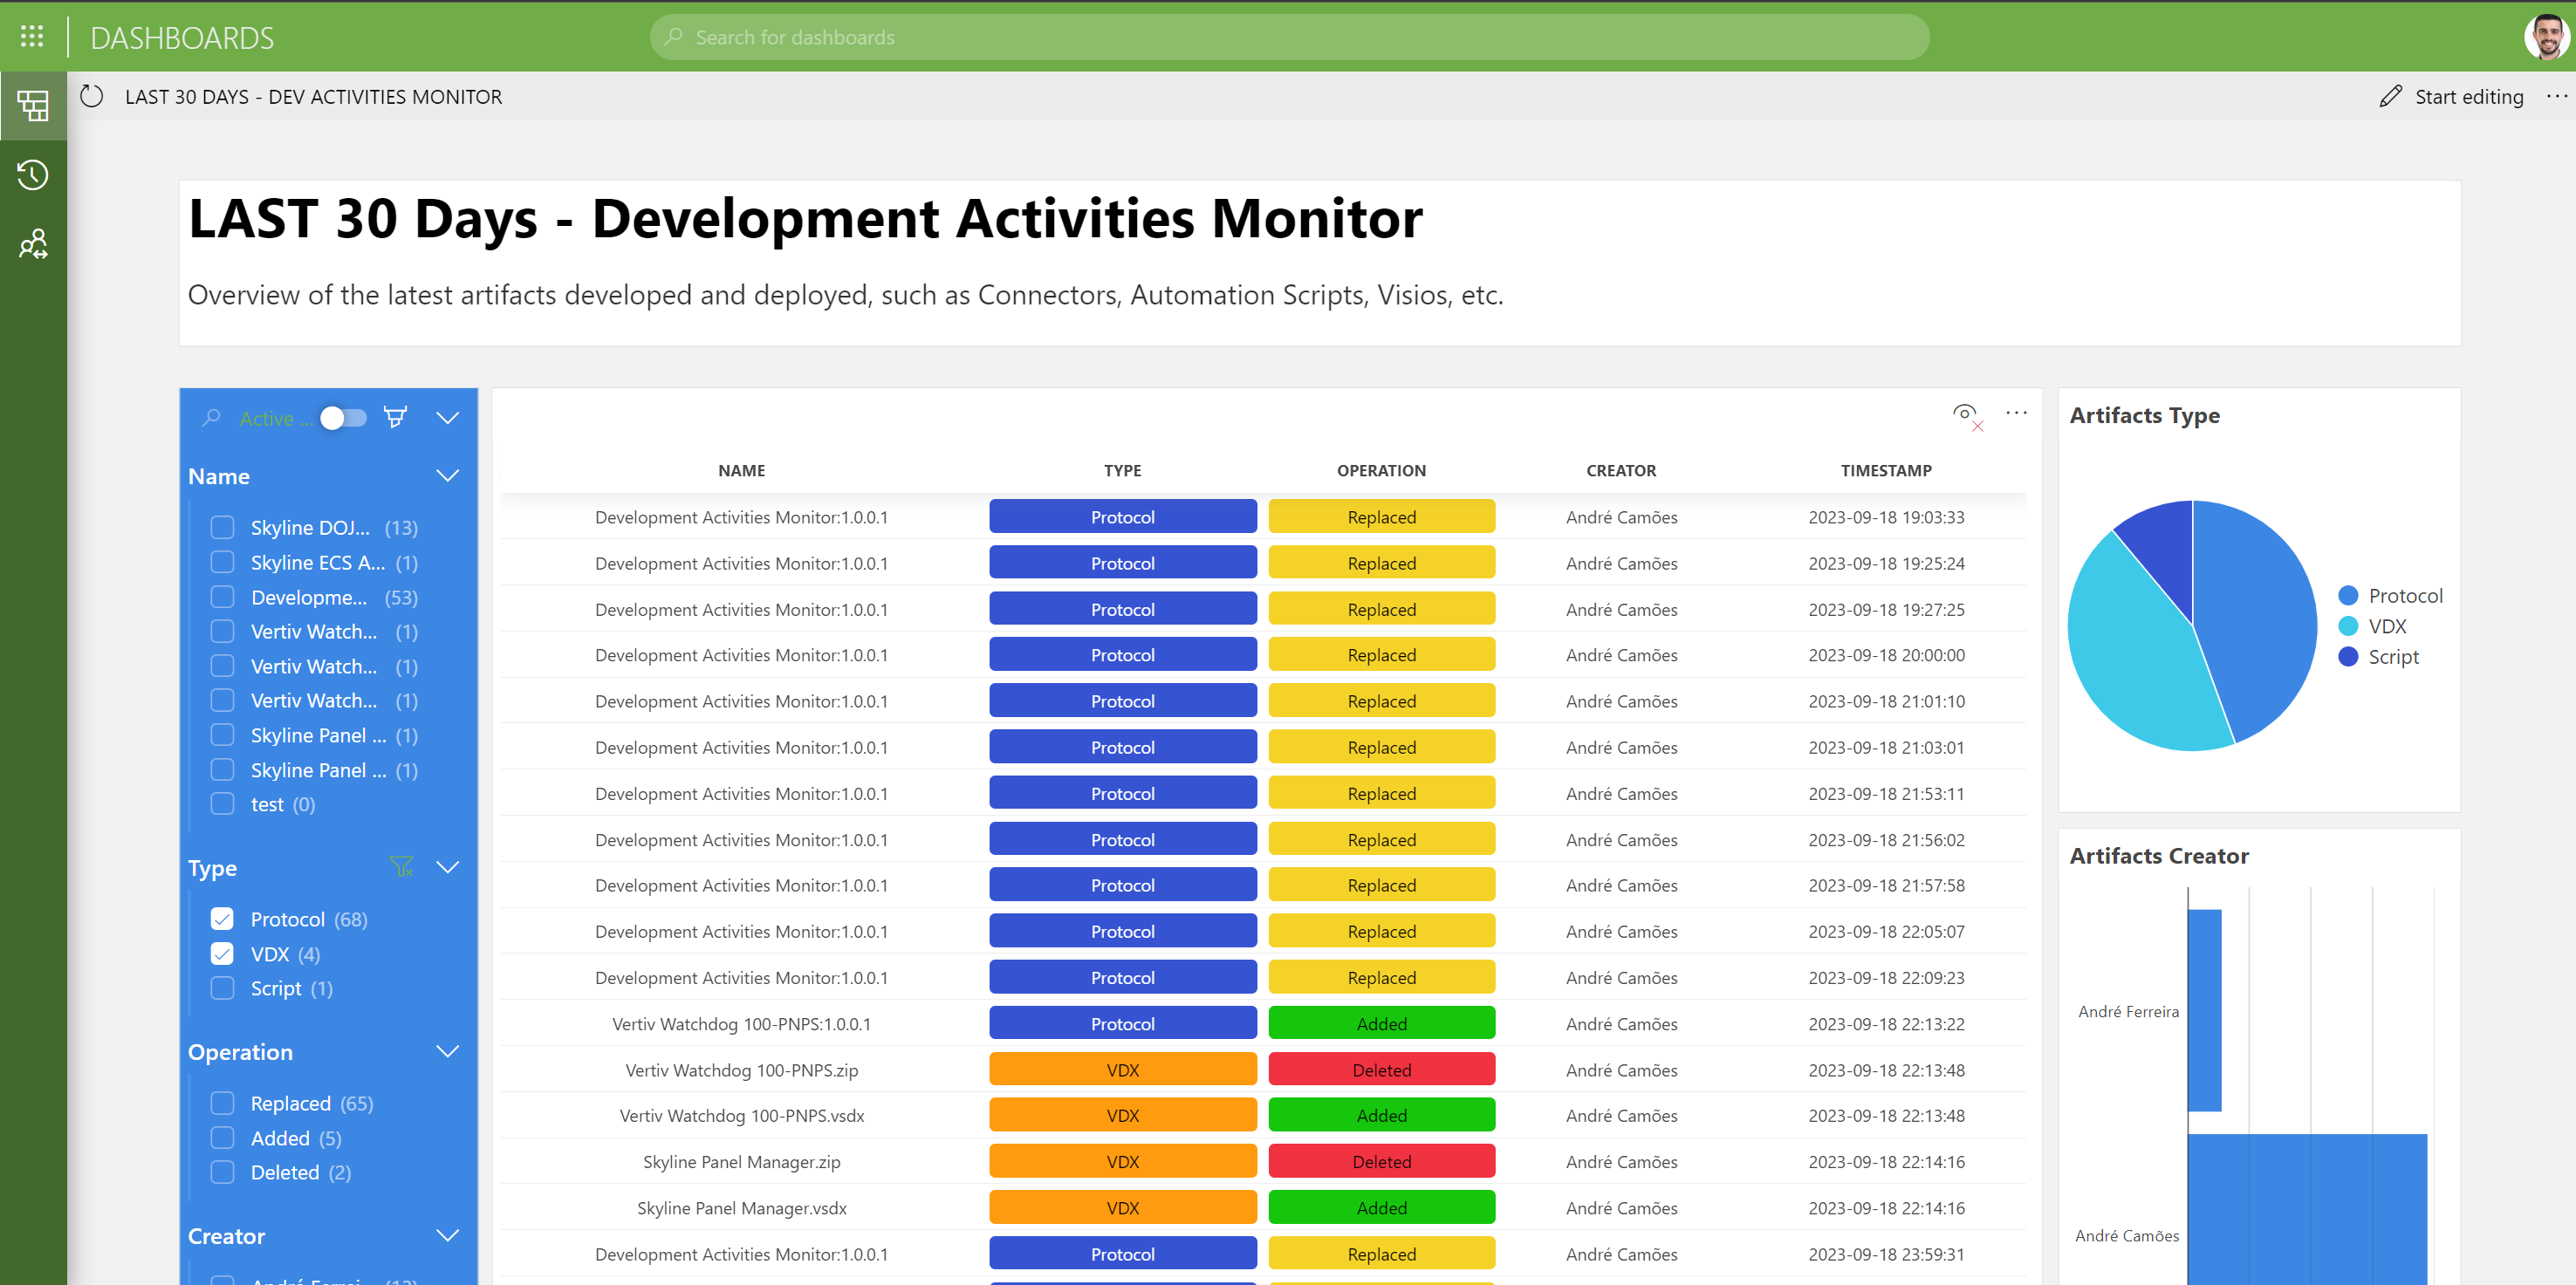
Quick update: As you can see, through the processing of information events, it was possible to create the dashboard that I present below, which basically provides me with a very simple and direct overview of what has been developed and deployed in my system (e.g., Connectors, Automation Scripts, Visios, etc.) in the last 30 days.

It's amazing how easy it is to create such appealing dashboards!💪🔝
Thanks for your help Dojo Community.
This is amazing!
Is this something that can be made available in the catalog for other users to deploy 🙂