Skip to content
DataMiner DoJo

More results...

Generic selectors
Exact matches only
Search in title
Search in content
Post Type Selectors
Search in posts
Search in pages
Search in posts
Search in pages
Log in
Menu
  • Blog
  • Questions
  • Learning
    • E-learning Courses
    • Open Classroom Training
    • Certification
      • DataMiner Fundamentals
      • DataMiner Configurator
      • DataMiner Automation
      • Scripts & Connectors Developer: HTTP Basics
      • Scripts & Connectors Developer: SNMP Basics
      • Visual Overview – Level 1
      • Verify a certificate
    • Tutorials
    • Video Library
    • Books We Like
    • >> Go to DataMiner Docs
  • Expert Center
    • Solutions & Use Cases
      • Solutions
      • Use Case Library
    • Markets & Industries
      • Media production
      • Government & defense
      • Content distribution
      • Service providers
      • Partners
      • OSS/BSS
    • DataMiner Insights
      • Security
      • Integration Studio
      • System Architecture
      • DataMiner Releases & Updates
      • DataMiner Apps
    • Agile
      • Agile Webspace
      • Everything Agile
        • The Agile Manifesto
        • Best Practices
        • Retro Recipes
      • Methodologies
        • The Scrum Framework
        • Kanban
        • Extreme Programming
      • Roles
        • The Product Owner
        • The Agile Coach
        • The Quality & UX Coach (QX)
    • DataMiner DevOps Professional Program
  • Downloads
  • More
    • Feature Suggestions
    • Climb the leaderboard!
    • Swag Shop
    • Contact
      • General Inquiries
      • DataMiner DevOps Support
      • Commercial Requests
    • Global Feedback Survey
  • PARTNERS
    • All Partners
    • Technology Partners
    • Strategic Partner Program
    • Deal Registration
  • >> Go to dataminer.services

Live bar graphs in Visual overview.

Solved932 views21st August 2024liveShapes Visio Visual Overview
1
Nathan Sciani [DevOps Member]481 20th August 2024 0 Comments

Hi All.

Is there a way to display live bar graphs like below in a Visio shape.

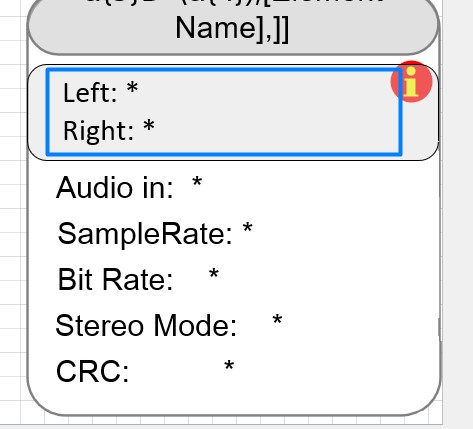
I wanted to display the left and right audio levels from a device on a mimic where I only have number values.

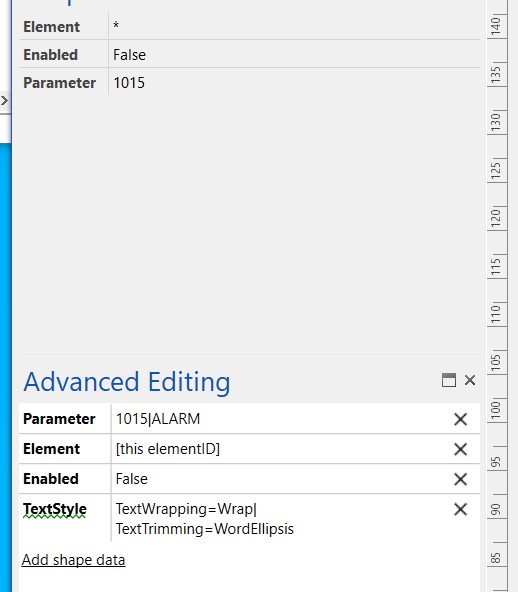
Below is how I currently display the shape data.

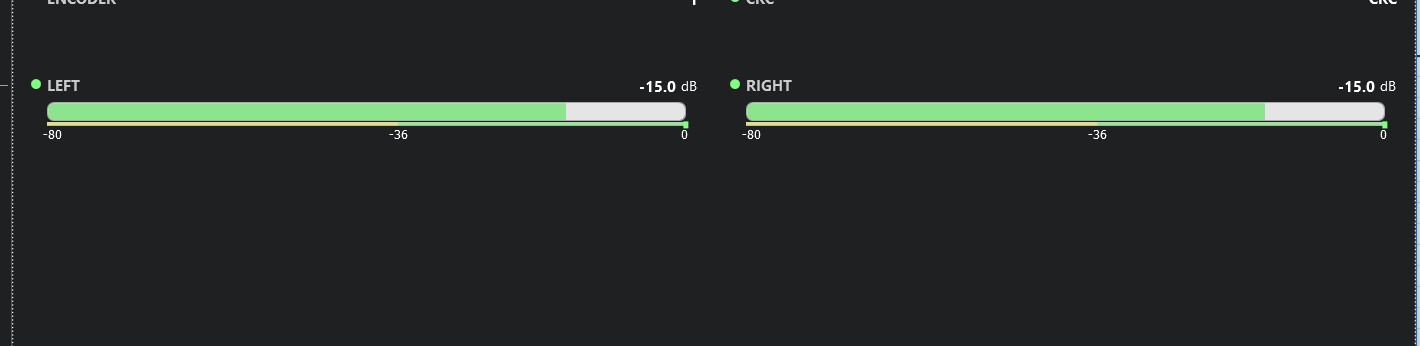
This is what I was hoping to display as a visual on a mimic

Nathan Sciani [DevOps Member] Answered question 21st August 2024

3 Answers

  • Active
  • Voted
  • Newest
  • Oldest
0
Matthijs Favorel [SLC] [DevOps Advocate]1.97K Posted 20th August 2024 1 Comment

Hi Nathan,

If you want to mimic the look of the parameter control, then the easiest way is to use the ParameterControl shape data as Miguel mentioned.

If you want to give it a custom look, you could use the Path Shape Data (note that this is a bit more complex): https://docs.dataminer.services/user-guide/Basic_Functionality/Visio/making_shapes_display_info/Making_a_shape_display_a_custom_drawing_using_Path_markup.html

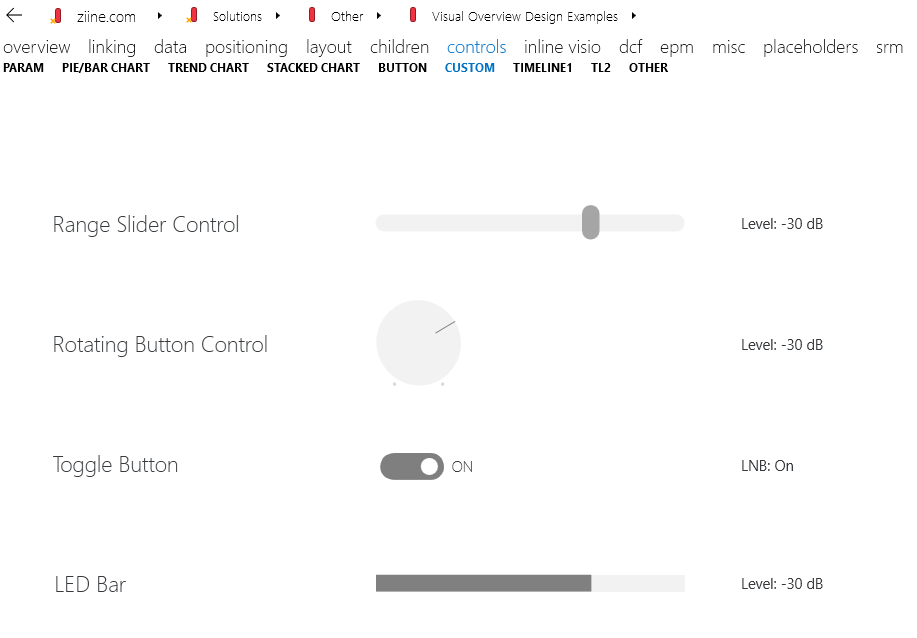
There is an example of a led bar on the public Ziine DataMiner.

Nathan Sciani [DevOps Member] Posted new comment 21st August 2024
Nathan Sciani [DevOps Member] commented 21st August 2024

Thank you Matthijs.
I will look at implementing this when I have some more time. but it does look promising.

You are viewing 1 out of 3 answers, click here to view all answers.
Please login to be able to comment or post an answer.

My DevOps rank

DevOps Members get more insights on their profile page.

My user earnings

0 Dojo credits

Spend your credits in our swag shop.

0 Reputation points

Boost your reputation, climb the leaderboard.

Promo banner DataMiner DevOps Professiona Program
DataMiner Integration Studio (DIS)
Empower Katas

Recent questions

Alarm Dashboard PDF/CSV Export 0 Answers | 0 Votes
Is the Microsoft SharePoint Connector Still Usable 0 Answers | 0 Votes

Question Tags

adl2099 (115) alarm (62) Alarm Console (82) alarms (100) alarm template (83) Automation (223) automation scipt (111) Automation script (167) backup (71) Cassandra (180) Connector (108) Correlation (68) Cube (150) Dashboard (194) Dashboards (188) database (83) DataMiner Cube (57) DIS (81) DMS (71) DOM (139) driver (65) DVE (55) Elastic (83) Elasticsearch (115) elements (80) Failover (104) GQI (159) HTTP (76) IDP (74) LCA (151) low code app (166) low code apps (93) lowcodeapps (75) MySQL (53) protocol (203) QAction (83) security (88) services (51) SNMP (86) SRM (337) table (54) trending (87) upgrade (62) Visio (539) Visual Overview (345)
Privacy Policy • Terms & Conditions • Contact

© 2025 Skyline Communications. All rights reserved.

DOJO Q&A widget

Can't find what you need?

? Explore the Q&A DataMiner Docs

[ Placeholder content for popup link ] WordPress Download Manager - Best Download Management Plugin