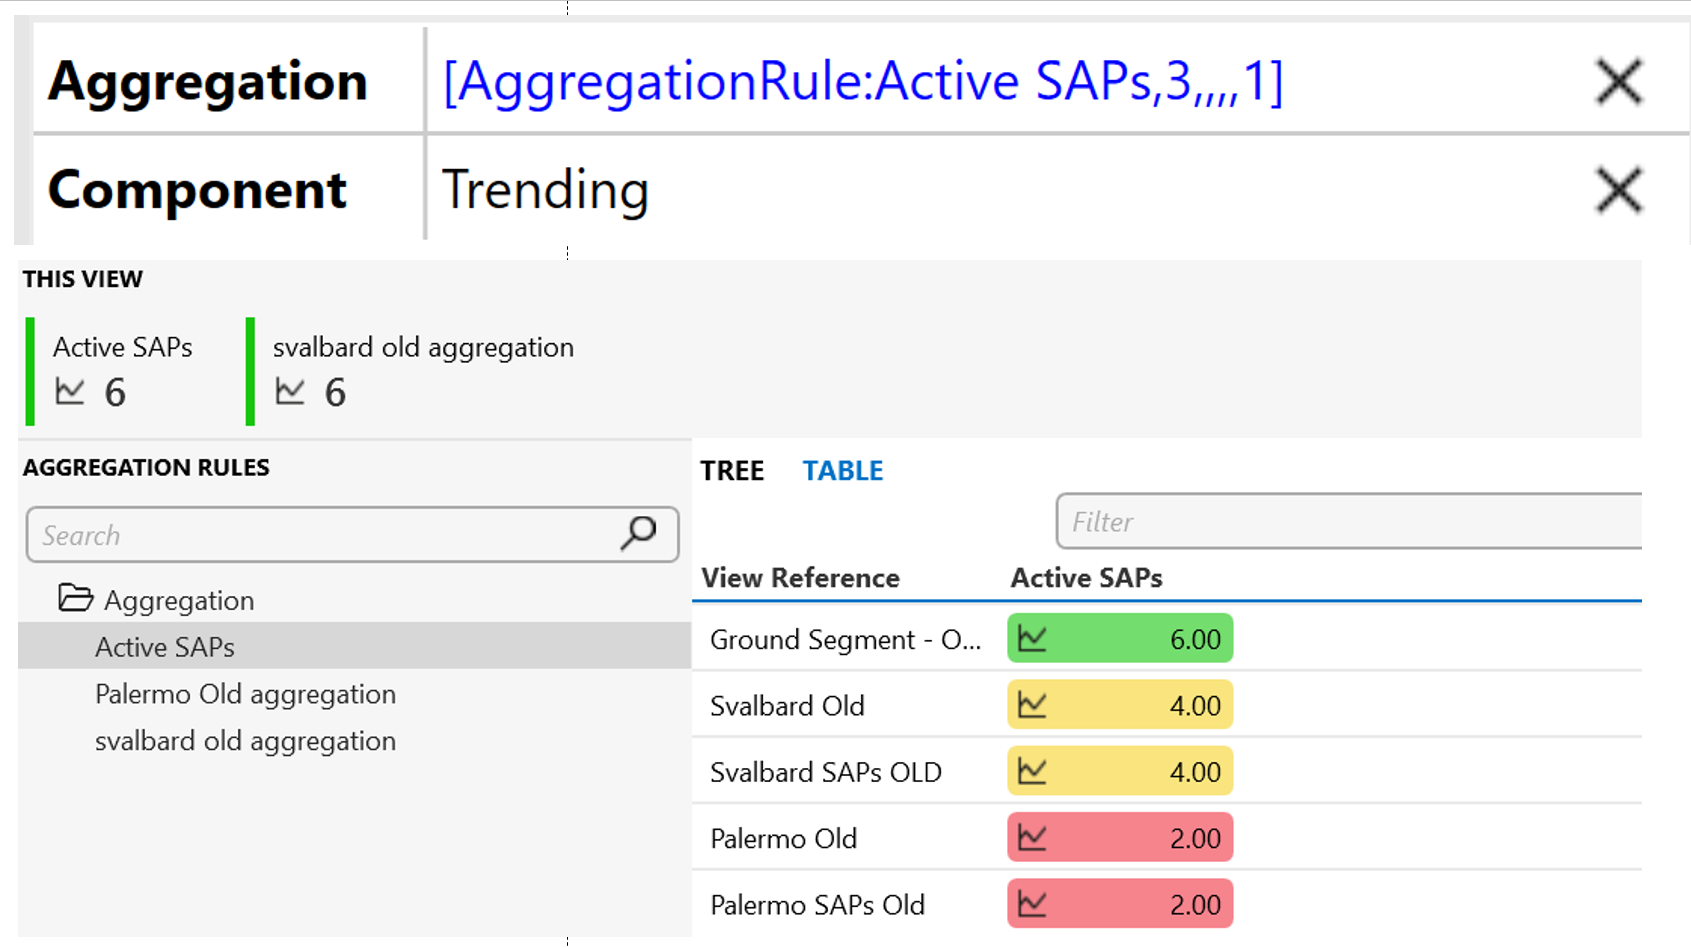
I am trying to display the values (with alarm colouring) from a specific row or rows of an aggregation rule in a visio shape, however, the shape doesn't get populated. Additionally, I'd like to display the trending graph on visio.
Could there be something missing?
The View ID that I want to Aggregate from is ID: 3, which provides the result on this screenshot.
Here is an example of where I linked and aggregation rule. There are 10 USC chassis per rack. The view represents a the Server Rack. I am aggregating and finding the average metrics across the 10 servers per rack and displaying them in the Visio below.
To link the Overall Utilization aggregation I used the following in the shape data:
[AggregationRule:UCS/UCS Overall Utilization,[this viewID]]Aggregation Folder: UCS
Aggregation Rule: UCS/UCS Overall Utilizaiion
The following dynamically links me to the view I select with [this viewID]
This next Image shows the aggregation rule table for an Equipment Row (Row Mission 503) that contains 11 equipment racks (Mission 503.10 is a rack, Mission 503.11 is a rack). I can now click on any Row or Rack View and dynamically view the aggregation values per row or just per rack. The blue line indicates the USC folder and the aggregation rules. The Red line is the example of the view I showed above.
The images are small so send me an email at randy.ulvenes@skyline.be and I can give more details if needed.