Skip to content
DataMiner DoJo

More results...

Generic selectors
Exact matches only
Search in title
Search in content
Post Type Selectors
Search in posts
Search in pages
Search in posts
Search in pages
Log in
Menu
  • Updates & Insights
  • Questions
  • Learning
    • E-learning Courses
    • Empower Replay: Limited Edition
    • Tutorials
    • Open Classroom Training
    • Certification
      • DataMiner Fundamentals
      • DataMiner Configurator
      • DataMiner Automation
      • Scripts & Connectors Developer: HTTP Basics
      • Scripts & Connectors Developer: SNMP Basics
      • Visual Overview – Level 1
      • Verify a certificate
    • Video Library
    • Books We Like
    • >> Go to DataMiner Docs
  • Expert Center
    • Solutions & Use Cases
      • Solutions
      • Use Case Library
    • Markets & Industries
      • Media production
      • Government & defense
      • Content distribution
      • Service providers
      • Partners
      • OSS/BSS
    • Agile
      • Agile Webspace
      • Everything Agile
        • The Agile Manifesto
        • Best Practices
        • Retro Recipes
      • Methodologies
        • The Scrum Framework
        • Kanban
        • Extreme Programming
      • Roles
        • The Product Owner
        • The Agile Coach
        • The Quality & UX Coach (QX)
    • DataMiner DevOps Professional Program
      • About the DevOps Program
      • DataMiner DevOps Support
  • Downloads
  • More
    • DataMiner Releases & Updates
    • Feature Suggestions
    • Climb the leaderboard!
    • Swag Shop
    • Contact
    • Global Feedback Survey
  • PARTNERS
    • All Partners
    • Technology Partners
    • Strategic Partner Program
    • Deal Registration
  • >> Go to dataminer.services

Is it possible to have a dashboard to show multiple interfaces bandwidth aggregated?

Solved1.91K views20th April 2021Dashboards
2
Bruno Sousa [DevOps Member]669 10th December 2020 0 Comments

Hello

Is it possible in the new Dashboard app to show a chart with a trendline that represents the sum of multiple interfaces In (or Out) Bit Rate parameter, for example? How do you advise this to be done?

Thank you.

Best regards

Bruno Sousa

Bruno Sousa [DevOps Member] Selected answer as best 20th April 2021

4 Answers

  • Active
  • Voted
  • Newest
  • Oldest
2
Pieter Van Compernolle [SLC] [DevOps Enabler]3.24K Posted 10th December 2020 6 Comments

Hi Bruno, At his moment, we have stacked charts functionality in Visio. We have an example on our 'https://dcpdma.skyline.be' DataMiner.

Users with a older type of DCP account can already access 'dcpdma.skyline.be' and we are working on giving access to the newer type of (B2C) accounts as well. Please let us know if you would like to have an account to access dcpdma.skyline.be now. 'dcpdma.skyline.be' is the reference platform for many (Visio) use-cases.

Anyway, here's a screenshot already:

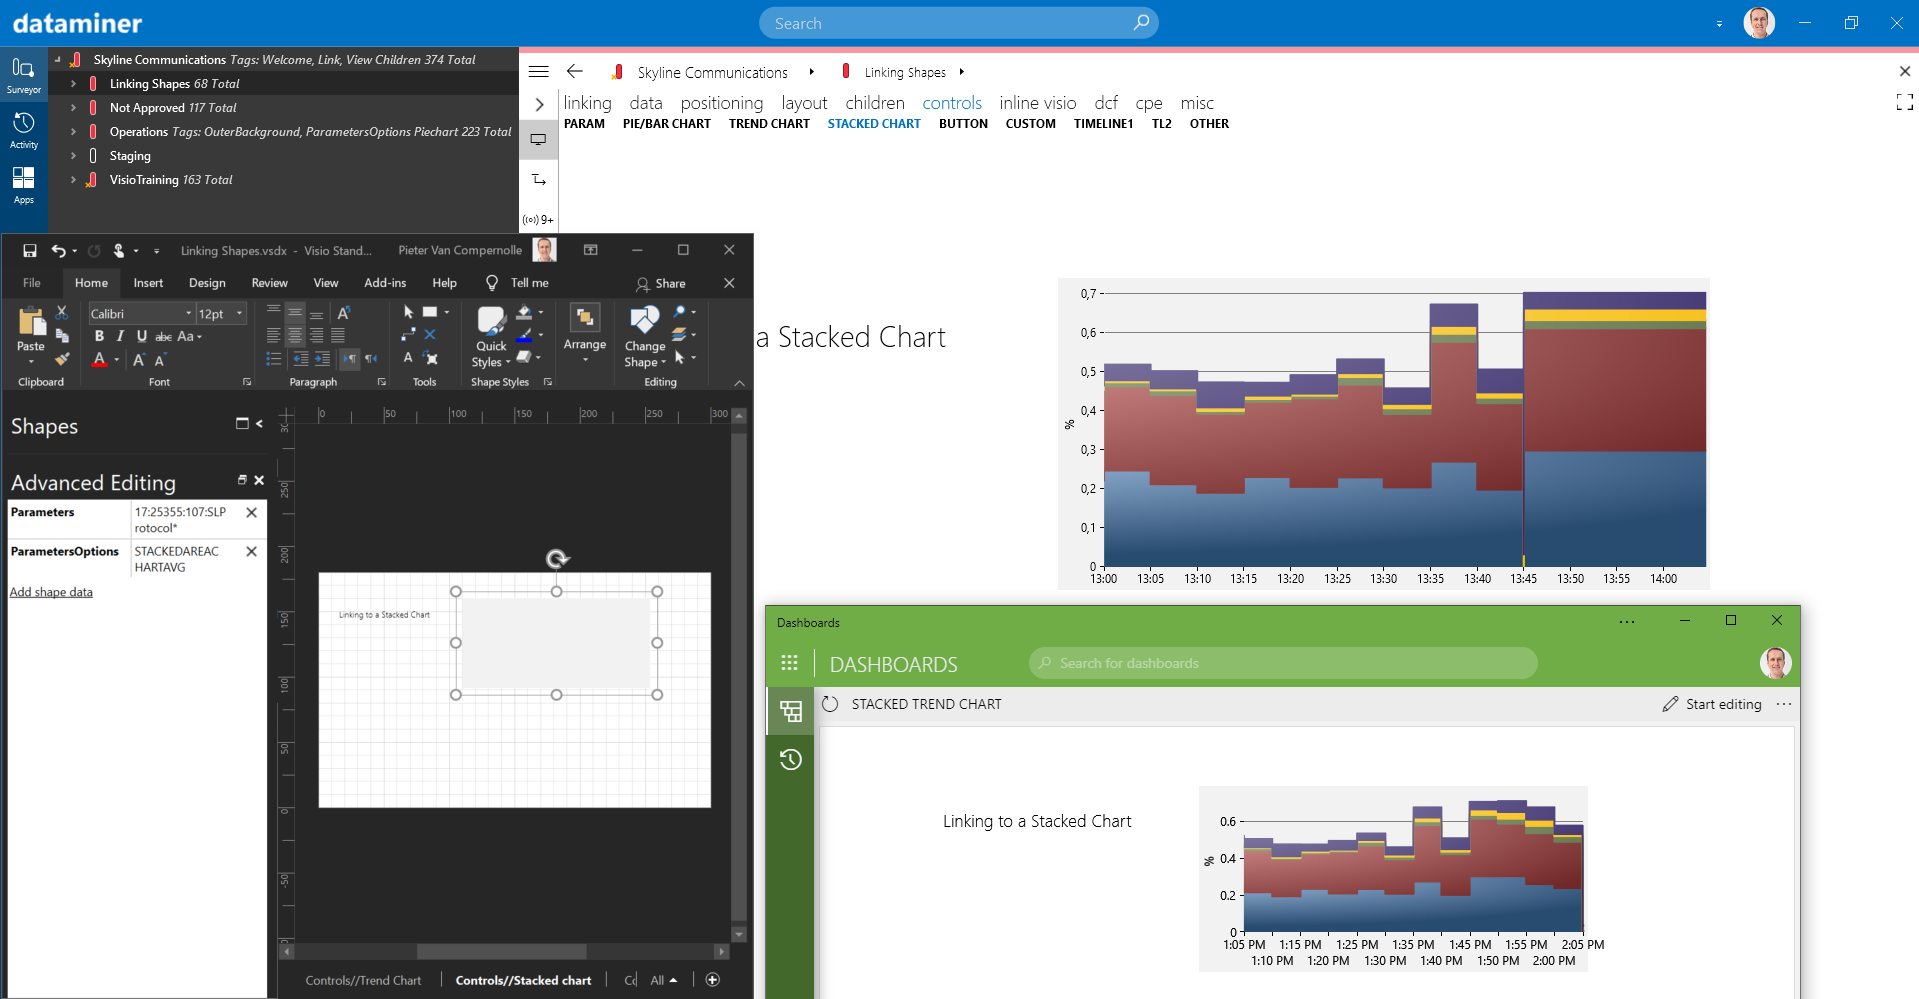
In the screenshot, you can also see the chart in Dashboards. That's because we have a component in our dashboards to embed Visio snapshots. This is not an interactive chart, but it could help for the time being.

We have an internal task in our backlog to support stacked trend lines in dashboards via the trend component. This task just got some extra 'business value' (one of the metrics to sort our tasks), so hopefully we can integrate this in one of our upcoming releases.

Pieter Van Compernolle [SLC] [DevOps Enabler] Posted new comment 4th January 2021
Bruno Sousa [DevOps Member] commented 15th December 2020

Hello Peter.

I’m trying the Visio aproach.

Do you if there is any target date for this component to be available in Dataminer Dashboards?

Thank you.

Best regards
Bruno Sousa

Pieter Van Compernolle [SLC] [DevOps Enabler] commented 15th December 2020

Hi Bruno,
There is no commitment yet on a specific release, but I expect it to be included in one of the 10.1.x feature releases. Feel free to ask for updates on this or to create a duplicate task for this in your own maintenance project, so you can follow the progress on this. You can refer to our internal task with this ID: DCP116400.

Bruno Sousa [DevOps Member] commented 22nd December 2020

Hello Peter,

Since this is a major requirement for a project now, I followed your advice and asked to open a task in my maintenance project so I can stay tuned and sync regarding this implementation.

Regarding the “Stack Chart” in Visio:
1- Do you know if it possible to have the element name and Min, Max, Average Values for the parameters in the chart Legend?

Thank you.

Best regards
Bruno Sousa

Pieter Van Compernolle [SLC] [DevOps Enabler] commented 23rd December 2020

Hi Bruno,
For the charts in Visio, you can enable a legend (more info on how to do this in our user guide: https://help.dataminer.services/dataminer/#t=DataMinerUserGuidepart_2visioCreating_a_parameter_chart.htm)
The format of the legend labels is determined based on what data you bind to your chart. If you bind to parameters from the same element, you’ll see the ‘parameter name’ as legend label. If you bind to one parameter from different elements, then you’ll see the ‘element name’ as label, …
For trend statistics, we have a component in our dashboards, which shows the min, max & average for a certain parameter over a specific time range.

Bruno Sousa [DevOps Member] commented 30th December 2020

Hello Pieter,

I also trying to do the traffic aggregation using an aggregation rule.

I have to aggregate by “Interface Description” but I don’t see an operator other than “Equals” to deal with strings.

Any way to do this?

Thank you.

Best regards
Bruno Sousa

Show 1 more comments
You are viewing 1 out of 4 answers, click here to view all answers.
Please login to be able to comment or post an answer.

My DevOps rank

DevOps Members get more insights on their profile page.

My user earnings

0 Dojo credits

Spend your credits in our swag shop.

0 Reputation points

Boost your reputation, climb the leaderboard.

Promo banner DataMiner DevOps Professiona Program
DataMiner Integration Studio (DIS)
Empower Katas
Privacy Policy • Terms & Conditions • Contact

© 2025 Skyline Communications. All rights reserved.

DOJO Q&A widget

Can't find what you need?

? Explore the Q&A DataMiner Docs

[ Placeholder content for popup link ] WordPress Download Manager - Best Download Management Plugin