Hi All,
When working with parameter feeds in dashboards, I am unsure on how to utilize the "Group by" option on the parameter feed. The following statement is the only explanation I could find for what the option aims to do: "To customize the default way the content of components based on the selector is grouped, in the Default grouping drop-down list, select if grouping should be done by element, parameter, parameter group, etc."
I have been unsuccessful in making the Group by option control the way data is displayed on table components (Pivot table, Parameter table, GQI table)
After reviewing the dashboard learning module where the parameter feed topic was covered, the Group by option appears to work with trend chart components to control how data is displayed on the charts.
Is this setting designed for and expected to only be used for the chart component?
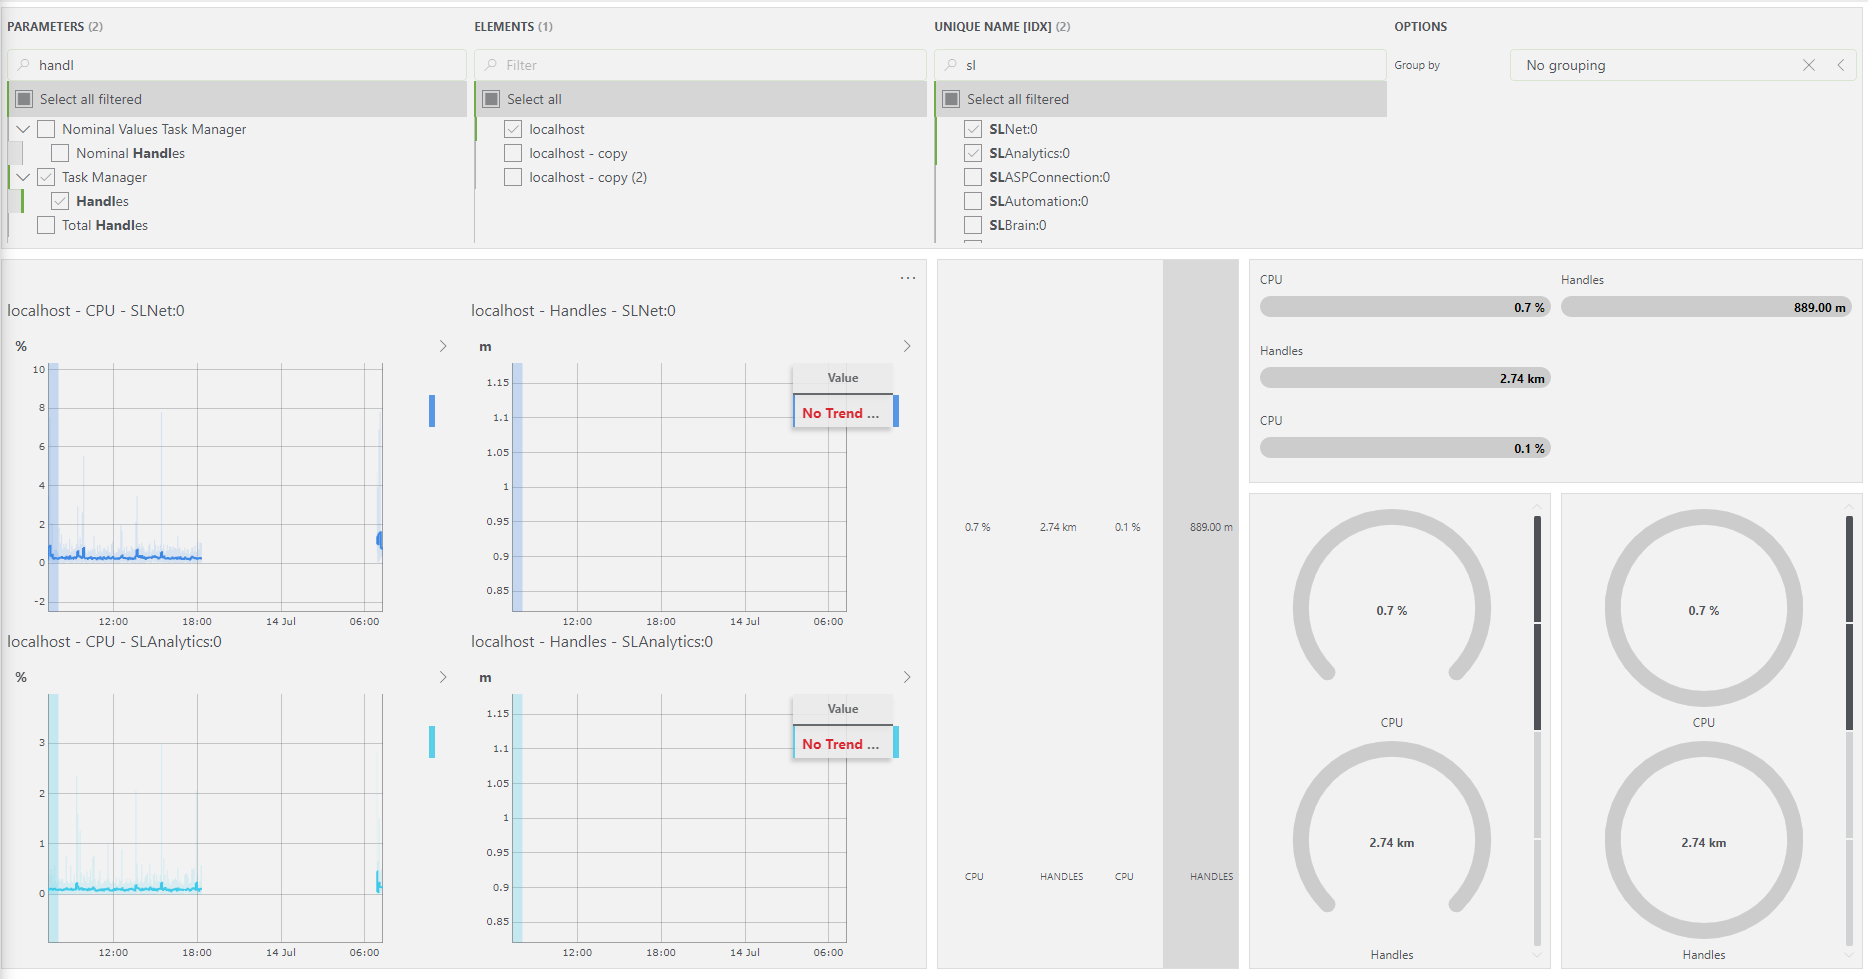
Next to the trend charts, the state visualizations also support this grouping feature.
Note: Be aware that the Group by setting on those components should be set to "No grouping" before the group of the feed can kick in.
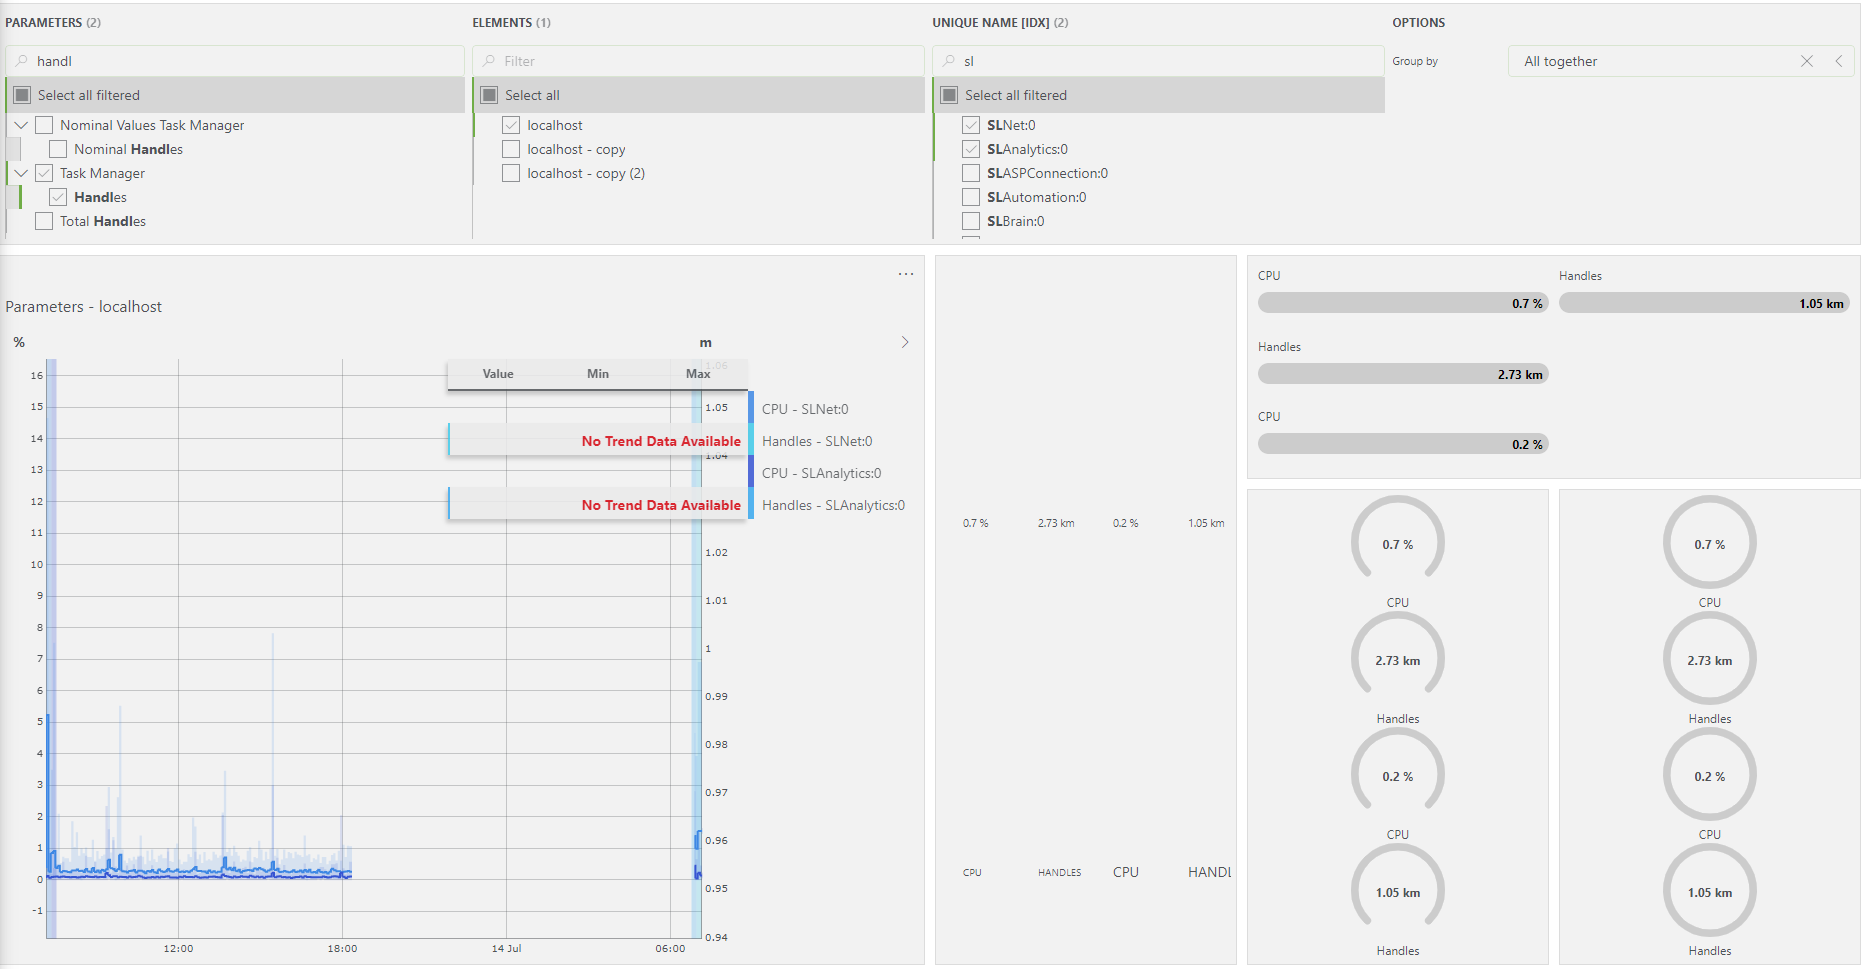
All together
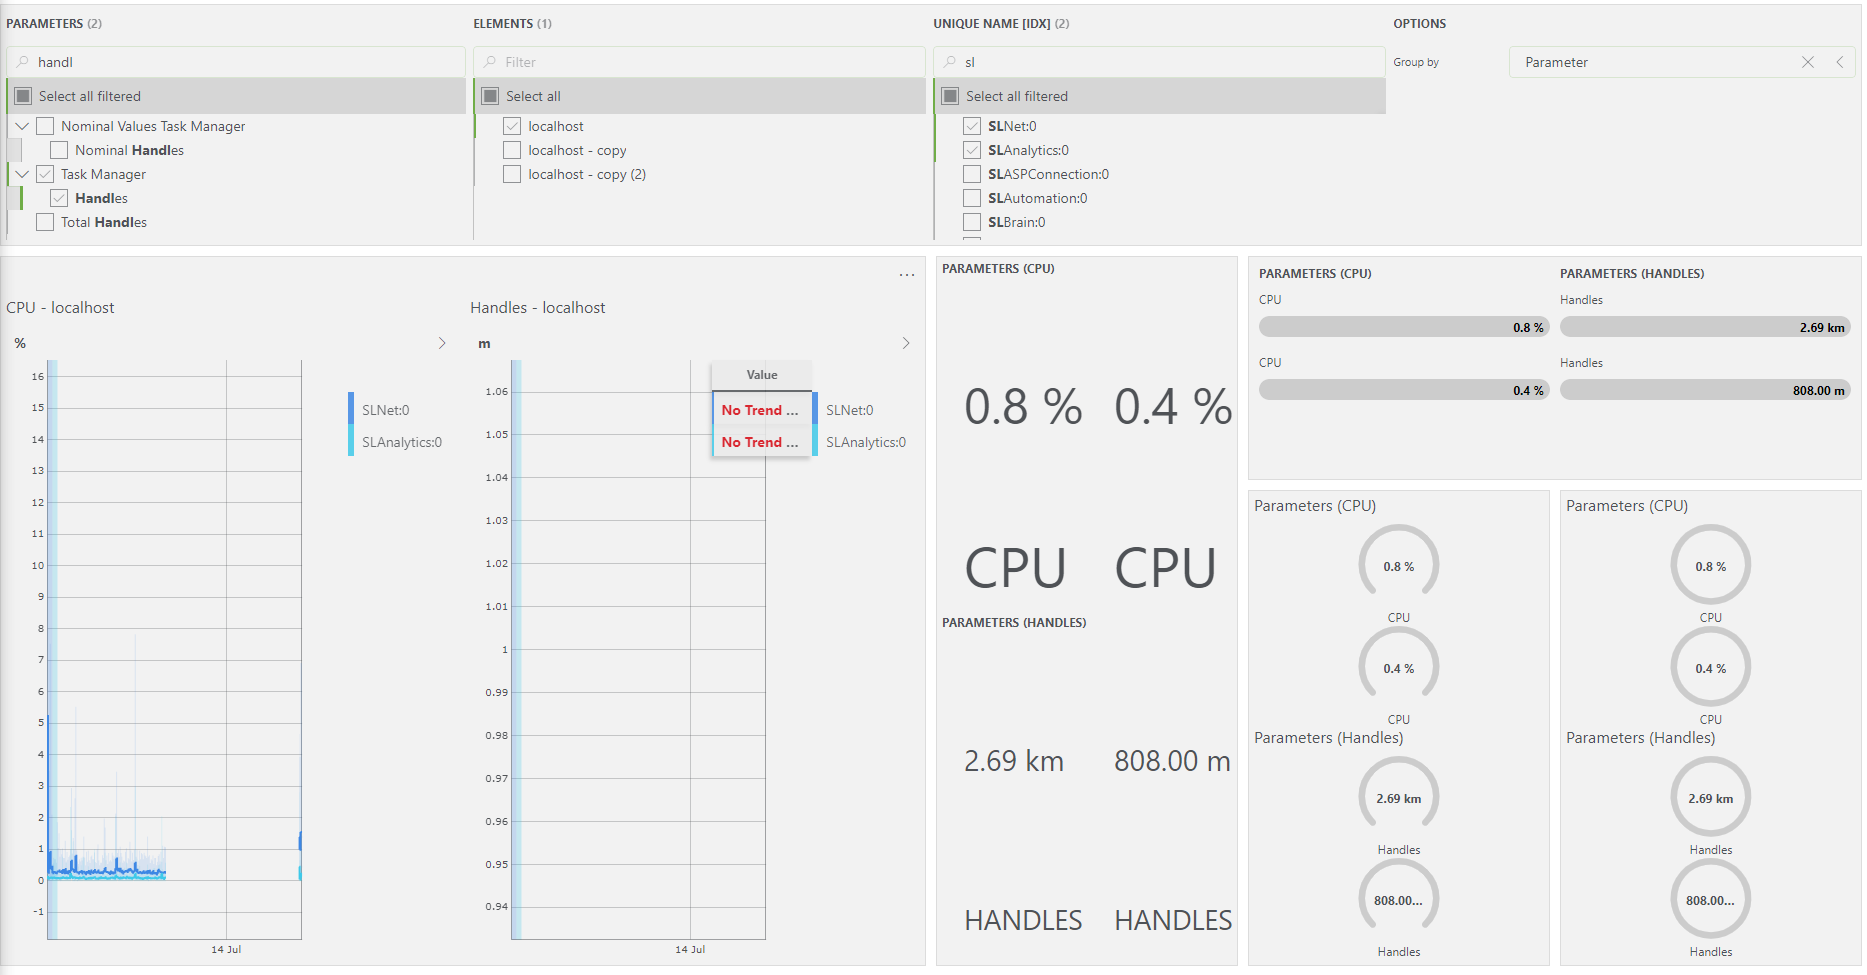
By parameter
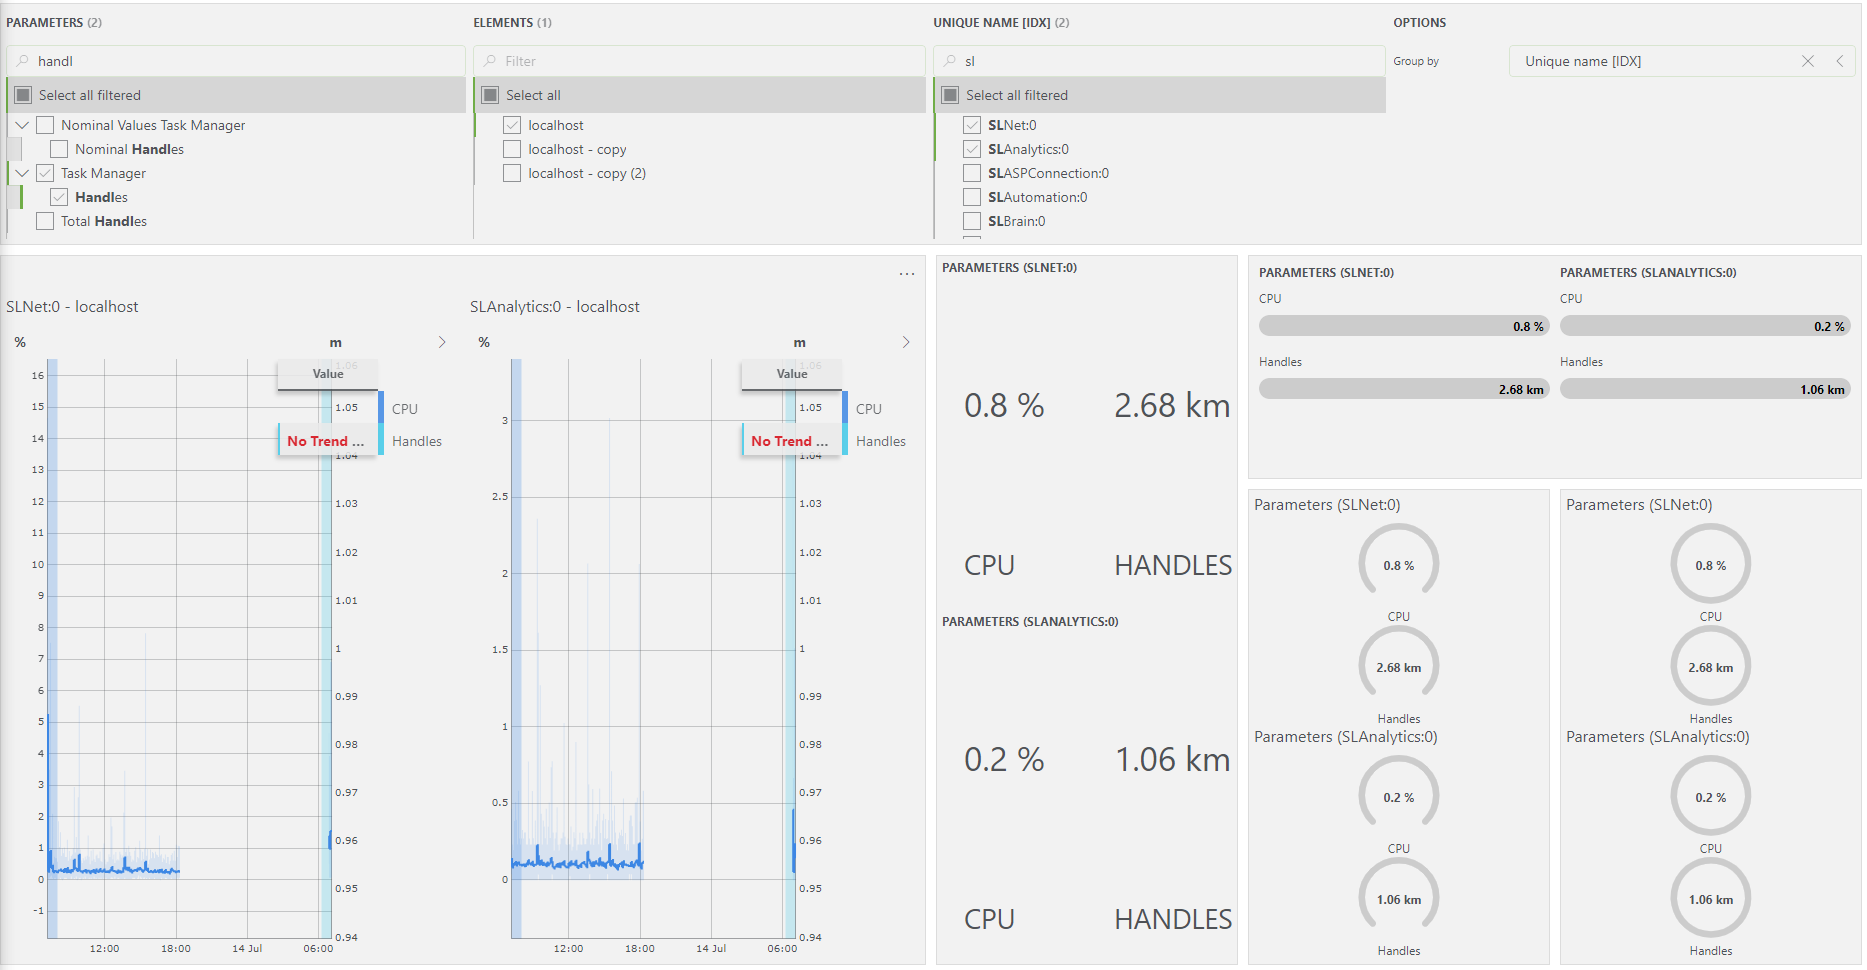
By index
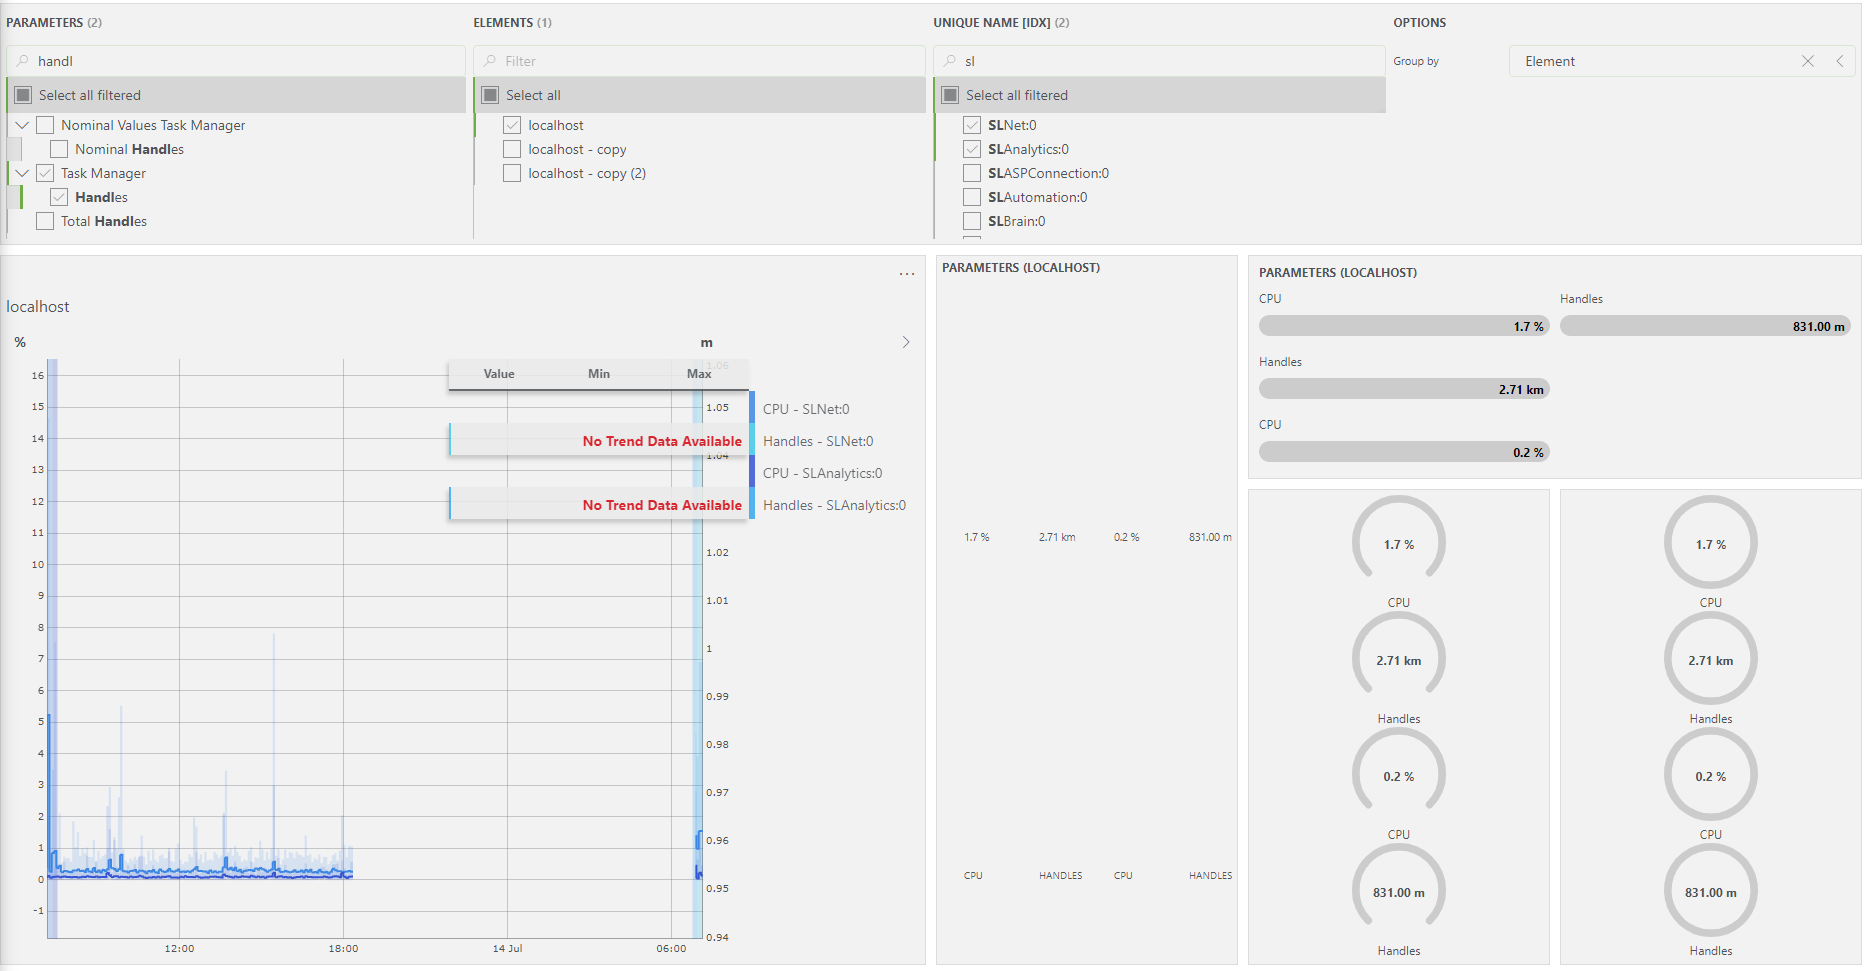
By element
No grouping
Thank you for the information Gilles. It could be useful for others if this information was added to the help docs or if the feed component itself contained information about which visualization components the group by feature is intended to interact with.