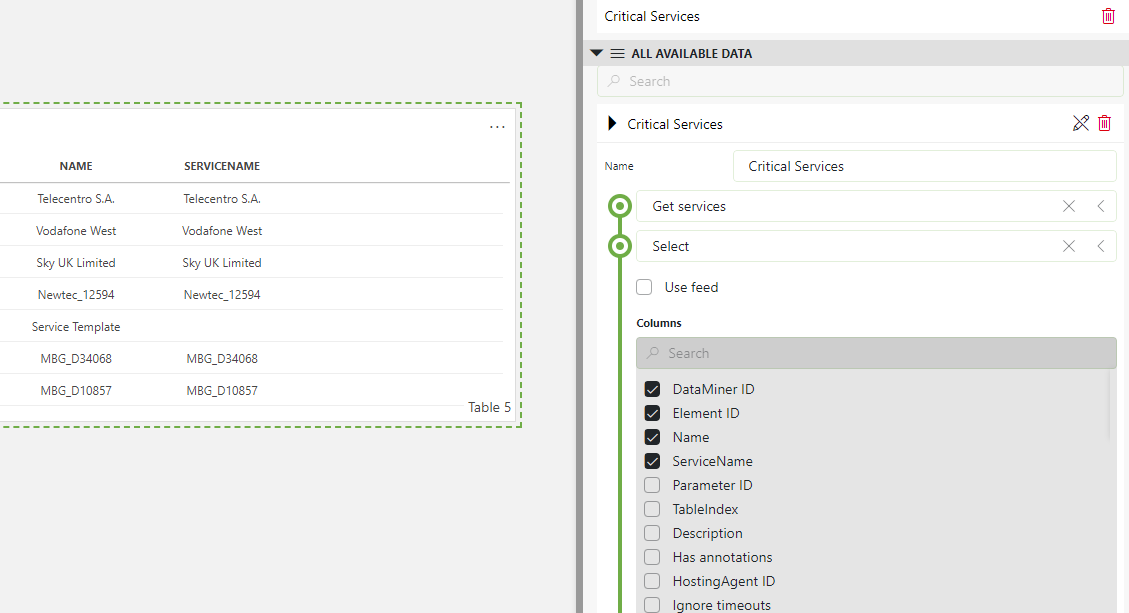
For a specific use case, I need to create a dashboard that could give me a preview of all services in a critical state.
To achieve it, I tried to drag and drop the services and start to play with the associated filters. But none of them allow me to filter by state. I also tried to create a query and returned the services with the critical state.

Again, I can have visibility of all services but I can't access the state of the service.
Any suggestions to be able to implement this visualization via dashboards?
André Camões [SLC] [DevOps Advocate] Selected answer as best
[update]
DataMiner 10.3.3 will come with an extra column 'Alarm state' in your GQI 'Get Views', 'Get Services' and 'Get Elements' data sources.
André Camões [SLC] [DevOps Advocate] Selected answer as best
Awesome! Thanks for the update @Pieter