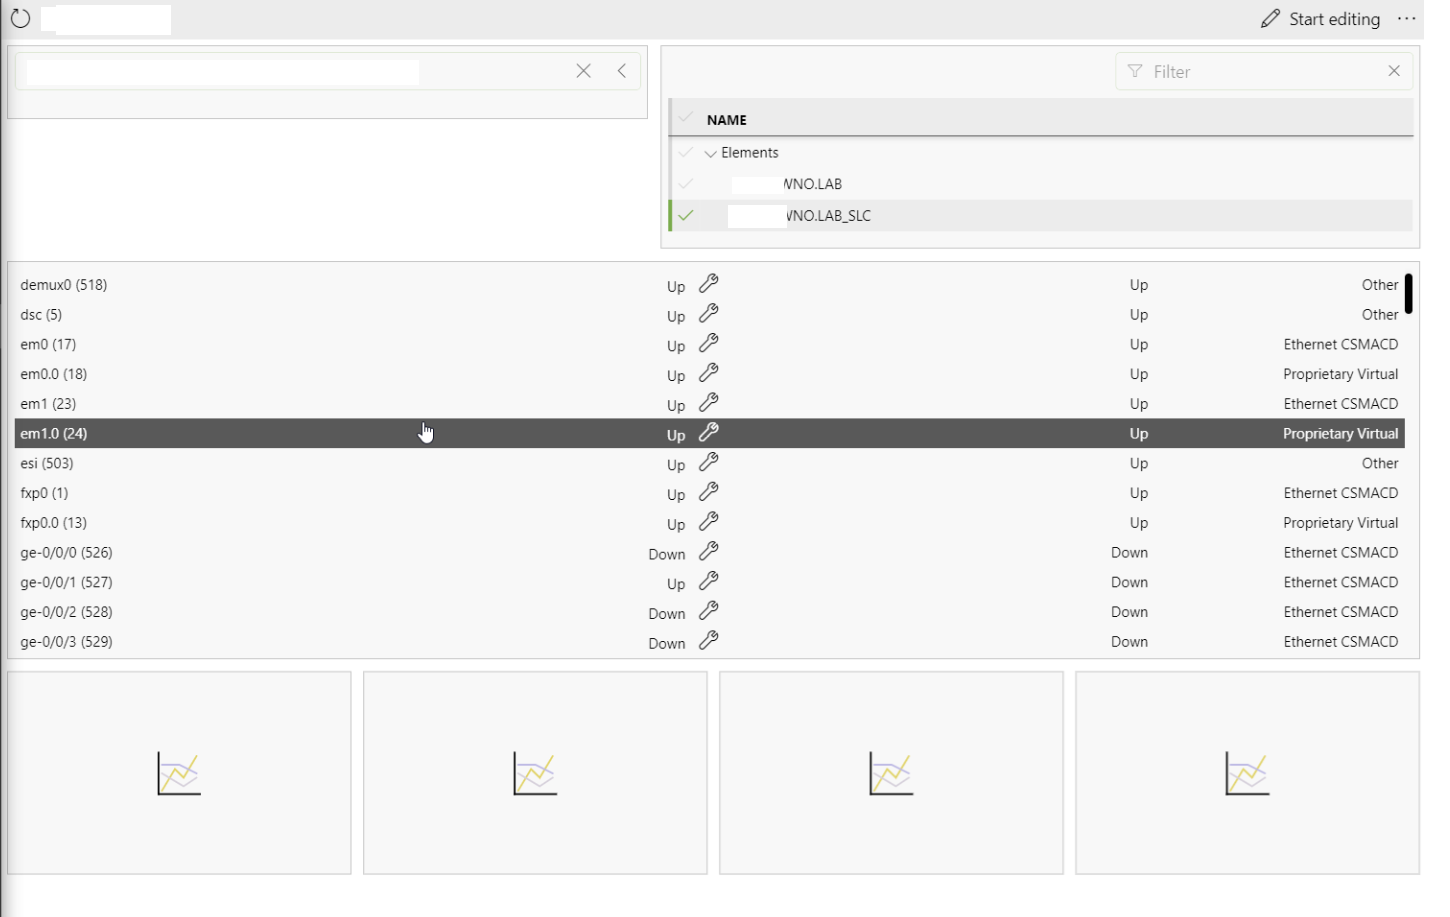
Hi Dashboard enthusiasts! I just started using Dashboards after viewing the available videos on Dojo and Dataminer.tv and I’m using DataMiner Help as a reference. In the attached screenshot, I’m wondering if it is possible to use tables as Feeds? e.g.: based upon the summary info provided in the table, user will click on the respective row to show more information as graphs below.
I’m guessing the answer will be no for the current release; and in that case I’m open to ideas on how I can achieve the same effect with the existing components.
Regarding tables: Is it possible to edit it? (e.g.: adjust row width, center align text, etc)?

Hi Bing,
With the current version you can come close if you add a ‘List’ component (Feeds category) and link it with the Indices from your table (Data/Indices). You will only have one column in your list, being the Keys of your table.
Below this list, you can then set some line chart components (cfr your screenshot) and link those to the column parameters of your table.
As a final step, you then need to link the ‘feed’ Indices as a ‘Filter’ to line chart components (Data/Feeds).
We have a task to extend the parameter table with feeds capabilities (Collaboration (skyline.be)) I’ll extend it with your use-case.
Thanks Pieter for the suggestion. I’ll try to build upon that. And the added info on current Dashboard tasks is much appreciated.