Hi Dojo,
When I open, for example, the trend graph of the Total Processor Load of a Microsoft platform element and change the y-axis from auto range to a manual range (e.g., from 0 to 50), the change is initially applied correctly in the graph.
However, if I close the graph and then reopen it, the manual range is no longer applied, it seems to reverts to the default range defined in the protocol.
This makes me wonder if this setting is supposed to be stored? And if so, where are these settings saved?
Hi Catarina,
Y-axis settings on a trend graph in Cube are not saved or stored somewhere. You can set a predefined user setting whether the scaling is done automaticcaly or not based on the data.
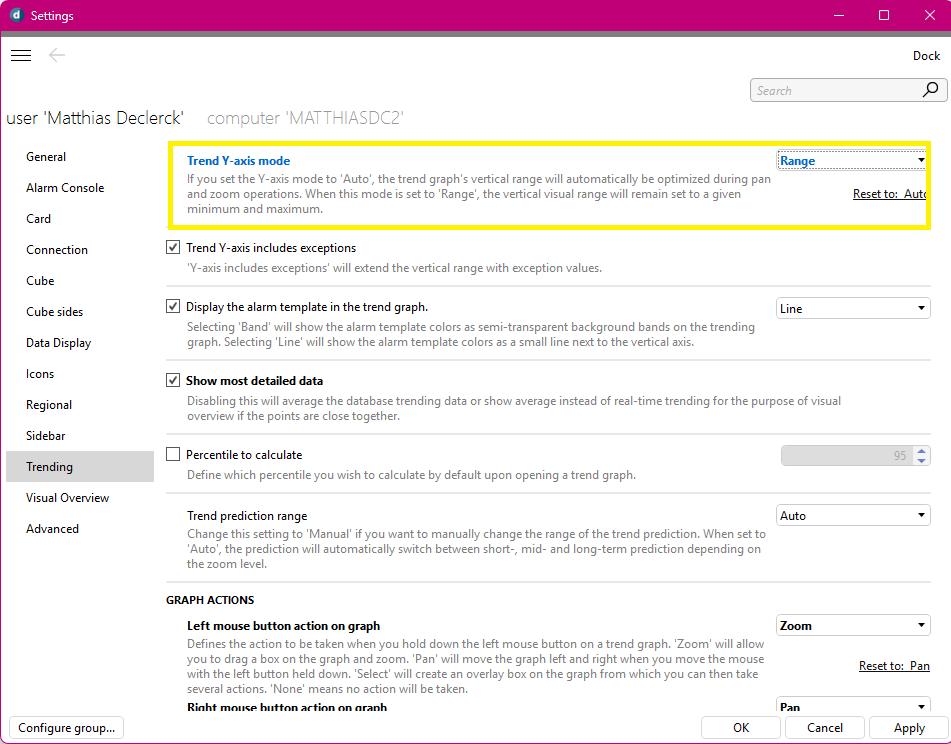
The values of the settings are part of the graph itself. This is intended and expected behavior. Any parameter curve can be added or removed on each graph, which make it possible to have same data in different graphs.
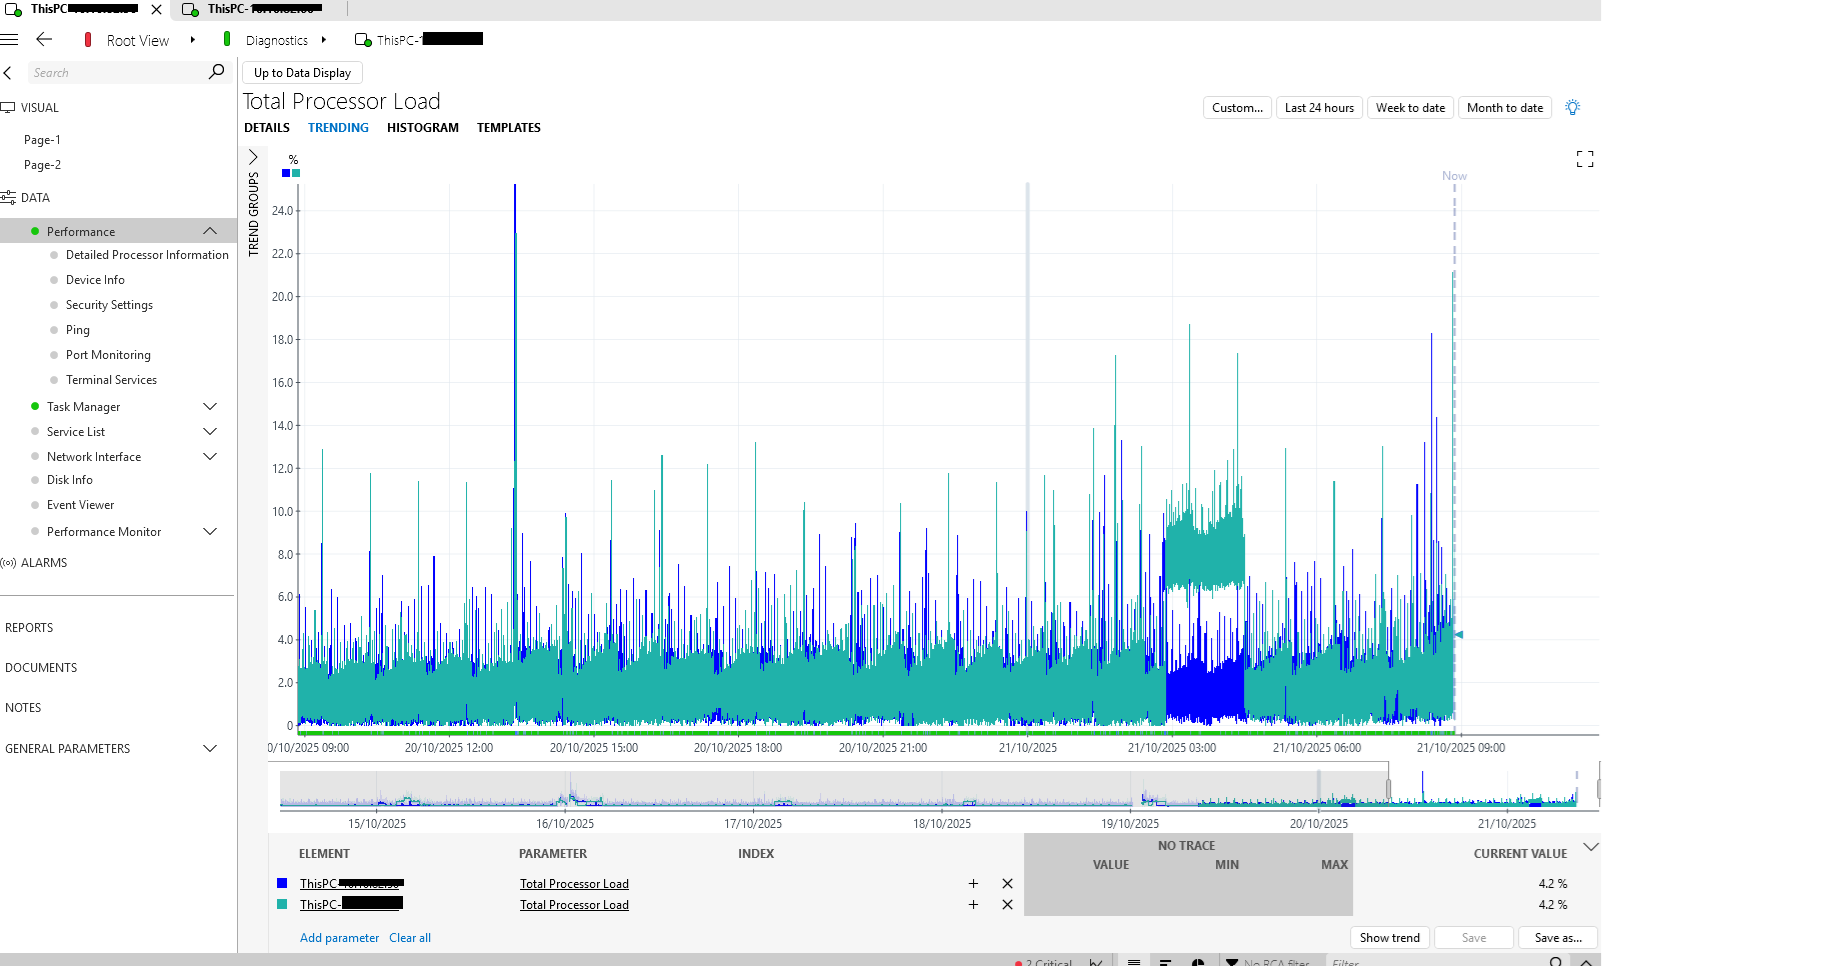
Example:
 hI hope this help you further