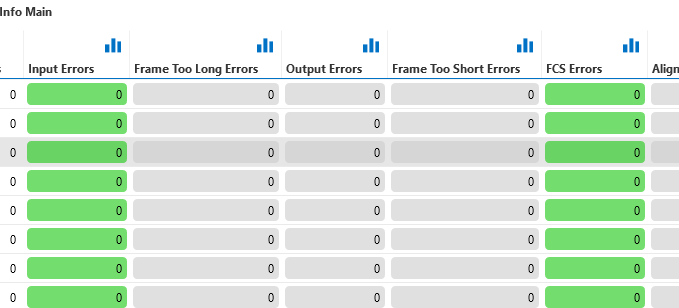
I want to represent alarm information for a specific column in a single shape.
Is it possible to change the color of one shape when,
an FCS Error in Eth1 or an Input Error in Eth3 is output?
I would like to group all the interfaces and error counts of the network switches because it is difficult to understand the screen if we represent all the interfaces and error counts.
Colors in accordance with the alarm template when any one of the statuses is above warning.

It is possible to link a shape to the summary alarm state of one/multiple table row(s) or an entire table column in the following way (see Help).
One or more rows
The maximum alarm level for one or more rows can be shown in a parameter summary shape. The example below selects all rows where the primary or display key starts with “SL”. Defining an exact match for the row will select a single one.
ID ‘500’ represents the table PID.
ParametersSummary Max|101/201:500:SL*|Alarm
One column
The maximum alarm level can be calculated for an entire column.
The example below selects all cells for column with PID ‘501’.
ParametersSummary Max|101/201:501|Alarm
It was the syntax I wanted.