One of the most intriguing aspects of network management is finding out exactly what’s going through your network. You know that multiple protocols are traveling across your network, but what exactly is the relationship between them, percentage-wise? How much is HTTP or DNS? Which systems are the biggest talkers or listeners? …
There’s a lot of valuable information there. But what’s the easiest way to get all this information in the form of a bite-sized and actionable overview?
The answer: flow export protocols!
In this blog post, we’ll tell you all about easy flow management through flow export. Don’t feel like reading? Just watch Laurens and Rui’s quick and easy explanation video on monitoring network flows.
Why you should use flow export
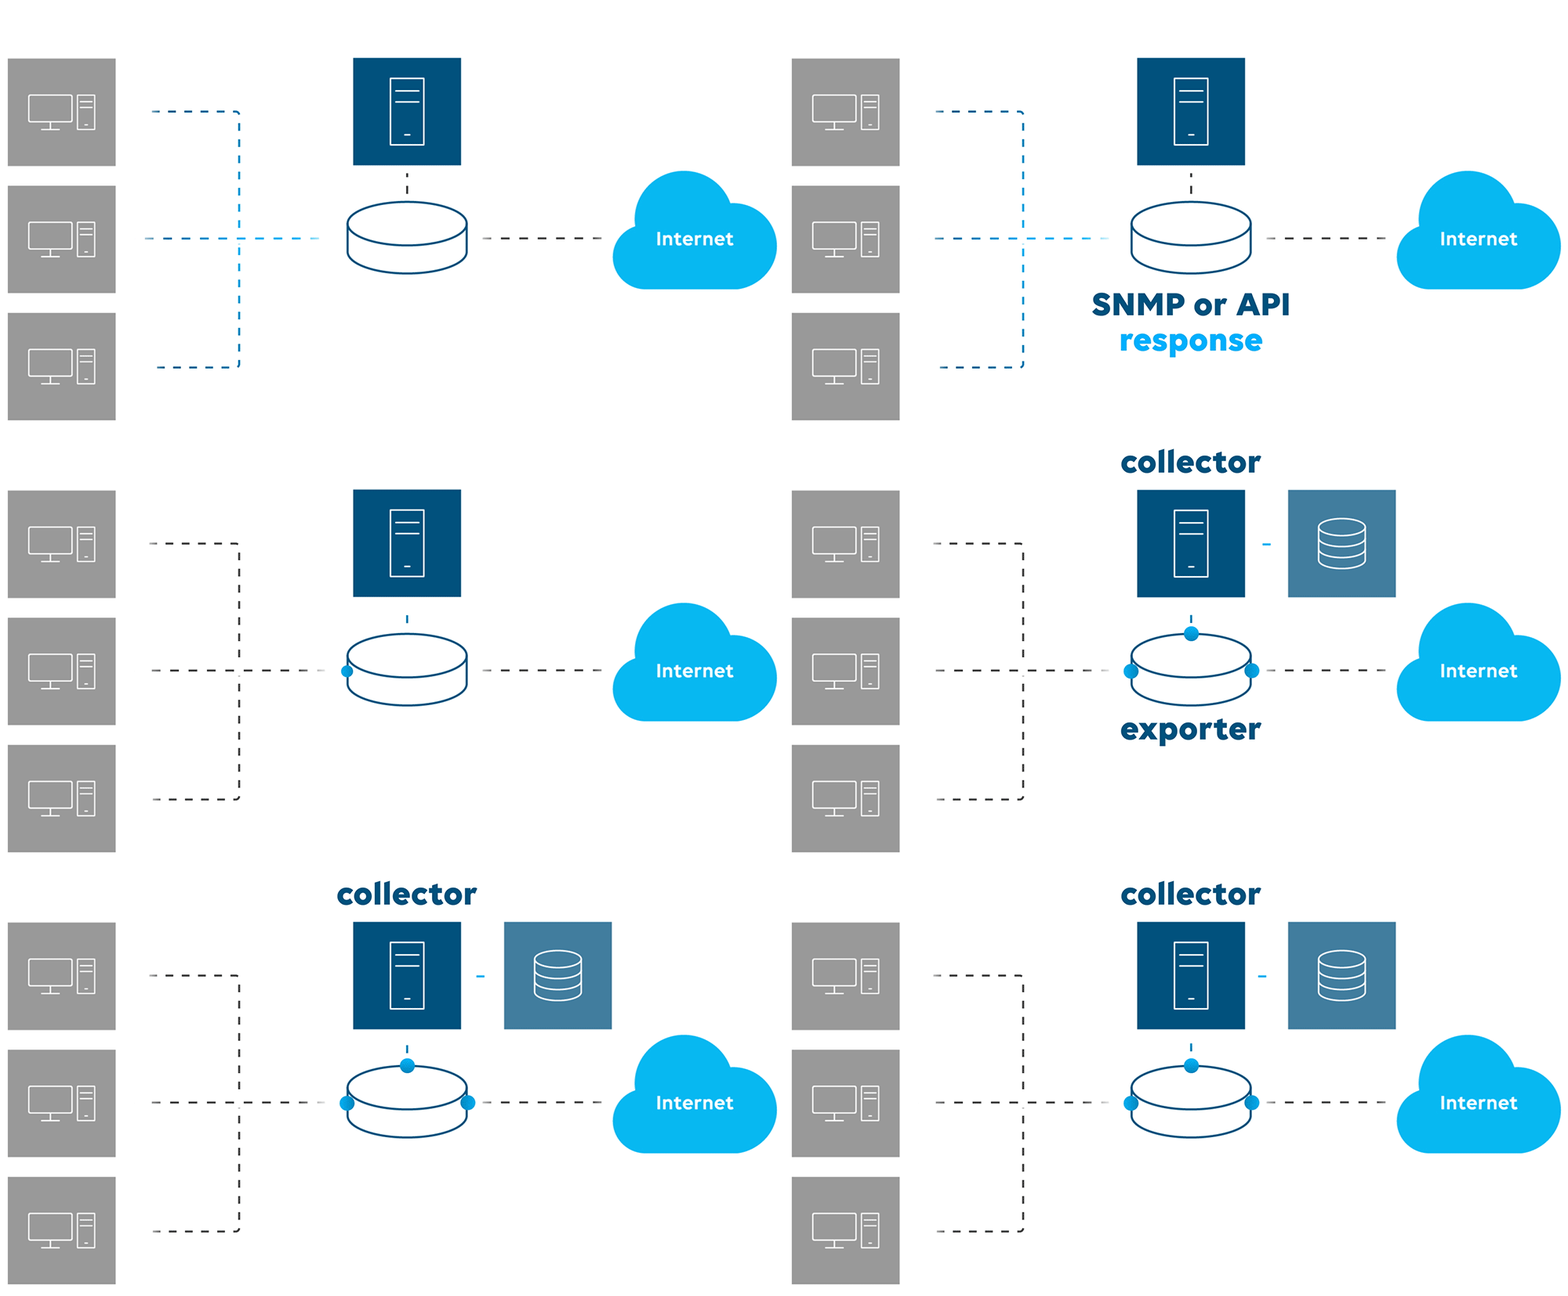
In traditional network monitoring, you would actively request information from a network device using SNMP or API calls. However, when you serve multiple clients simultaneously overhead will start increasing, and during heavy traffic it might even cause the equipment to drop some requests.
So, for high-network traffic monitoring and analysis, flow export is the way to go.

How does flow export work?
First, network traffic information is collected with an agent as it enters or exits a network device interface. That information is then exported towards a collector.
A collector is a piece of software, typically running somewhere in the network, that’s responsible for receiving and storing IP traffic records from an exporter, which is running on the product itself.
Finally, an analysis application will fetch traffic information and generate insightful graphs and charts giving a breakdown of the different protocols. This way you can easily profile the traffic and detect suspicious network behavior.
How is the network information exported?
There are two main types of network flow export protocols:
- Protocols that aggregate IP traffic information into flow records, like Netflow.
- Protocols that sample IP traffic information, like sFlow.
So, what’s the difference? And which one should you use?
NetFlow – aggregation of network traffic
NetFlow, Cisco’s proprietary technology, aggregates packets into flow records. These records are then pushed to a collector for storage and analysis.
Flow records are a unidirectional sequence of packets containing fields like source and destination IP address, IP protocol, UDP and TCP ports and type of IP service.
However, supported network equipment tends to export a flow record only when it determines that the flow is finished. This means that the network traffic that you’re analyzing is not necessarily real-time.
Furthermore, records are usually exported via UDP. And since version 8, NetFlow can aggregate a lot of data into a single flow record. So, if a NetFlow packet gets lost or corrupted on its way to the collector, all its contained records will be lost forever, especially because a router, for example, doesn’t remember records that were already exported.
sFlow – sampling of network traffic
sFlow, short for sampled flow, doesn’t know of flows or packet aggregation at all. Instead, it allows for exporting samples of truncated packets.
Not only does this make it scalable and applicable for high-speed networks and high-bandwidth backbones, but it also makes the traffic analysis approximating real-time.
sFlow achieves this in two ways: random sampling and time-based sampling. The former randomly takes one out of a number of packets. The latter does it based on a polling interval. This is still more efficient than SNMP when monitoring many interfaces.
Like Netflow, the data is sent as UDP. But the loss of packets results only in a slight reduction of the sampling rate without affecting the accuracy of measurements too much.
NetFlow and sFlow are some of the most prevalent protocols and are supported by many products from different vendors. But there are also vendor-specific equivalent protocols: NetStream for HP and Huawei, Cflowd for Nokia, etc.
How can you easily analyze all this data?
Once the collector has received the information from the exporter, the flow analyzer processes this information so it can be presented to the user in an easy and intuitive way.
Scrutinizer and SolarWinds are two of the most popular analyzer tools in the market right now.
Plixer Scrutinizer
Scrutinizer supports Netflow, Sflow, J-Flow, NetStream and IPFIX. It’s marketed more as a full Incident Response System by analyzing the network traffic to report on security issues. It can be deployed as hardware, VM or as Software as a Service (SaaS).
SolarWinds Traffic Analyzer
The SolarWinds Traffic Analyzer supports Netflow, SFlow, J-Flow, IPFIX and NetStream. It’s designed to identify which protocol addresses or applications consume the most bandwidth. It analyzes patterns in traffic and performs network forensics.
DataMiner Flow Monitoring for media operations
The DataMiner Flow Monitoring app also integrates flow export protocols, not just to analyze network performance, but also to align it towards media services management. This is accomplished by monitoring IP multicast streaming and monitoring the control plane in general.
So, the DataMiner Flow Monitoring app is more than just an analyzer: it also combines all the diverse data and feature sets available in the DataMiner System to allow easy management and investigation of any potential problems related to the media flows.
Want to learn more about the DataMiner Flow Monitoring app? Discover the DataMiner Flow Monitoring app use case.
Please note that you need to be logged in to access our use cases:
in the top corner of the screen, click LOG IN and authenticate yourself with your corporate email address.
Thanks very much Rui and Laurens! Have a look at our Telemetry / Flow Monitoring expert hub for more information: https://community.dataminer.services/expert-hub-openconfig/