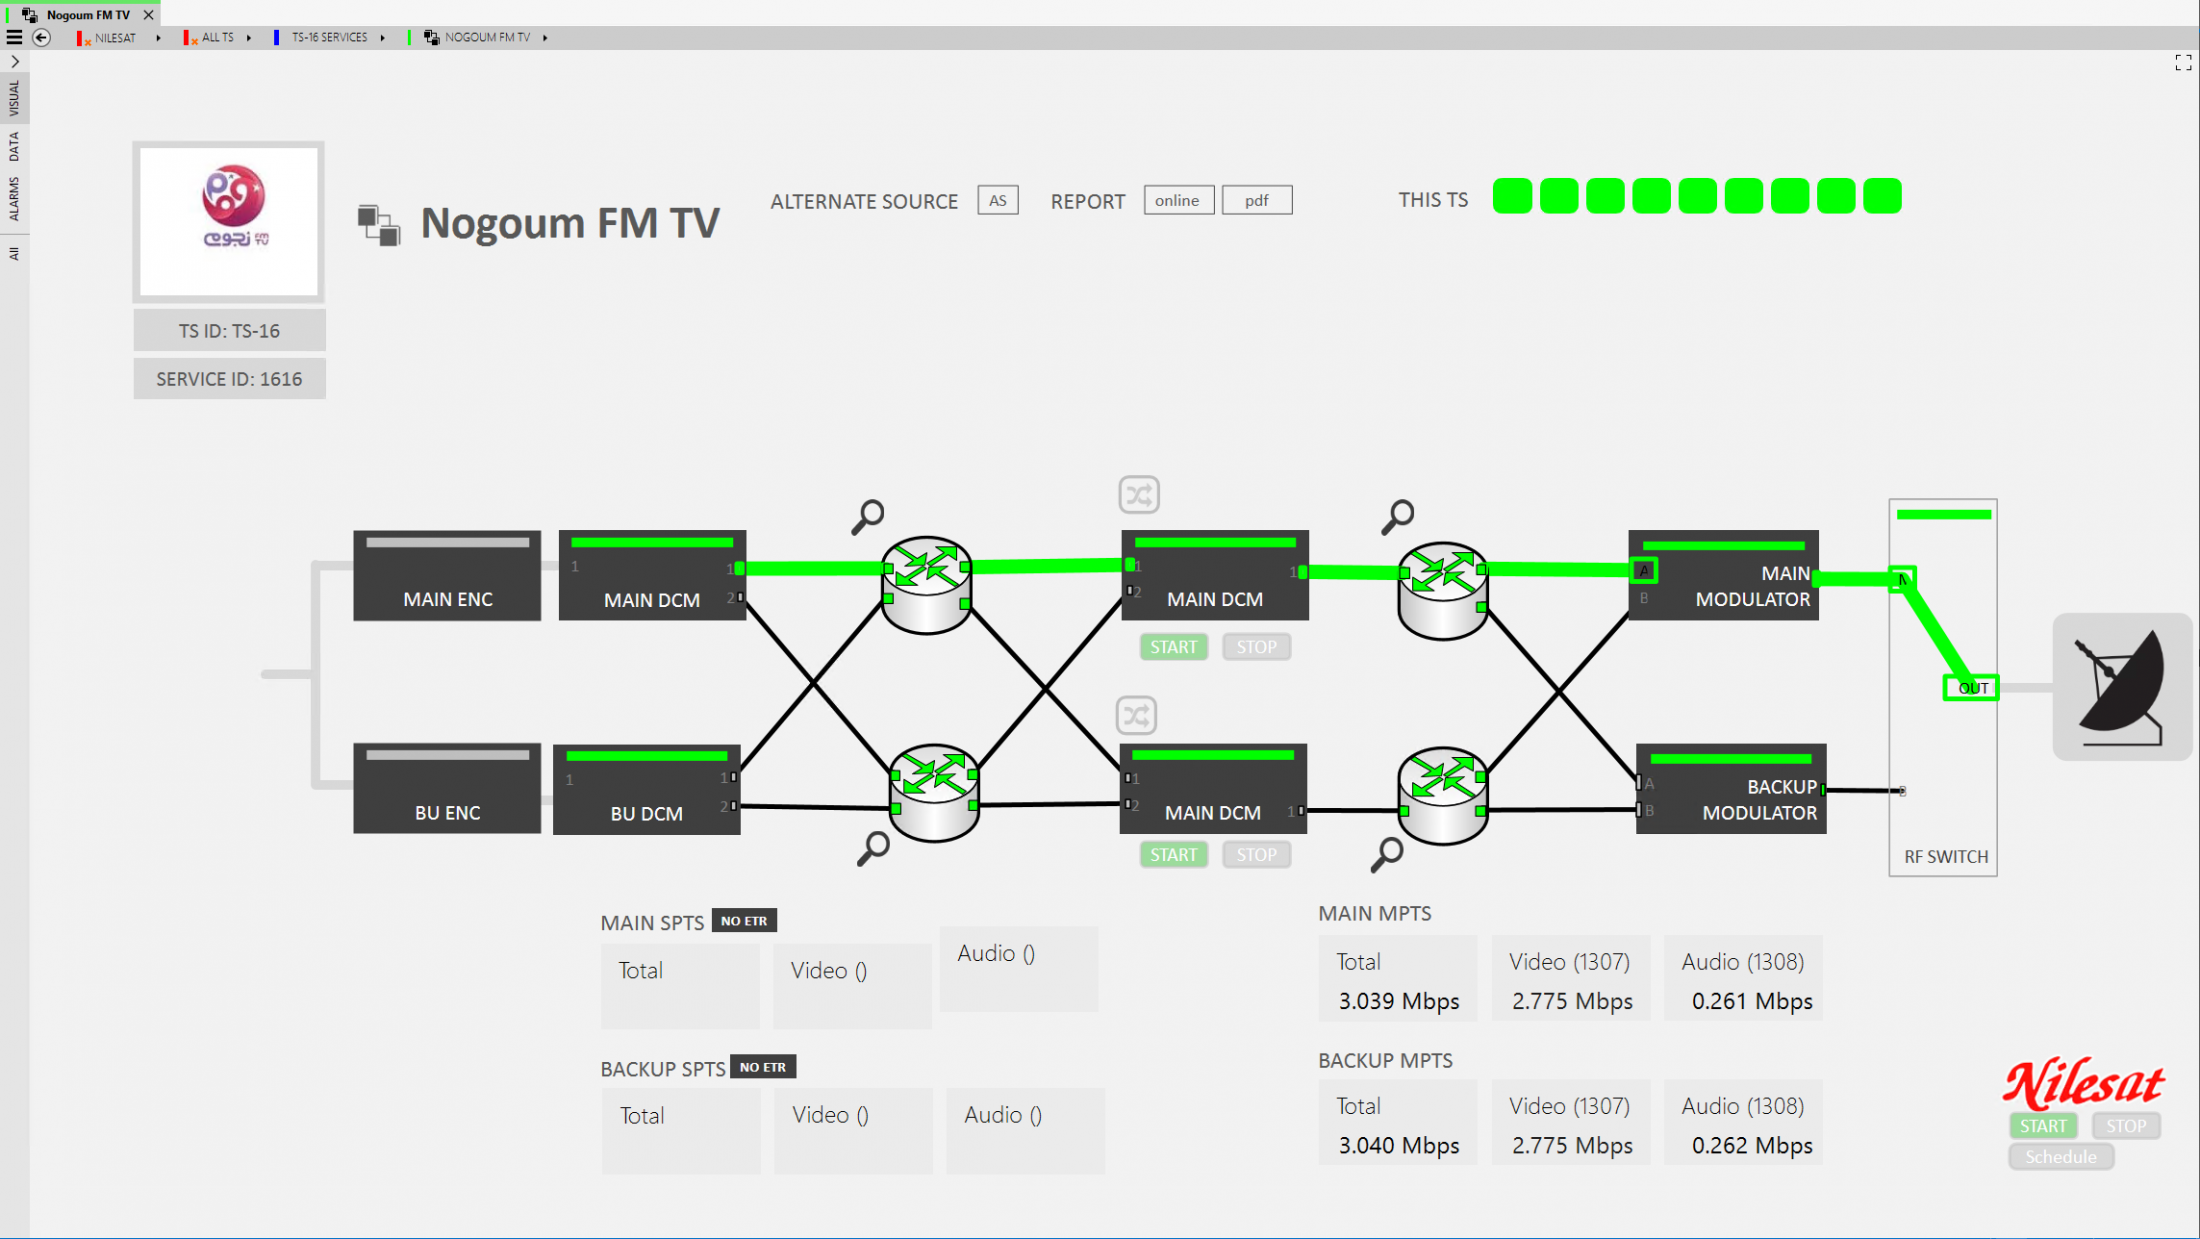
Service Chain
10th August 2020
10th August 2020
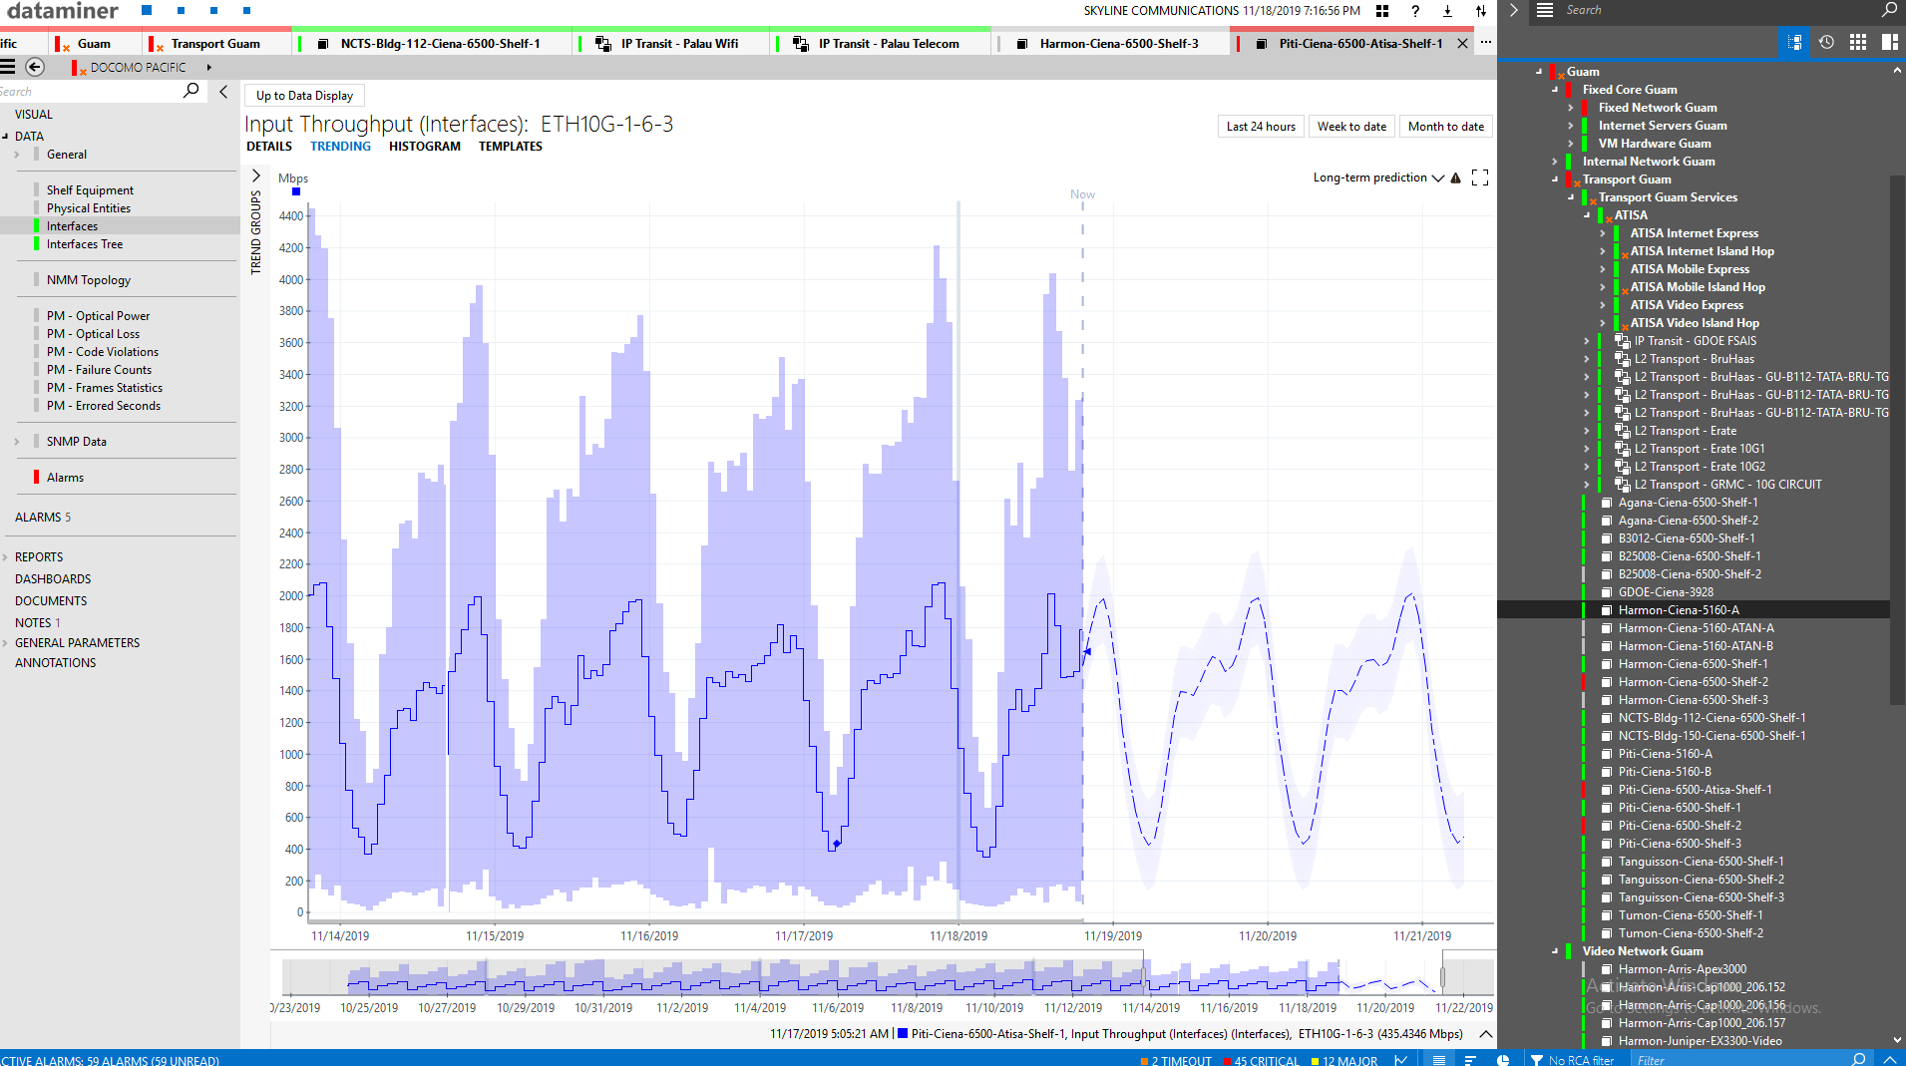
Trend display showing time series for Input Throughput on a Ciena switch, with long-term prediction by DataMiner based on autonomous learning (dashed line).
Album: DataMiner Forecasting
10th August 2020
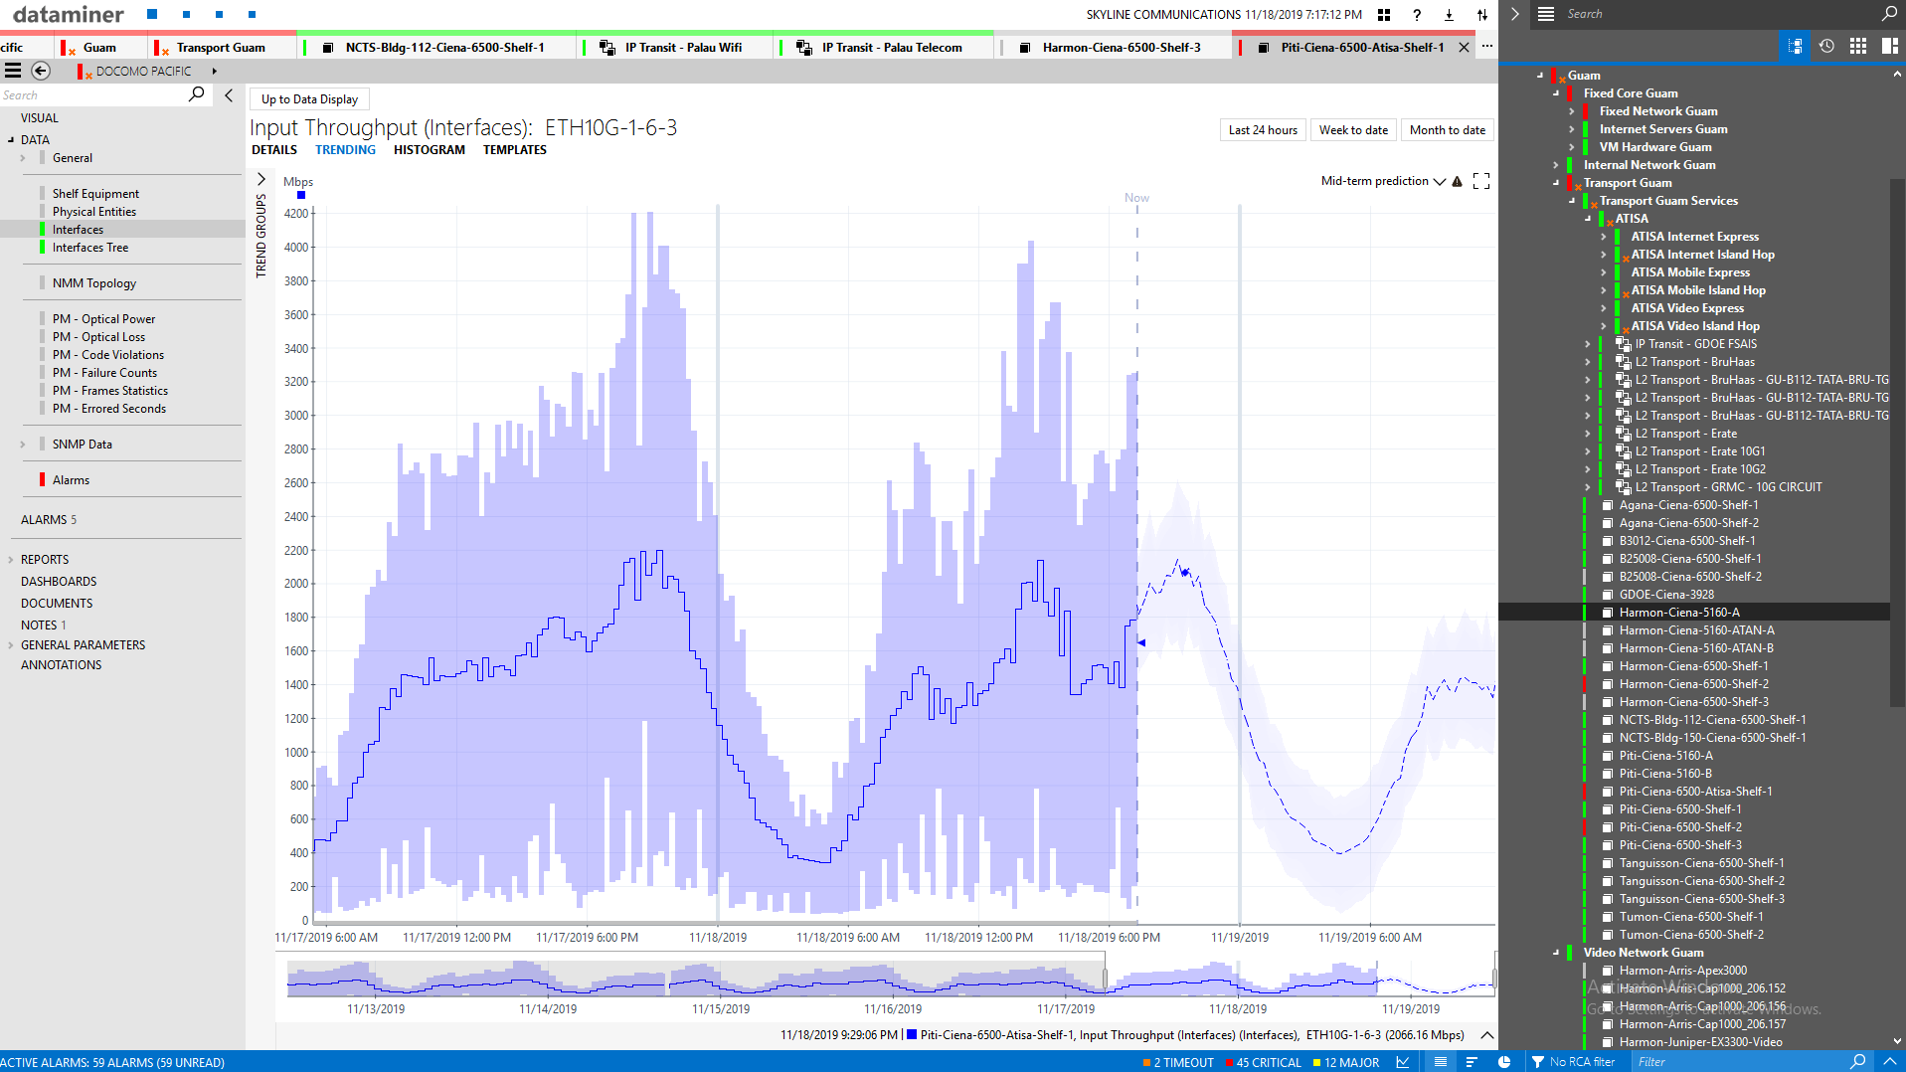
Trend display showing time series for Input Throughput on a Ciena switch, with mid-term prediction by DataMiner based on autonomous learning (dashed line).
Album: DataMiner Forecasting
10th August 2020
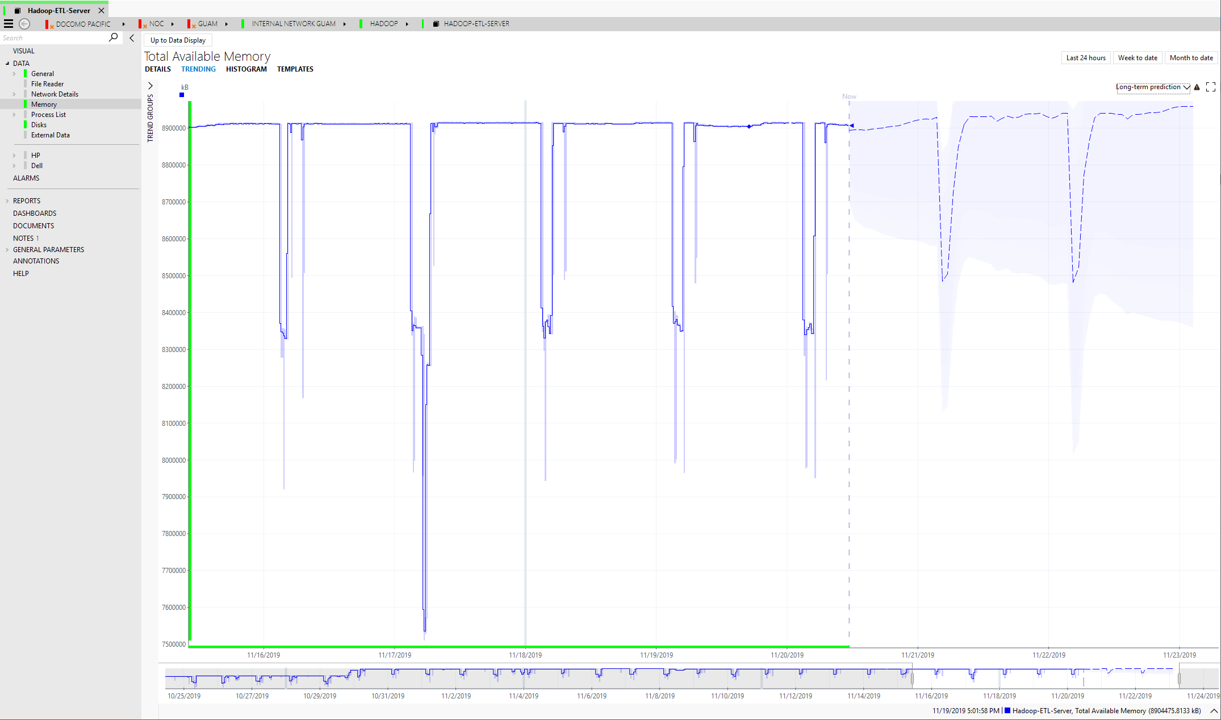
Trend display showing time series for Total Available Memory on a HADOOP server, with long-term prediction by DataMiner based on autonomous learning (dashed line). Note the 24-hour periodicity and steady general increase forecasted.
Album: DataMiner Forecasting
10th August 2020
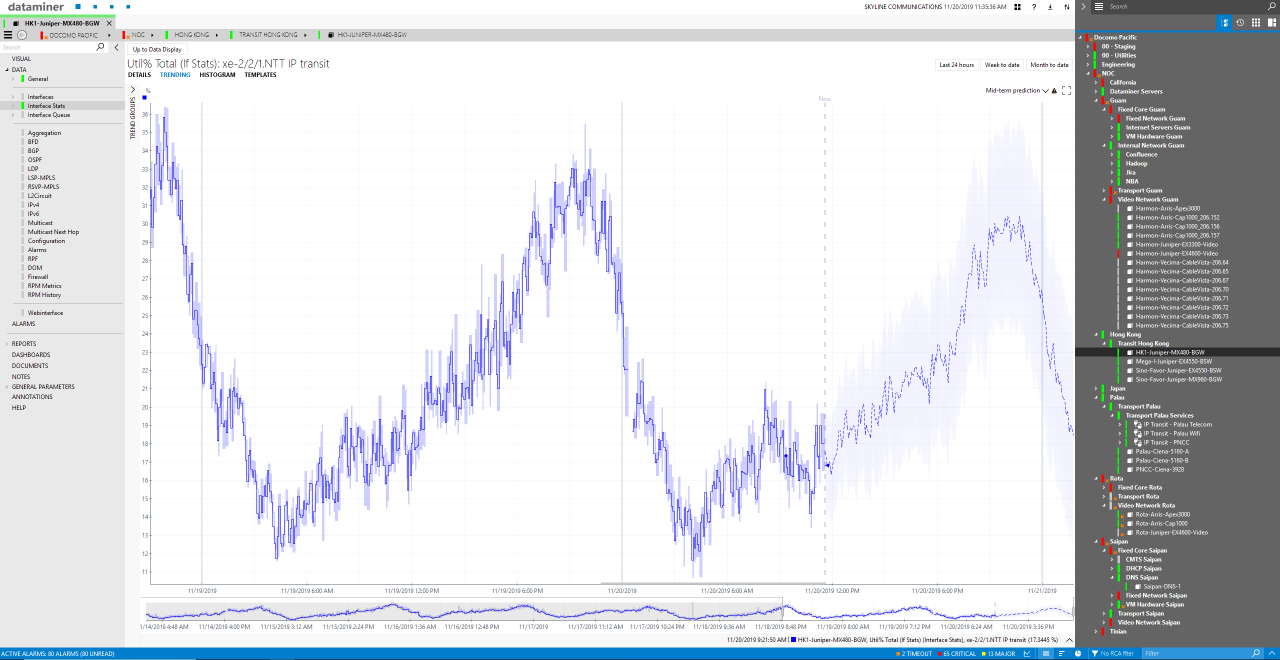
Trend display showing time series for % Interface Utilization on a Juniper port, with mid-term prediction by DataMiner based on autonomous learning (dashed line). Note the detail on the recurring daily pattern, combined with an overall slightly lower traffic level predicted as compared to previous day.
Album: DataMiner Forecasting
10th August 2020
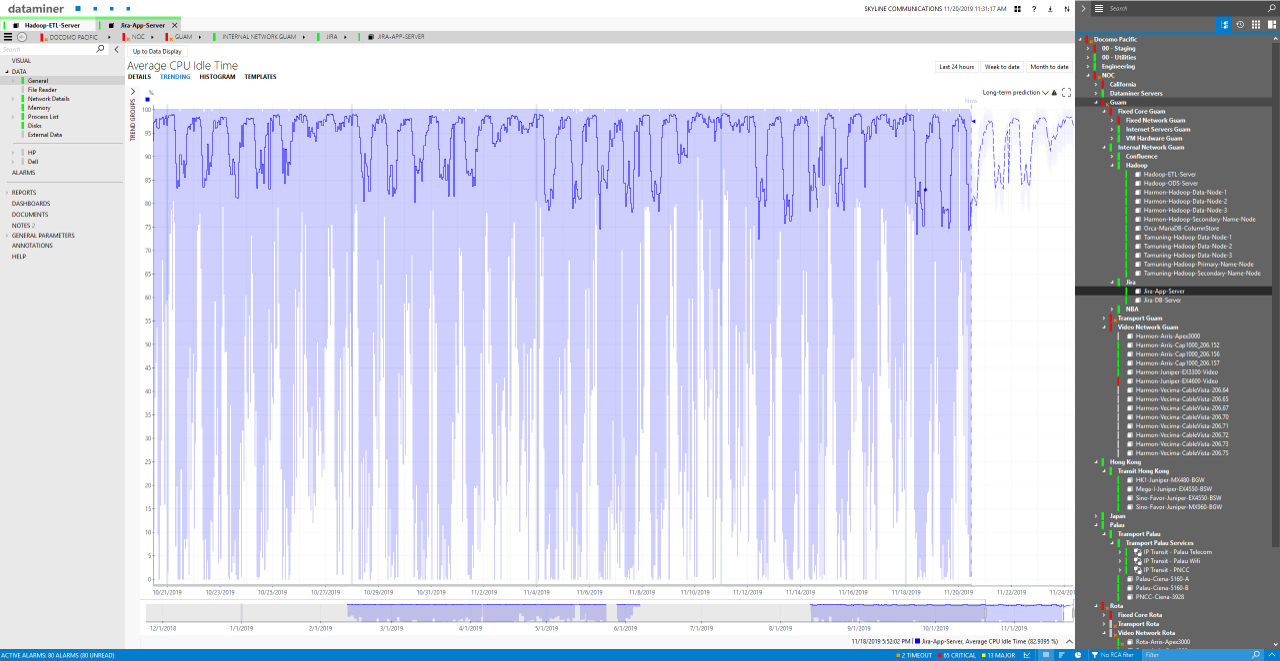
Trend Display showing time series for CPU Idle Time on a JIRA App server, with long-term prediction by DataMiner based on autonomous learning (dashed line). Note the multiple periodicities.
Album: DataMiner Forecasting
10th August 2020
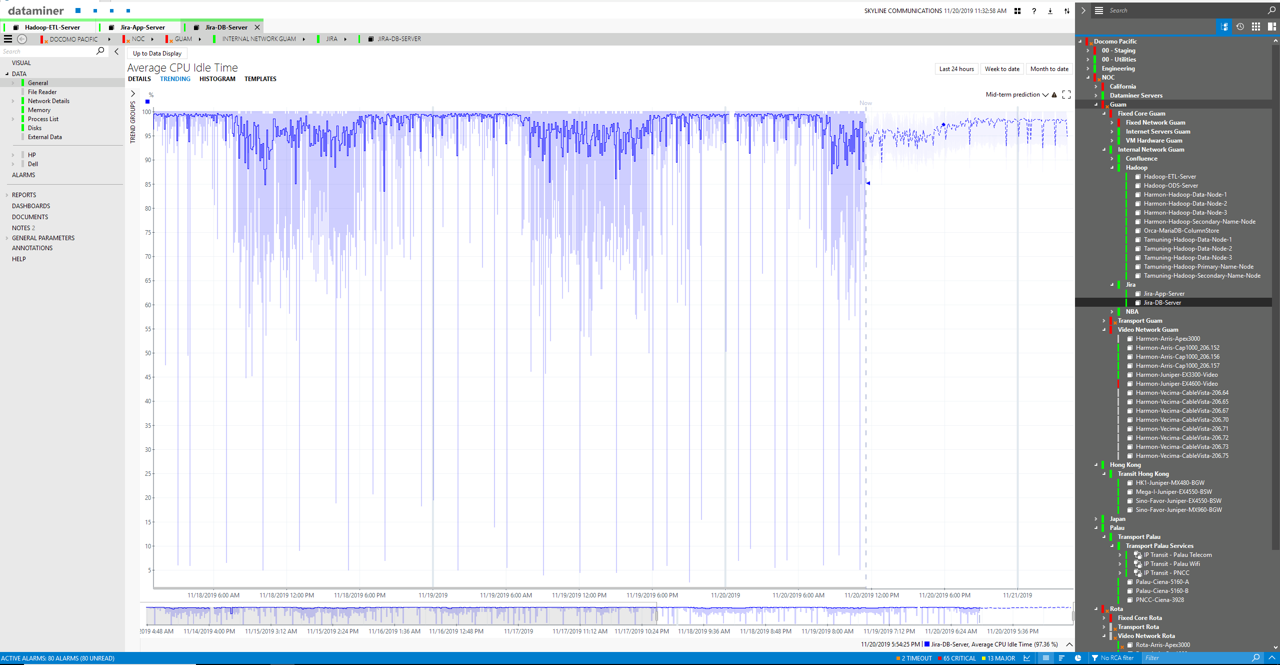
Trend display showing time series for CPU Idle Time on a JIRA app server, with mid-term prediction by DataMiner based on autonomous learning (dashed line).
Album: DataMiner Forecasting