integration Use Case
Skyline Multicast Flow Tracking
Check out this use case to learn how you can easily troubleshoot the SMPTE ST2110 multicast video and audio flows in your network.
This Flow Tracking application has been rolled out as part of a large-scale DataMiner project to monitor and manage the new IP-based Content Management Center (CMC) at ORF in Austria. Operators needed an easy-to-use tool to troubleshoot and identify the root cause of any multicast flow issue in the ORF production network. For example, in case a mulitcast video flow is not received at a destination, this app will help them analyze where the signal goes missing.
To achieve this, DataMiner interfaces with ORF’s SDN controller (Nevion Video iPath) to learn about active services and the configured paths in the network. Based on those crosspoints, it starts crawling through the network from signal source to destination, comparing the crosspoints that have been set by the SDN controller with the actual situation in the network. To do so, DataMiner interfaces with all devices and data sources along the line, such as the media edge devices and the network switches (Cisco) to achieve a “single pane of glass” user interface.
While the application was purpose-built for ORF, the underlying framework of the application is generic. It can therefore be extended at any time to support other SDN controllers, network switches, and media edge devices from any vendor.
Once the API is available, we will also add support to integrate the EVS Cerebrum Broadcast controller into this application, so that we can extract the flow labels and “bouquets”. Then operators will not only be able to look at individual flows, but also at a bouquet (i.e. a set) of flows.
USE CASE DETAILS
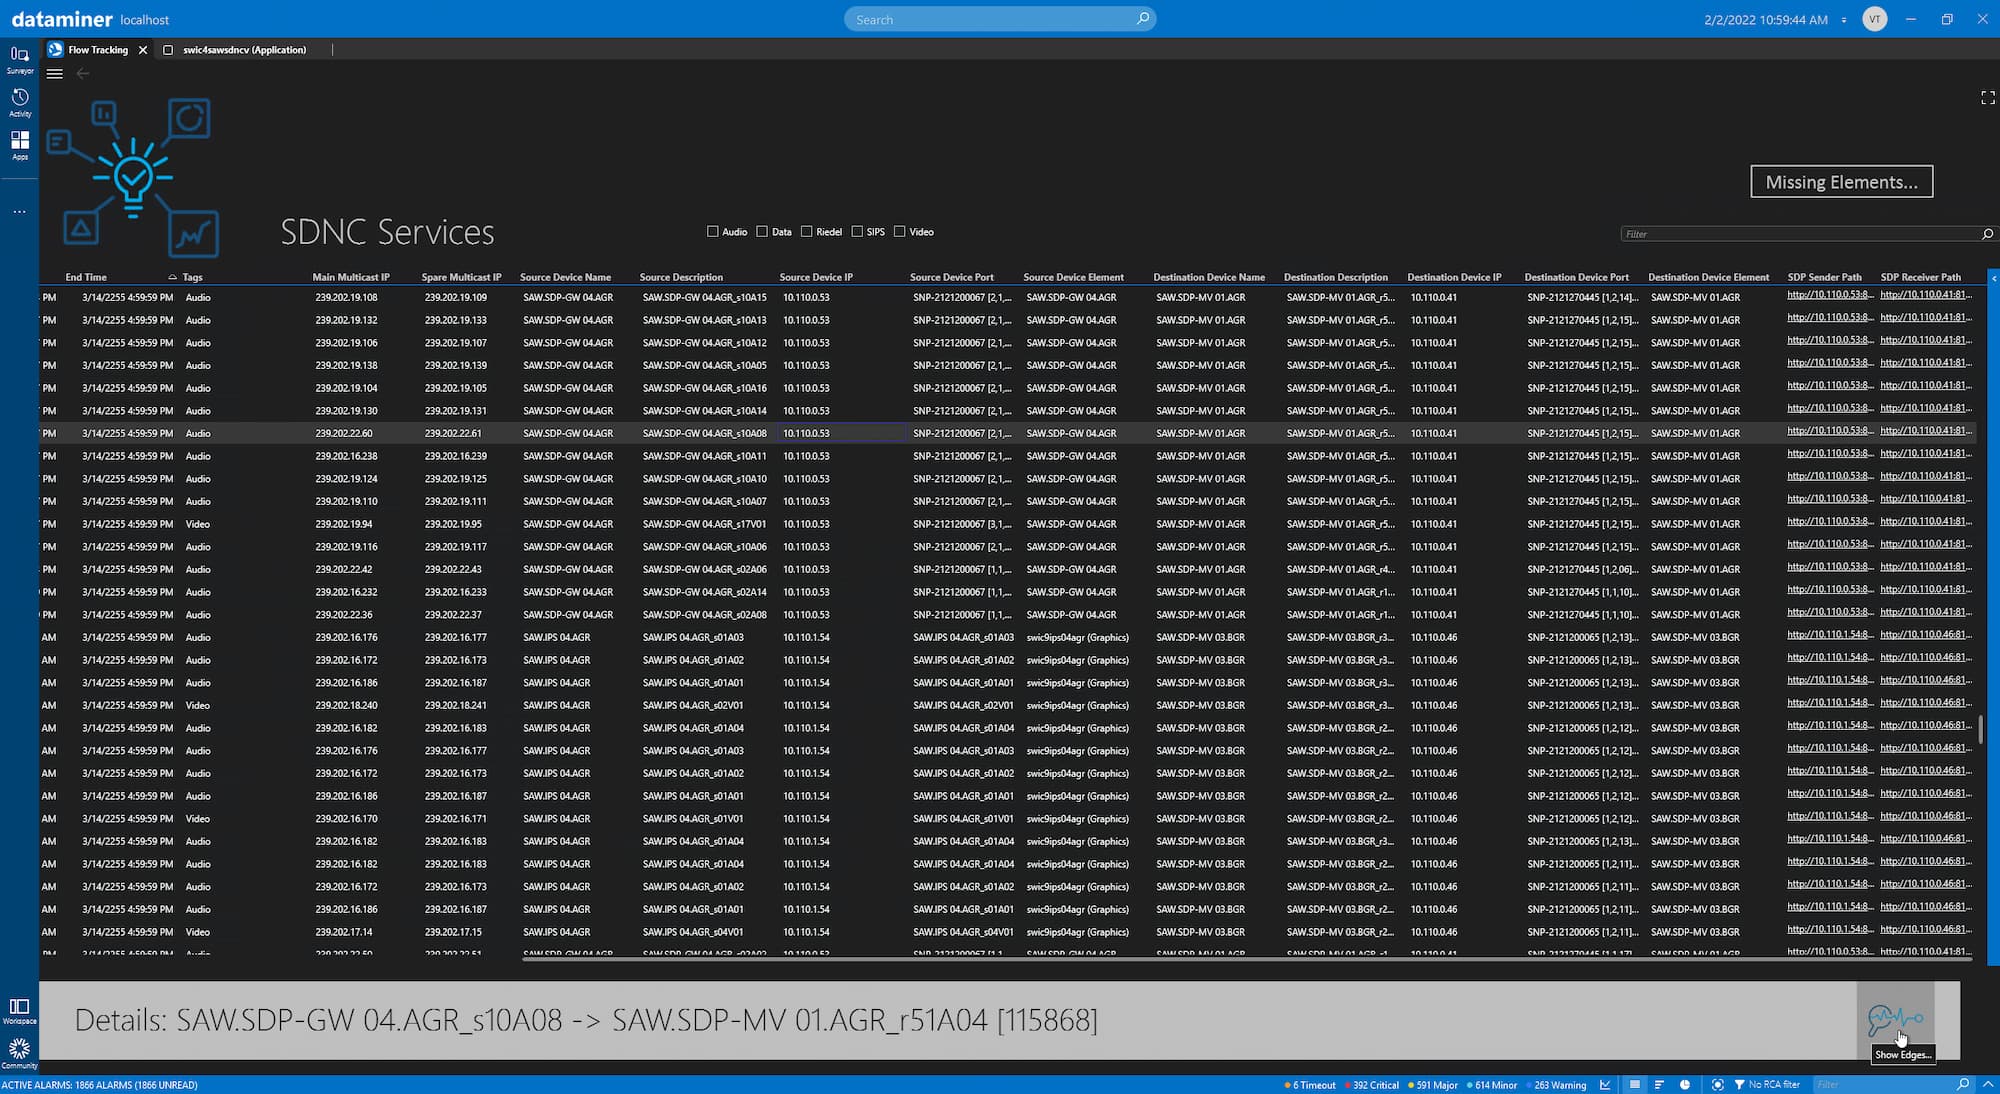 When you've launched the application, you will see all services (i.e. all crosspoints) that are populated by the controllers configured in the app. Mulitple SDN instances can be linked to this same application. Metadata is present so that you can see the service state, start and end timing, multicast IPs, tags, and much more. This UI allows you to quickly filter on tags (e.g. Audio, Video, Data, etc.). The standard table filtering is also avialable so you can easily find any of the listed metrics. Once a service has been selected, you can start the analysis by click the "Show Edges" button at the bottom of the application. This will open a pop-up window.
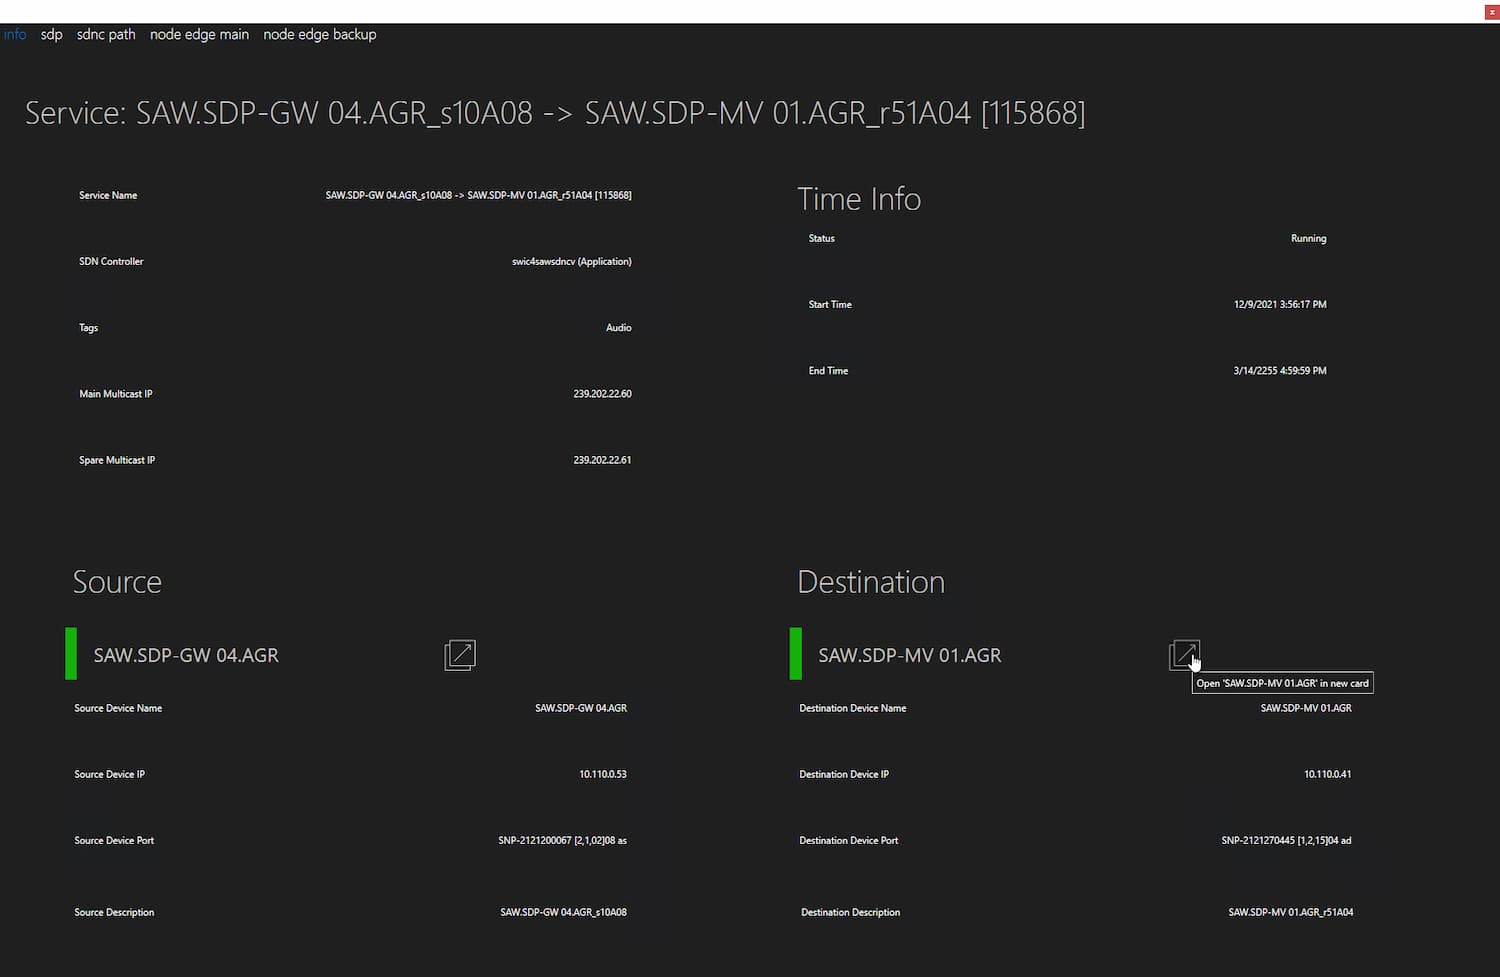 The pop-up user interface has serveral tab pages. On the initial page, you can find all the info metrics related to the selected service coming from the SDN controller. At this point, you can already see the source and destination device represented in DataMiner together with their health state. To navigate to these elements, simply click the link.
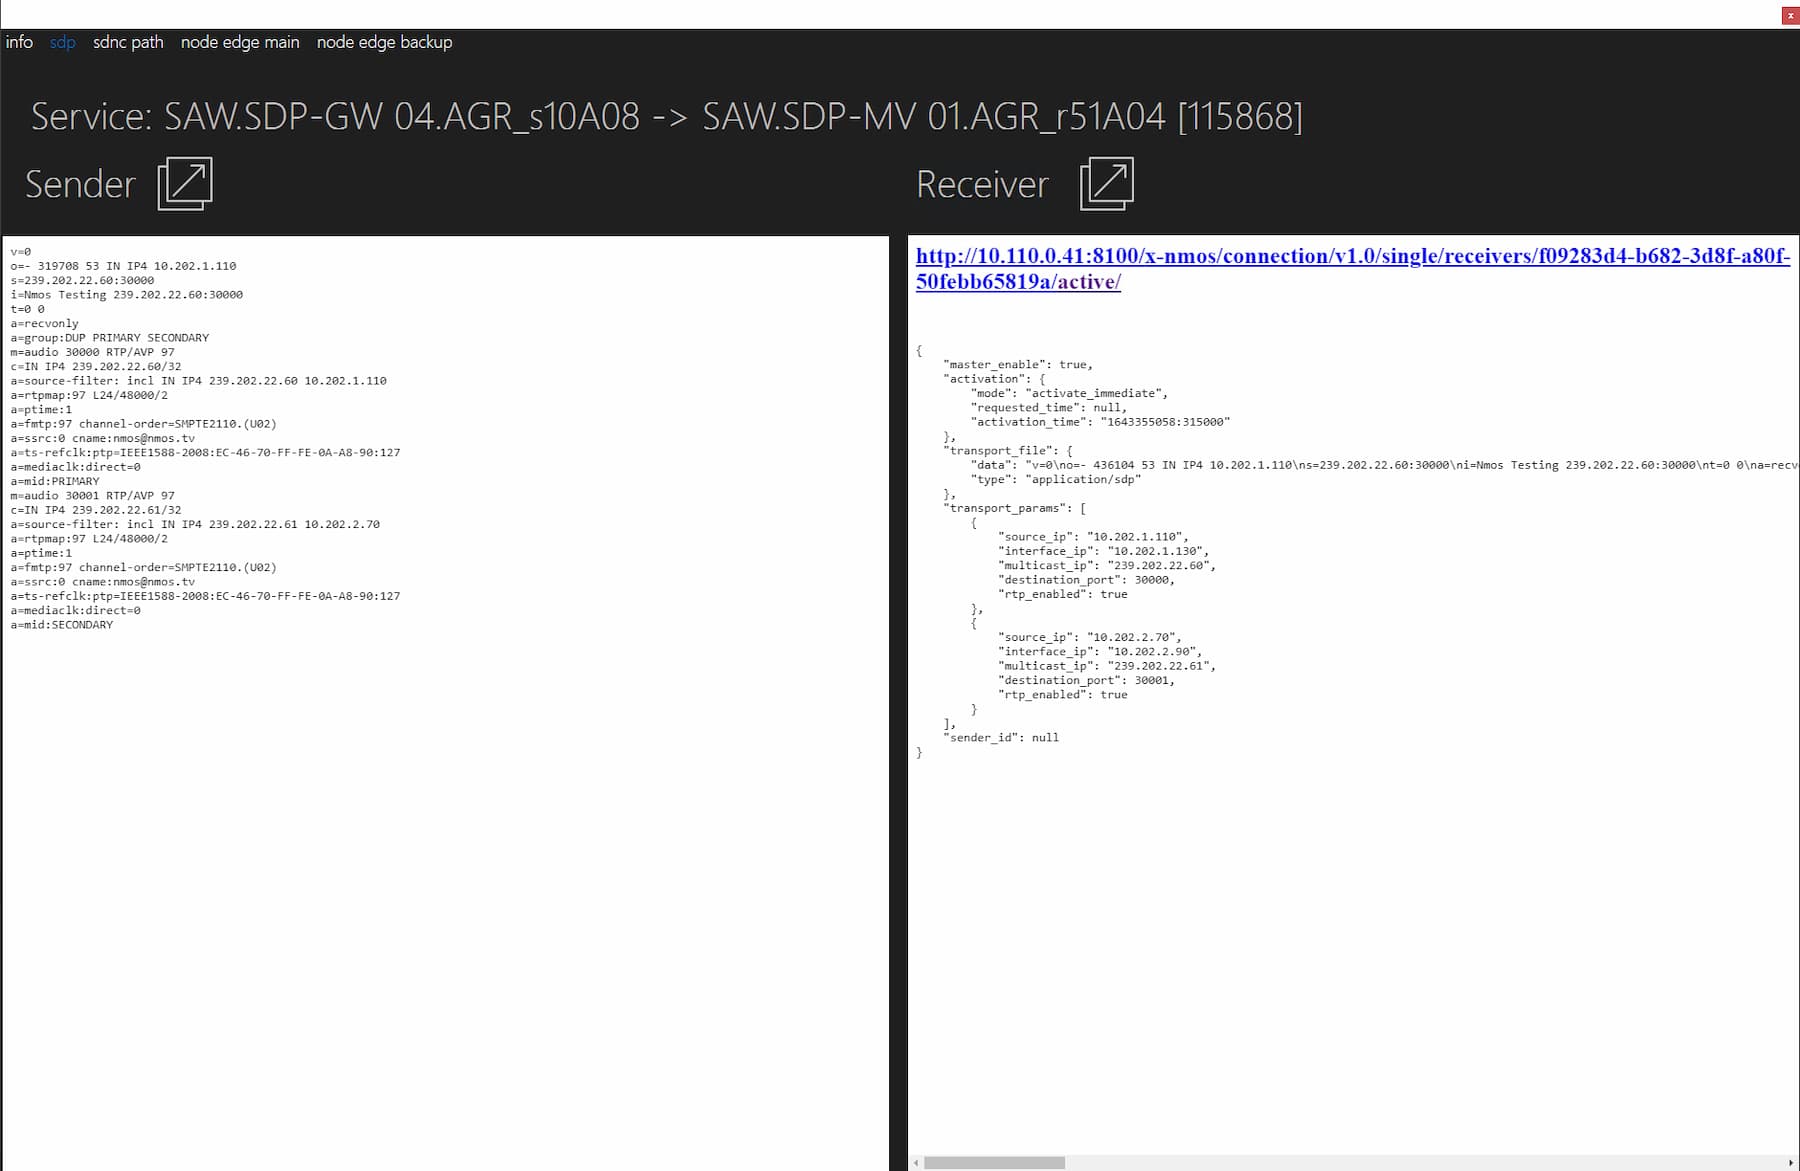 On the next tab page, you will find references to the SDP transport data for both sender and receiver. This tab page provides easy access to this content, so that you can verify if there are unexpected differences between the two files (sender/receiver). The files are shown side by side to allow easy visual comparison. SDP is a standard on NMOS, though different vendors implement different flavors of visualization. Some show the content directly, others have it wrapped with or without HTML styling. Note that this is the first iteration of the SDP implementation. In the future, we might process the SDP content itself to improve the visualization, allow a compare functionality within the UI, or add other automated logic.
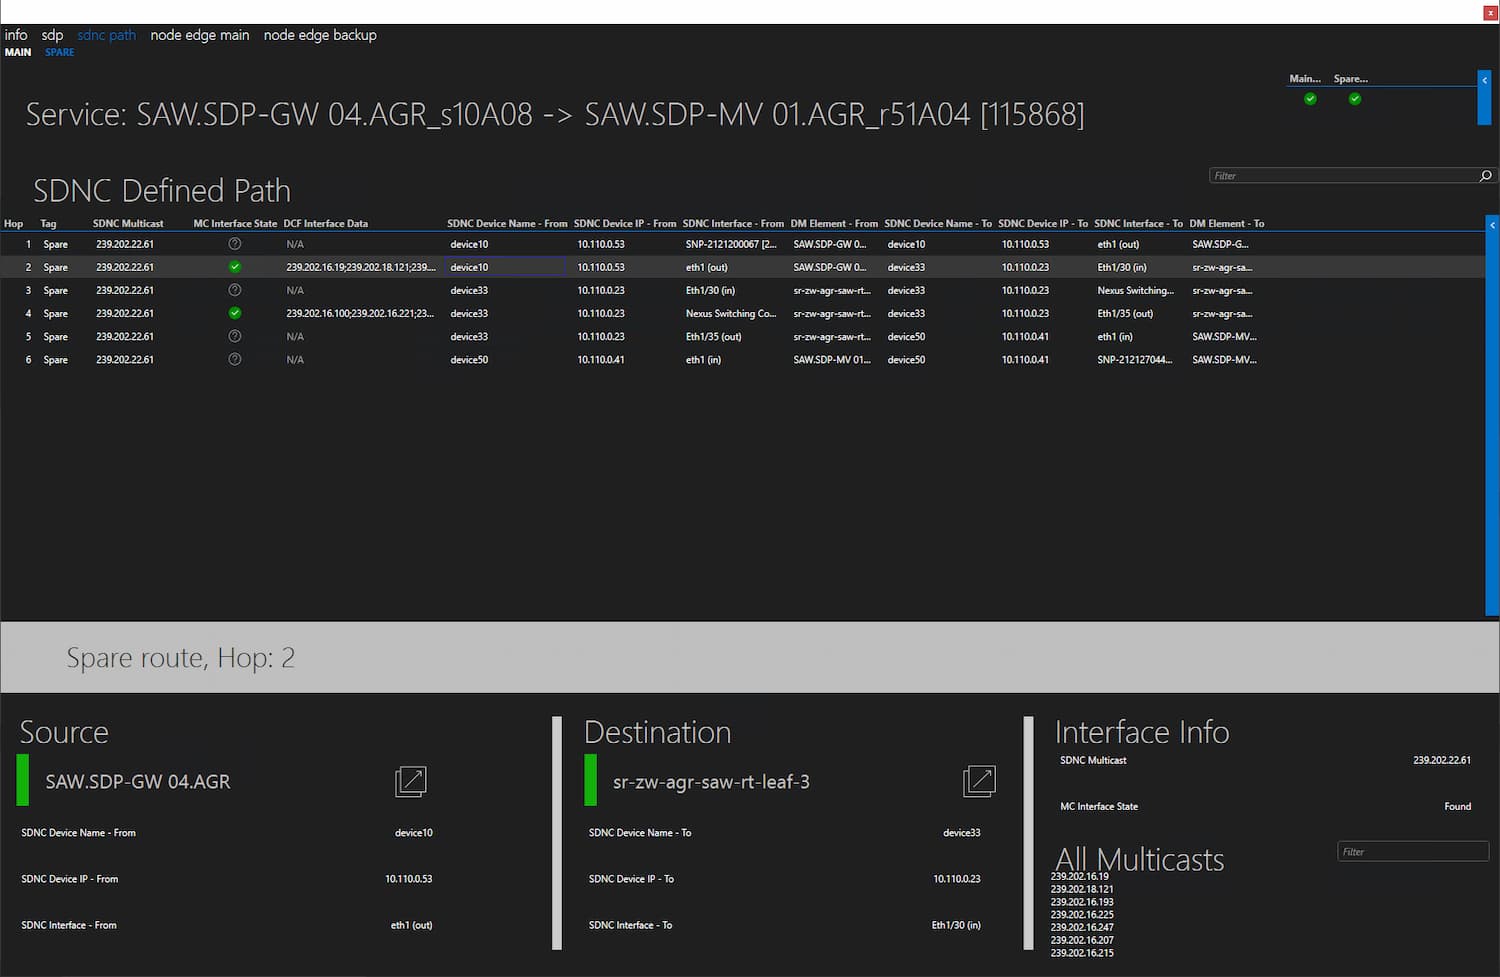
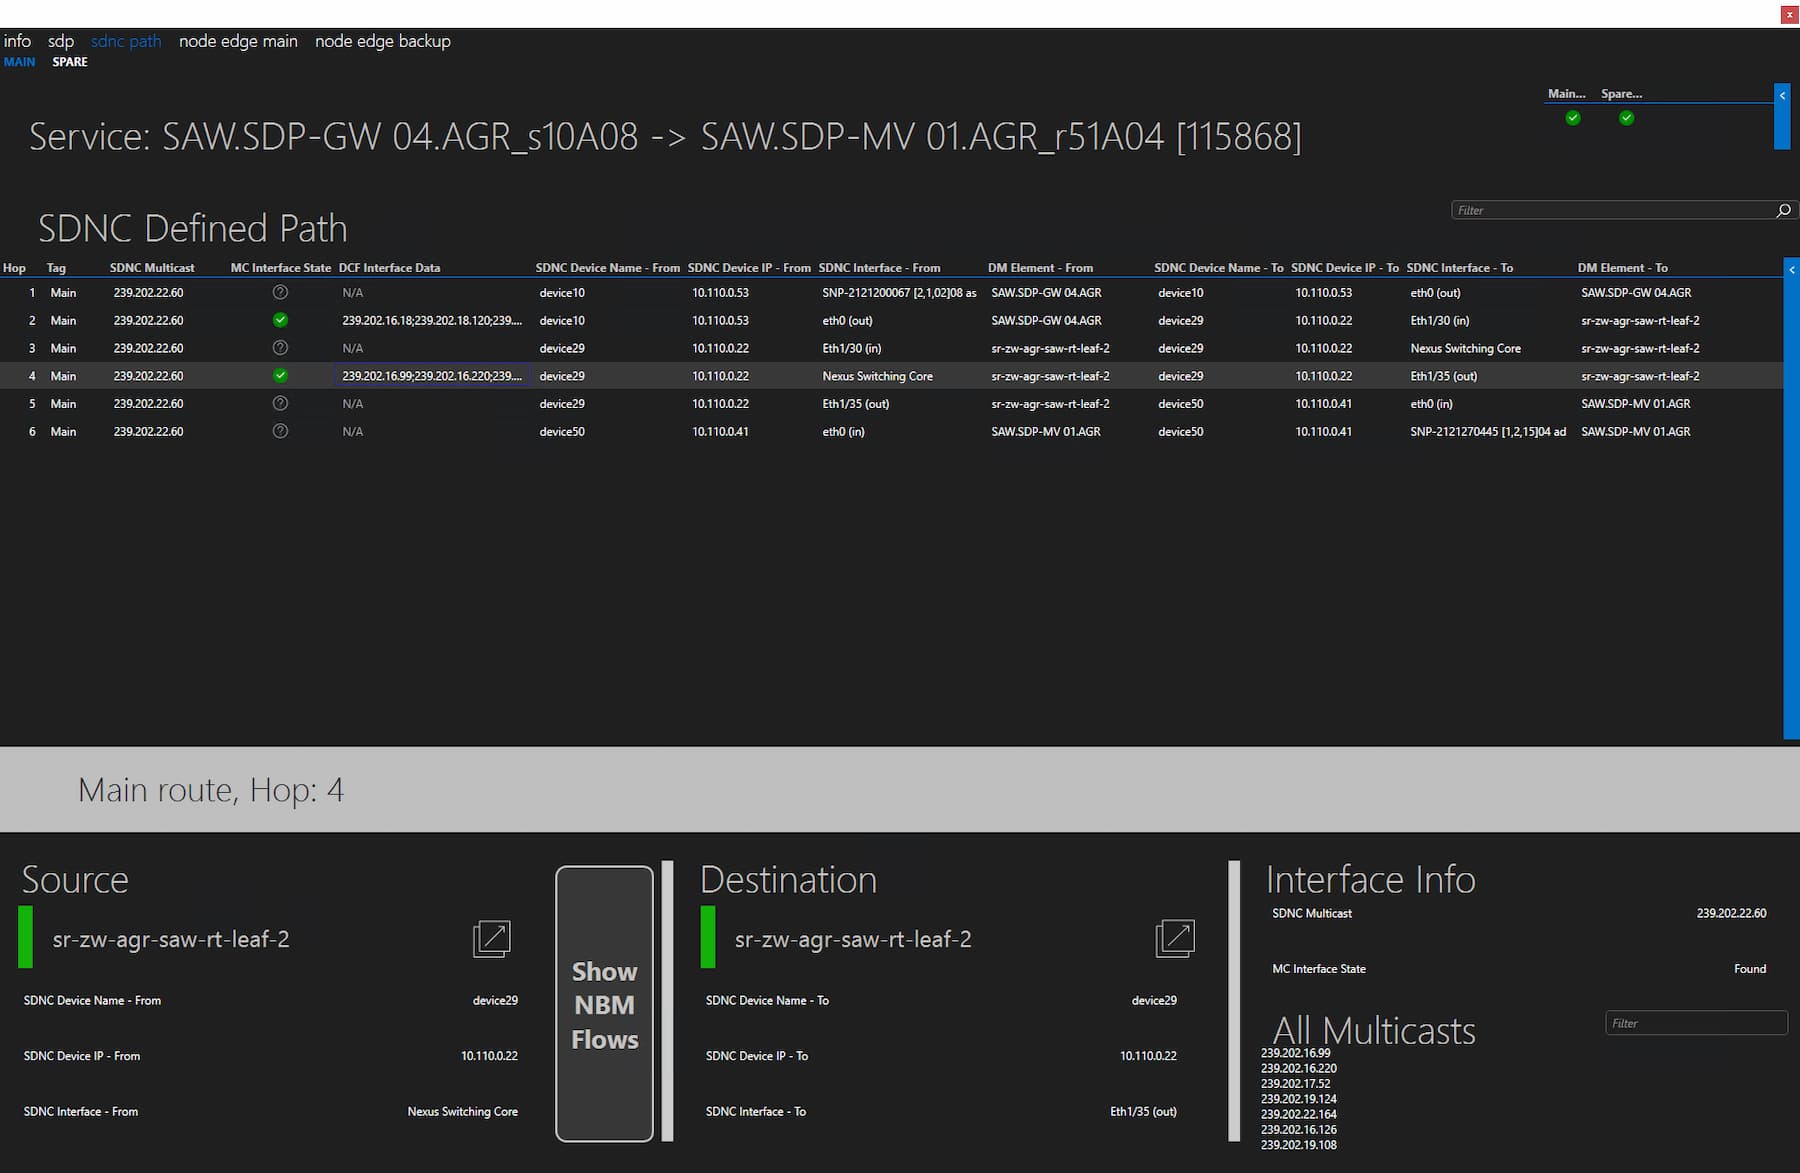 The next tab page shows detailed information about how the service flows through the network. These details originate from the SDN controller and are available for both main and backup paths. When you select a hop, more details related to the source and destination devices are shown, and you can also navigate to the corresponding element cards, if necessary. A list of all multicast addresses on this same interface is listed, with a filter to easily find specific addresses. For every hop towards a switch or edge device, multicast verification is done to check if the linked interface of the switch or edge device contains the expected multicast address. For the CISCO Switch fabric, for example, the command "Show NBM Flow Details" shows a list of all the available NBM flows with their respective source and egress interface references. Every edge device connector has been extended with a feature to mirror the multicast information onto the linked DCF interfaces of the respective elements. When the multicast address is found, a green mark is shown. When the multicast is not present on the interface, a red mark is shown. In case the hop remains within the same device (e.g. internal switching core), the mulitcast address isn't validated since there is no new interface to check. In that case, the marker is a grey question mark. When a certain edge device hasn't been added to this application, you will also see this question mark. This simply means the edge device doesn't reflect any multicast address information on its interfaces. When this data is available in the product, it could be added to the connector as a new feature, which in turn will then automatically be picked up by the Flow Tracking application.
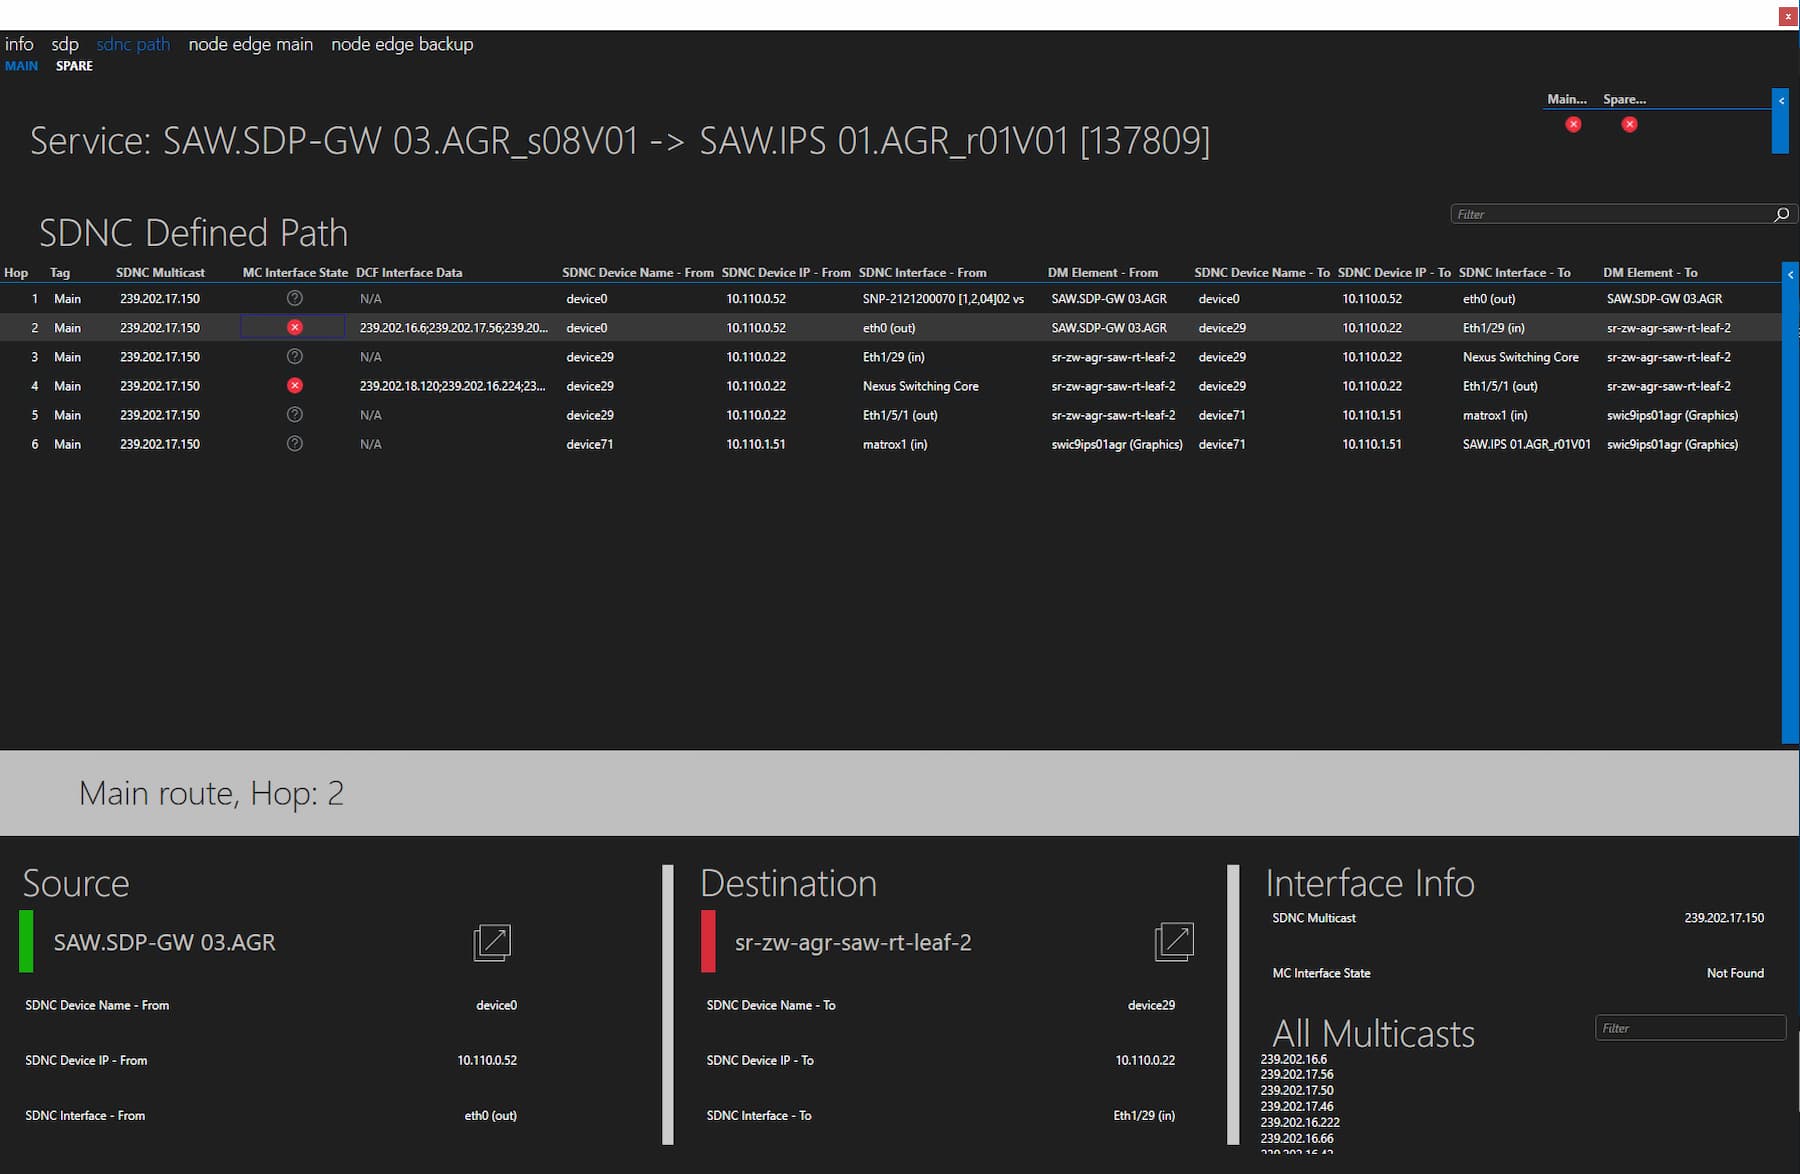 This is an example of a service flow that wasn't correctly routed through the network. The main and backup multicast aren't found on the expected interfaces. Based on this view, you can further investigate what's going on.
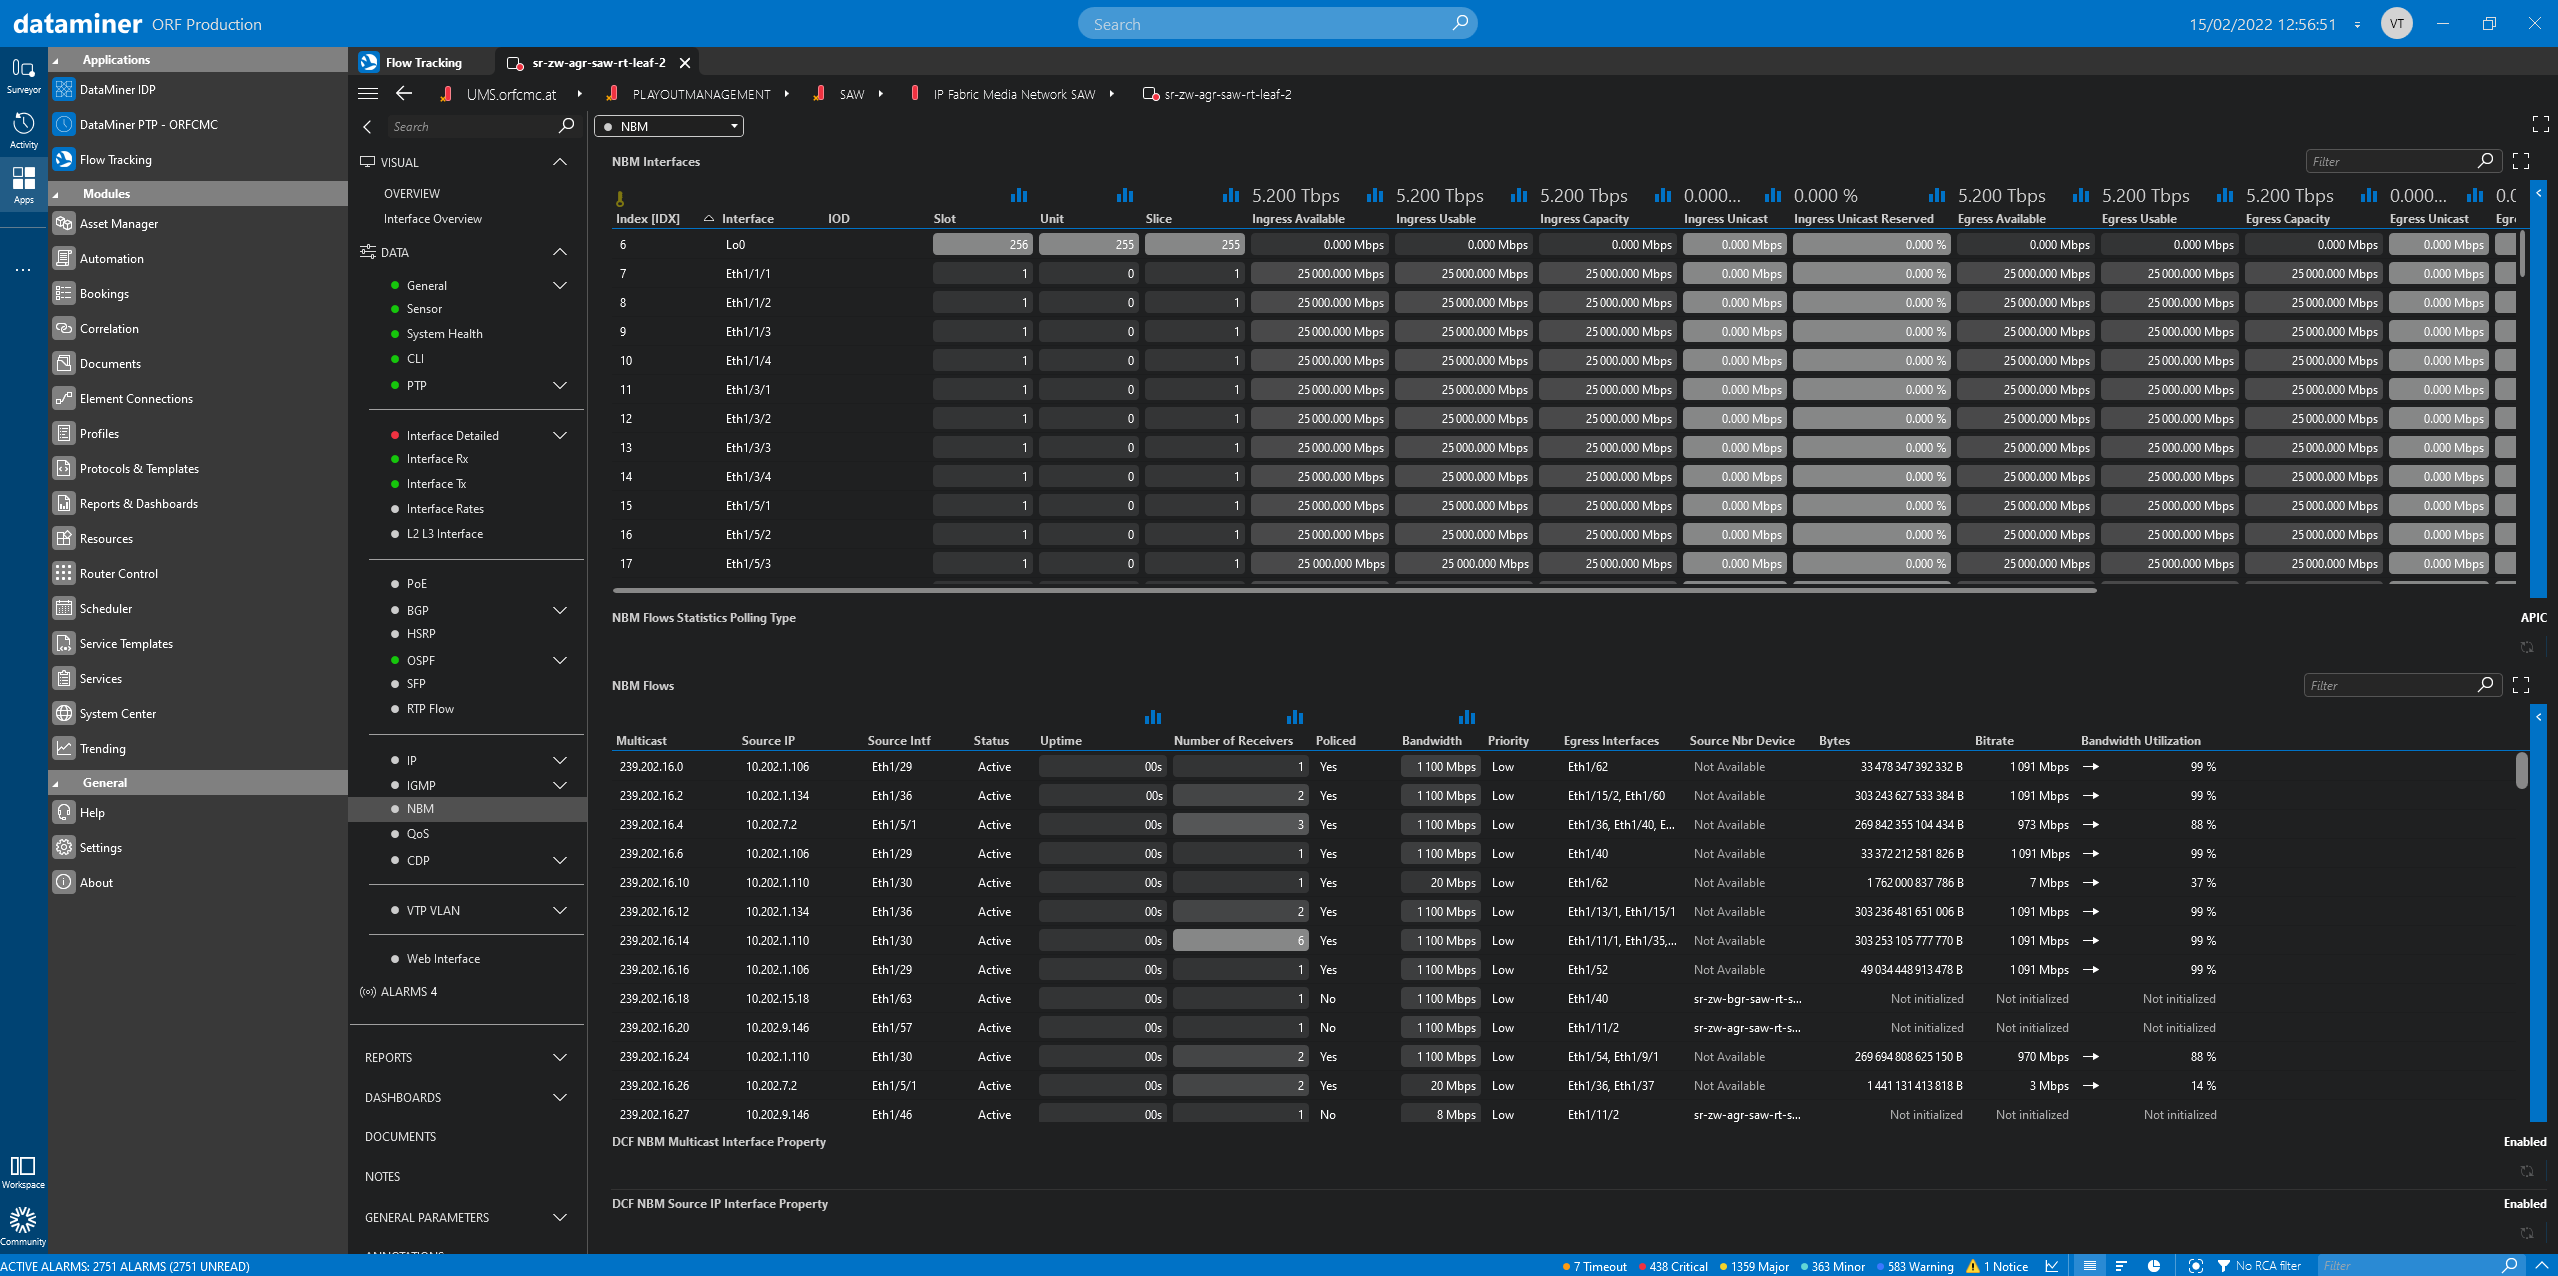 Here you can see the direct list of all the NBM flows that are on a CISCO switch. Finding the relevant data linked to your video or audio flow can be cumbersome. That's why the Flow Tracking application is of great support here; to link all the pieces together.
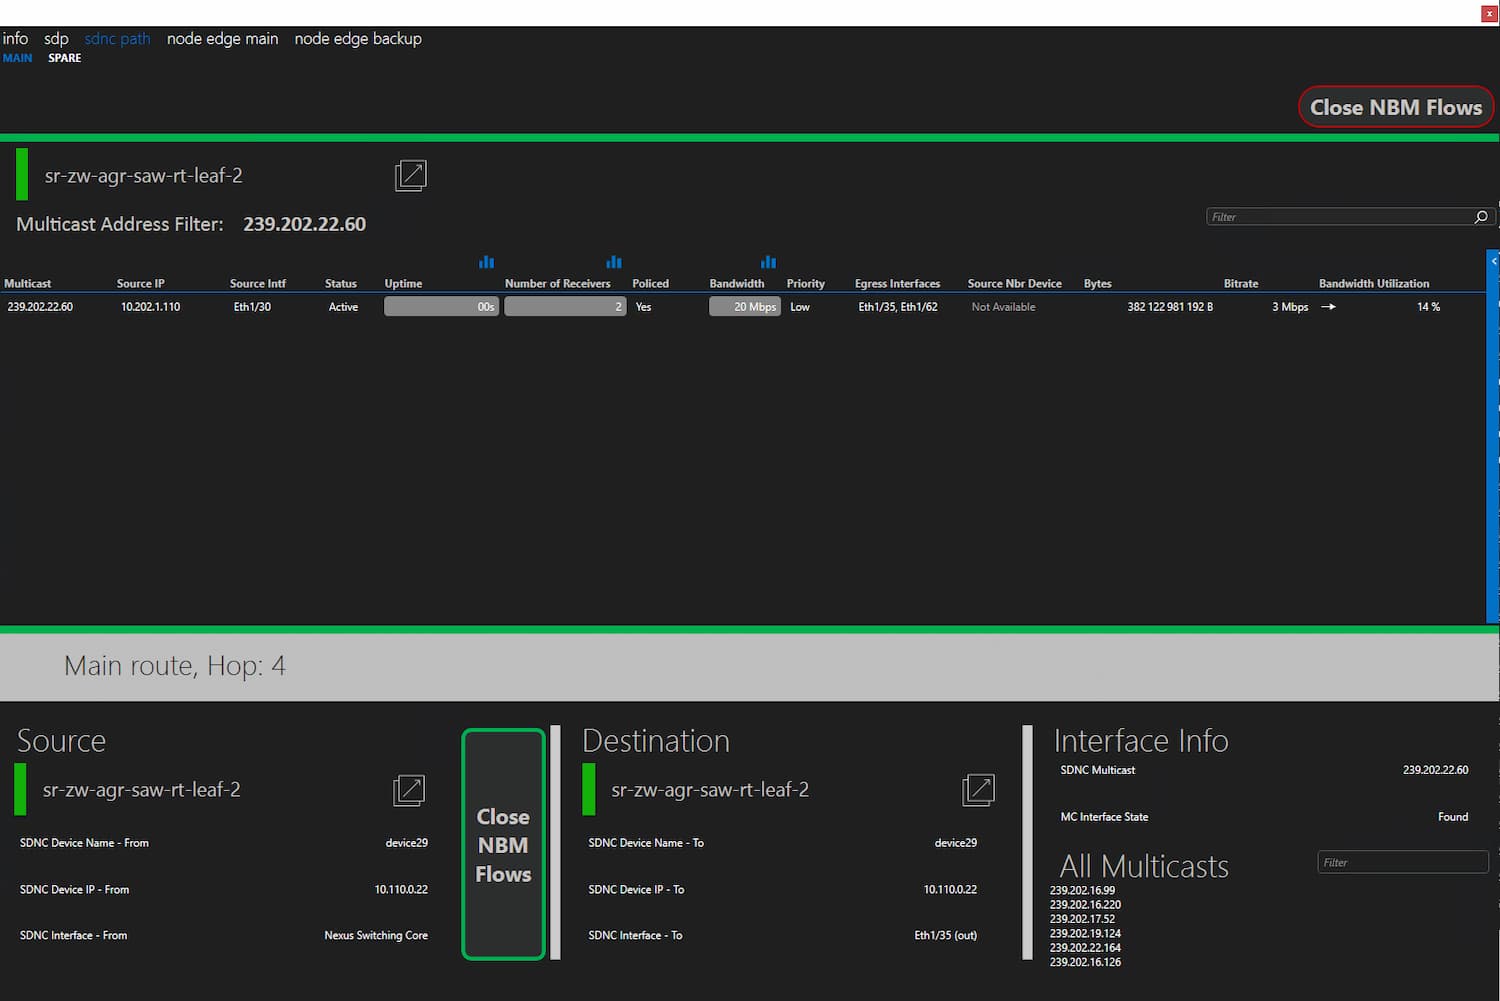 Click the button "Show NBM Flows" to see an inline table view of the CISCO switch NBM flows with an active filter on the multicast address (main or space depending on the tab you are viewing). This way you can easily access the NBM flow statistics on the ingress port to spot the multicast traffic. From here you can access the switch element itself, or even directly open trend graphs for the monitored KPIs. This style of investigation is much easier and faster compared to the previously shown NBM flows data table.
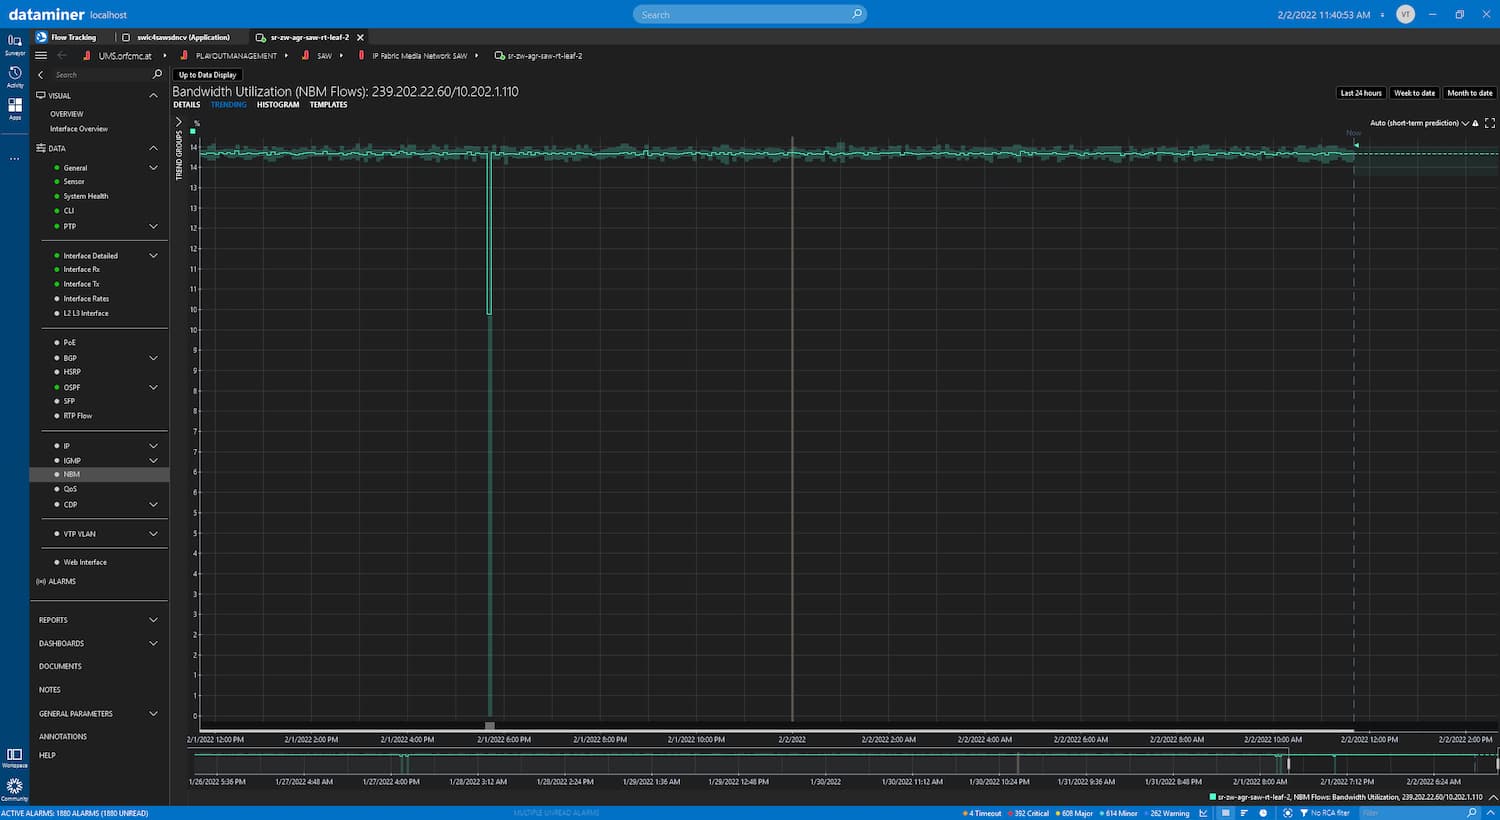 This example shows what you see after clicking the trend button for the bandwidth utilization. This opens a view filtered on the CISCO switch NBM flow records bandwidth. Via the Flow Tracking application, you can easily navigate through the investigation process to spot problems with only a few clicks.
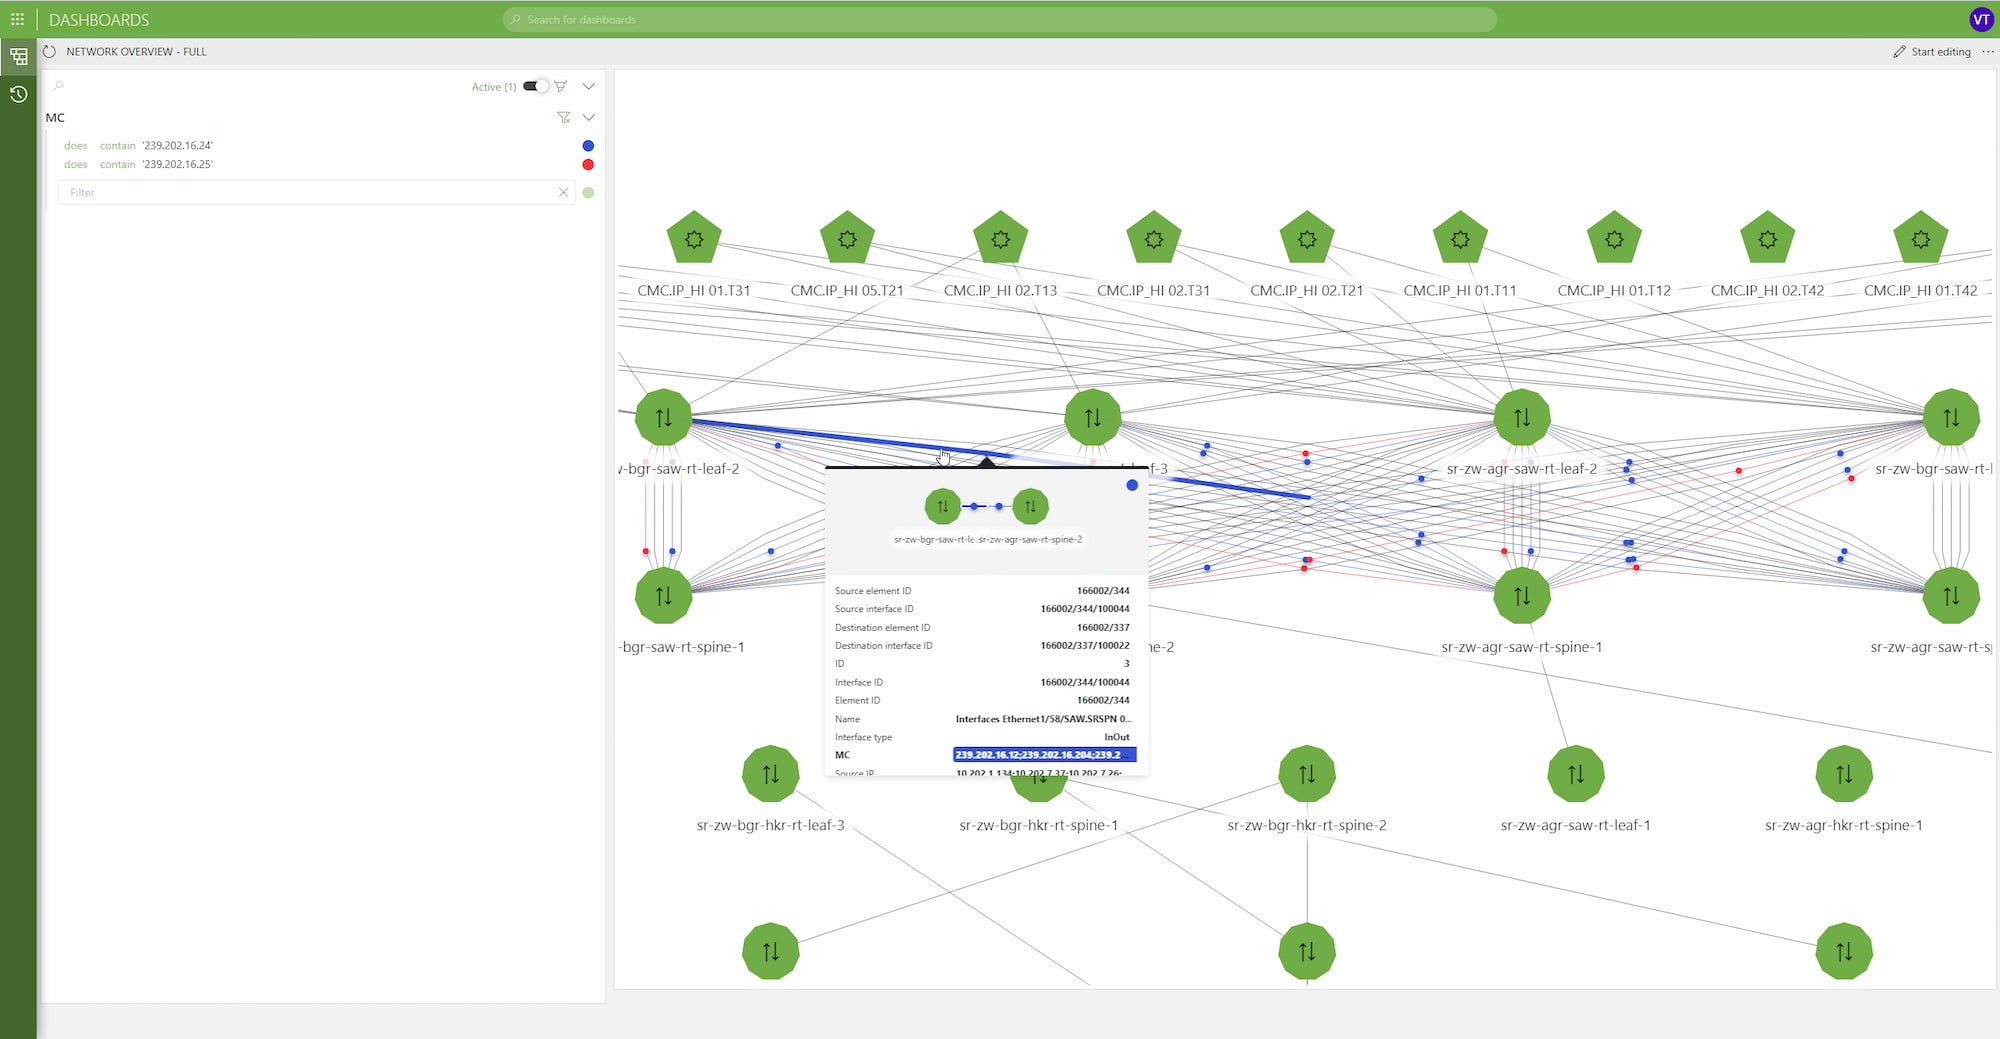
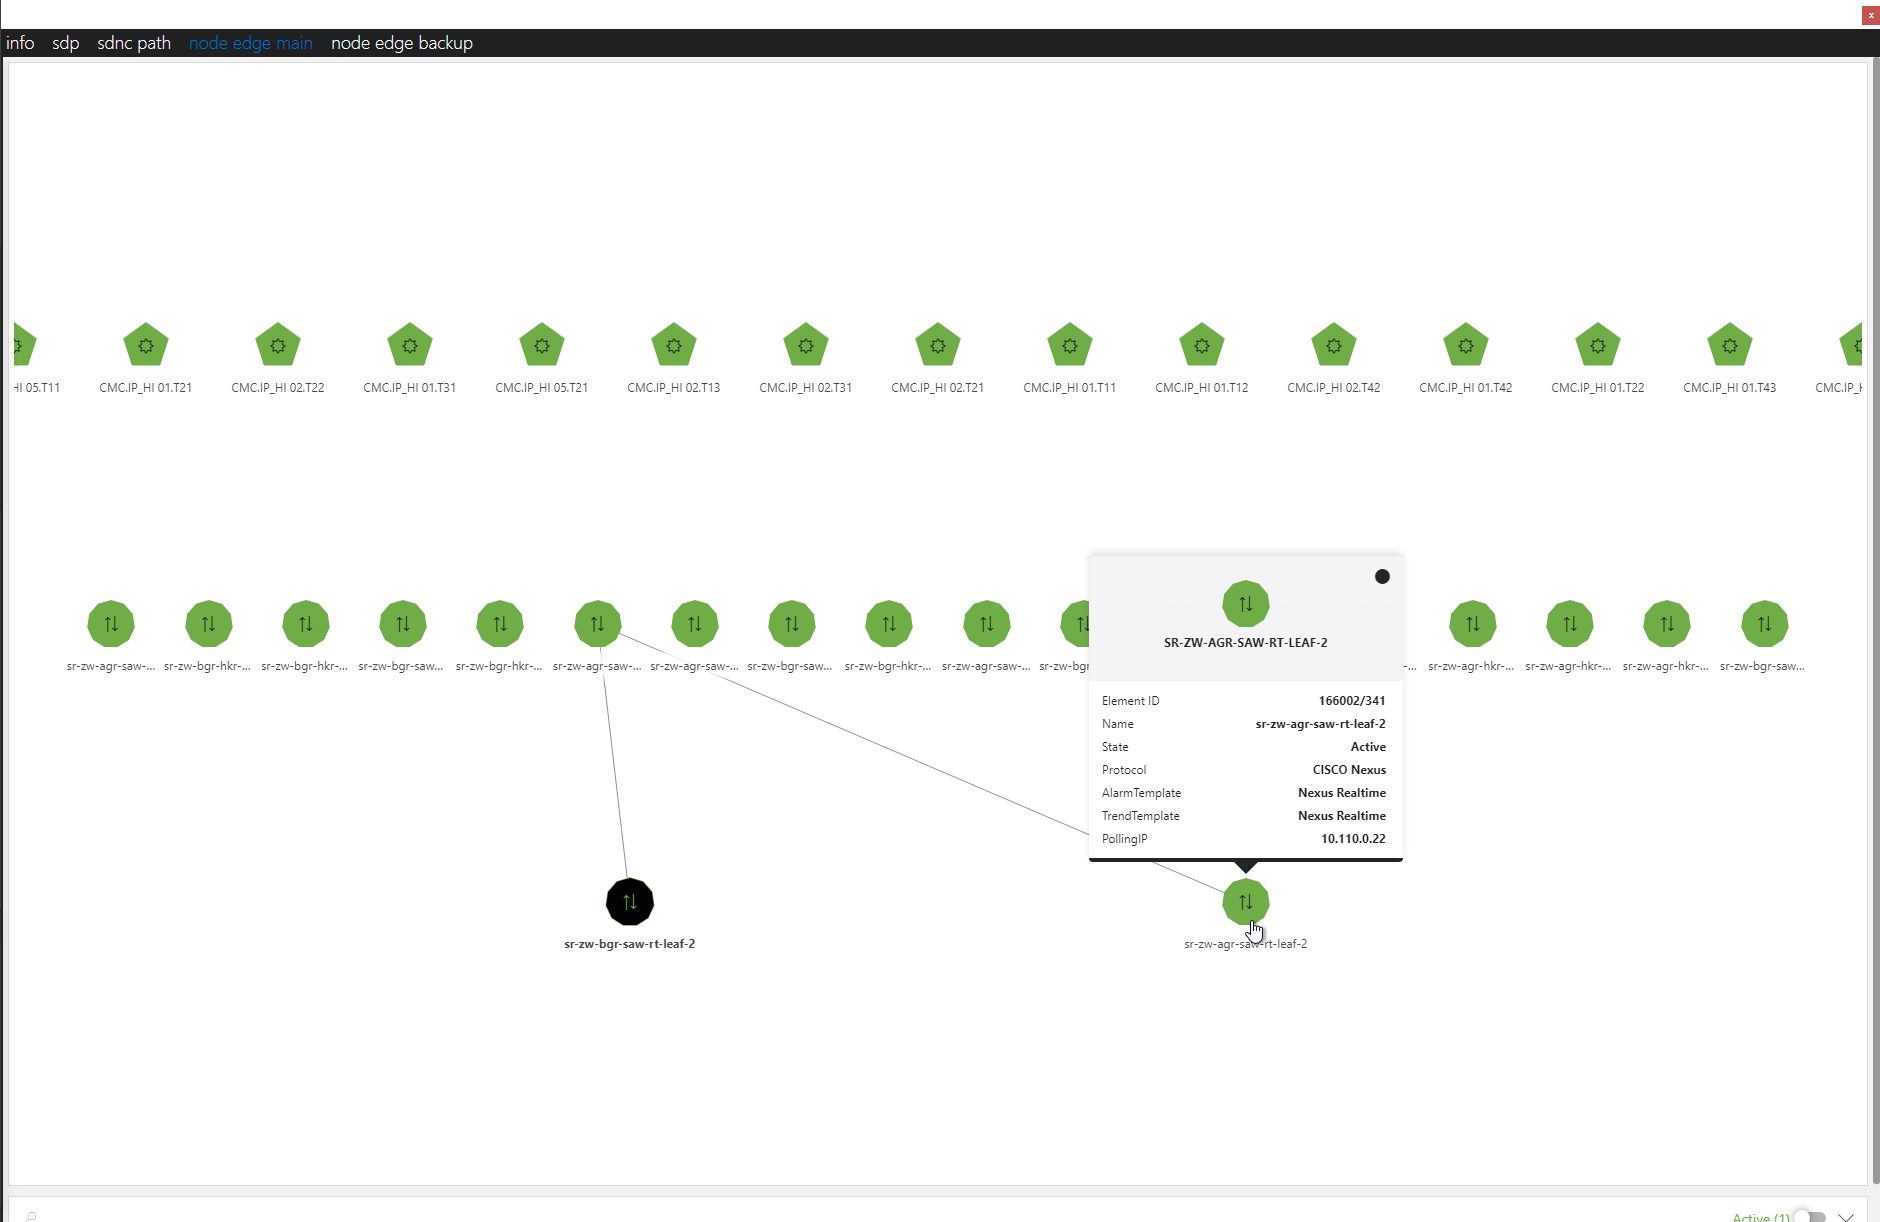 This tab page shows an inline dashboard using the DataMiner node edge component. It is pre-filtered on the main multicast addresss. Here you can dynamically view how the service has an active link between the nodes and the switch fabric. The background logic to map connections relies on the DCF interface data holidng the multicast addresses.
 On the SDNC Path_Spare tab, you can find similiar information as on the main tab, except this now represents the backup path of the service using the backup mulitcast address. Note that at the top you can see the summarized state of the multicast verification checks. This allows you to easily spot issues with the redundant path no matter which tab you are viewing.
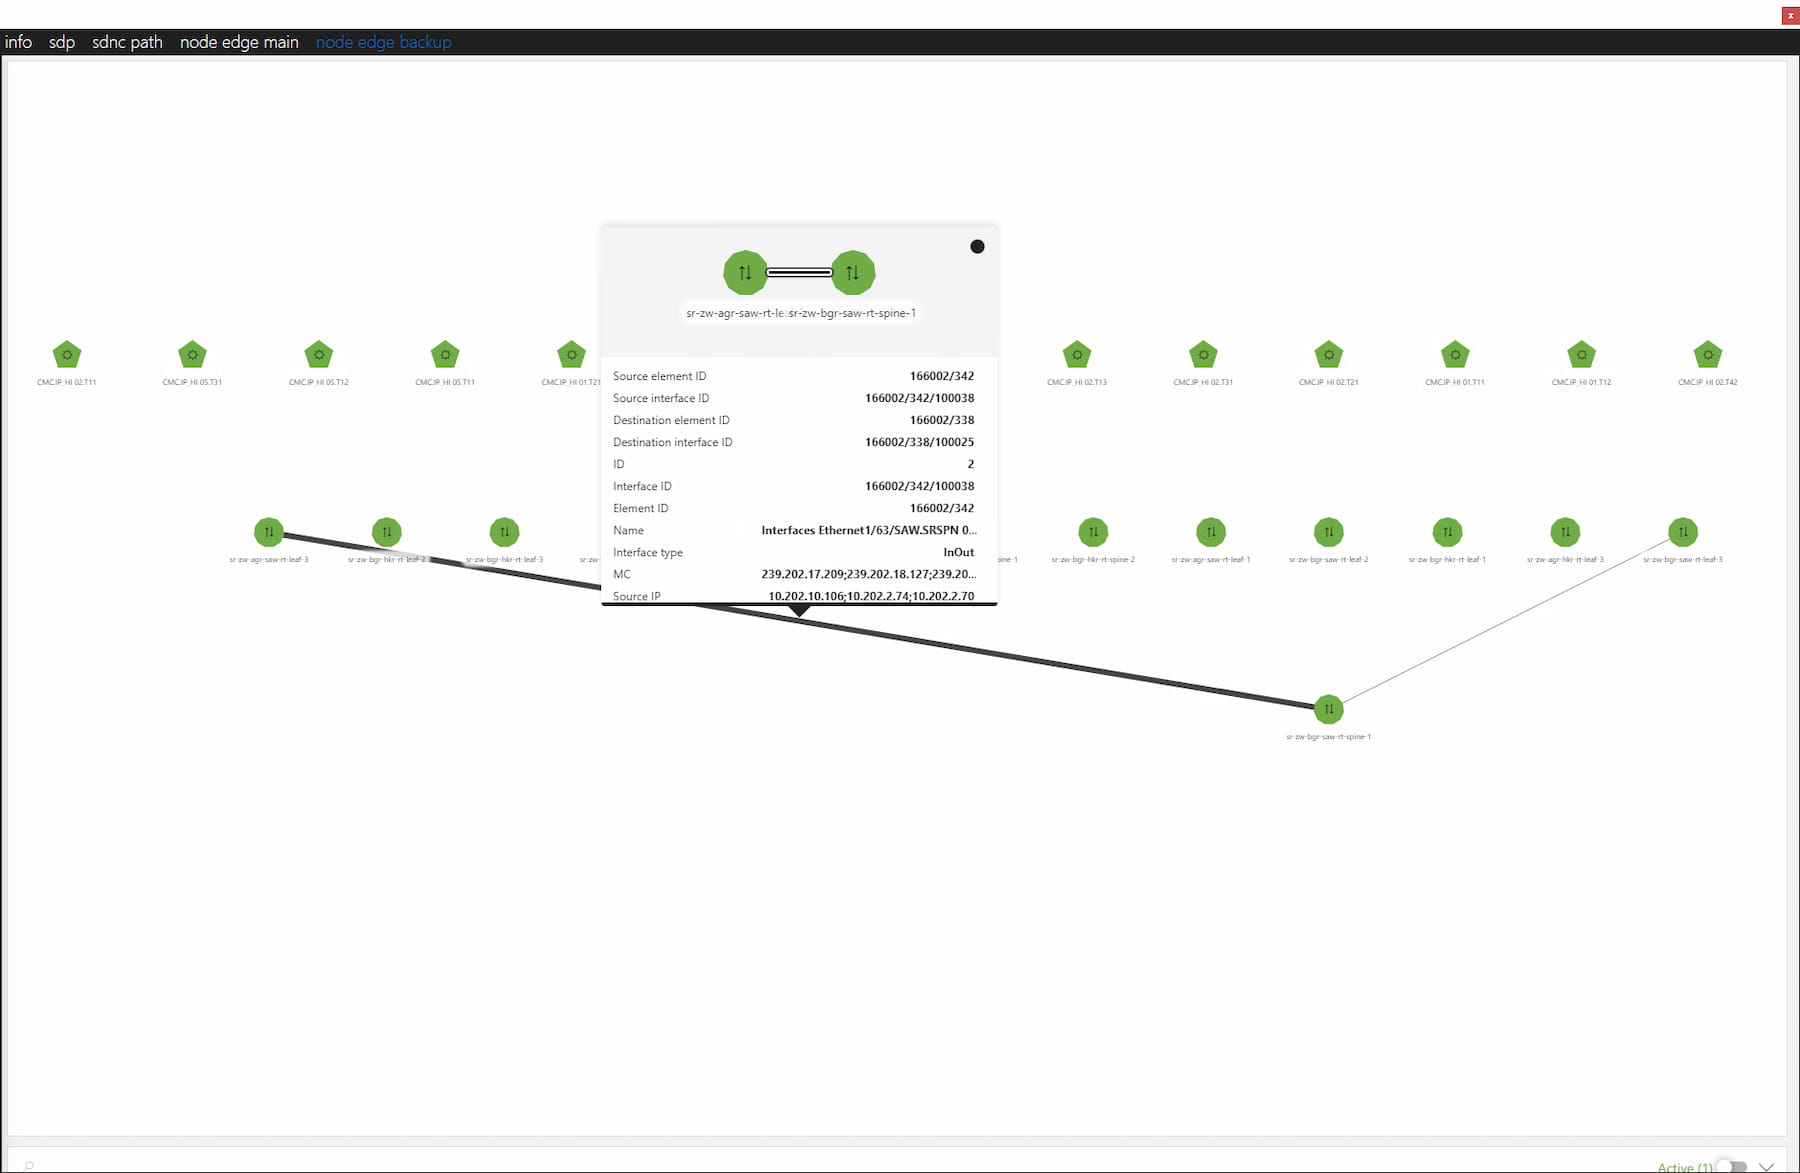 Similiar as for the main path, the Node Edge Backup tab will show a dynamic node edge component view of how the service flows across the nodes and swtich fabric for the spare path. This view uses the spare multicast address as a filter. For more information about the node edge component and its capabilities, search for "node edge component" in the Dojo serach box.