solution Use Case
Apache Cassandra Cluster Monitor
Do you need to maintain an Apache Cassandra Cluster? Then the Apache Cassandra Cluster Monitor connector will make your life easier. With this connector, you can keep track of the health of all your nodes without the need to check them all via RDP. The information is retrieved through CQL, which means you can get started with minimal configuration.
USE CASE DETAILS
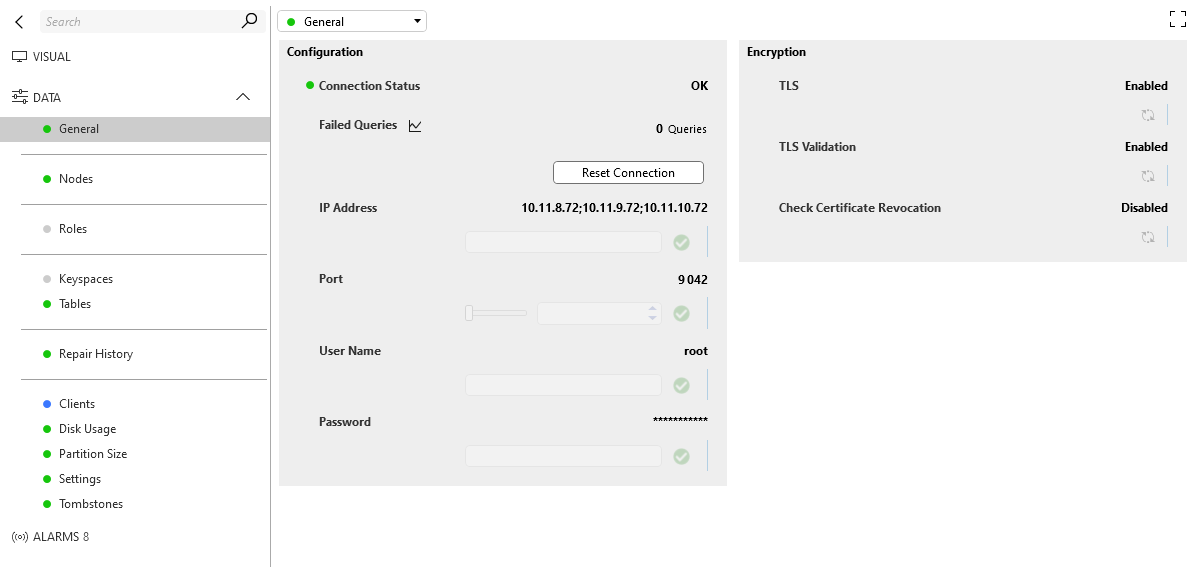 On the General page, you can configure how the connector should initiate communication with your Cassandra cluster. You can track if a query fails when monitoring the cluster.
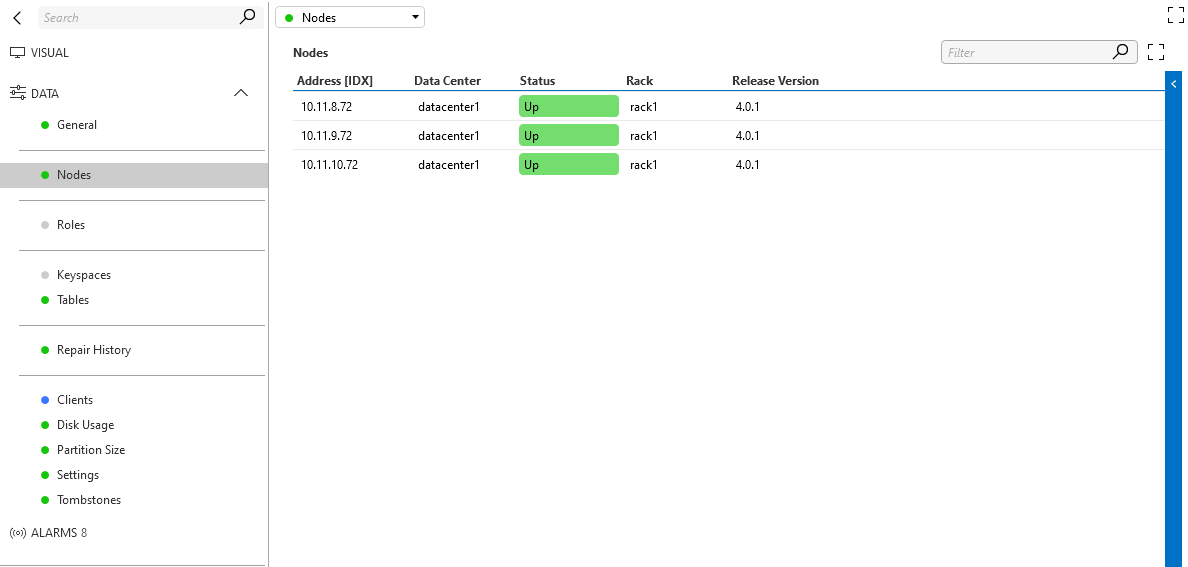 The Nodes page lists all the nodes in your Cassandra cluster.
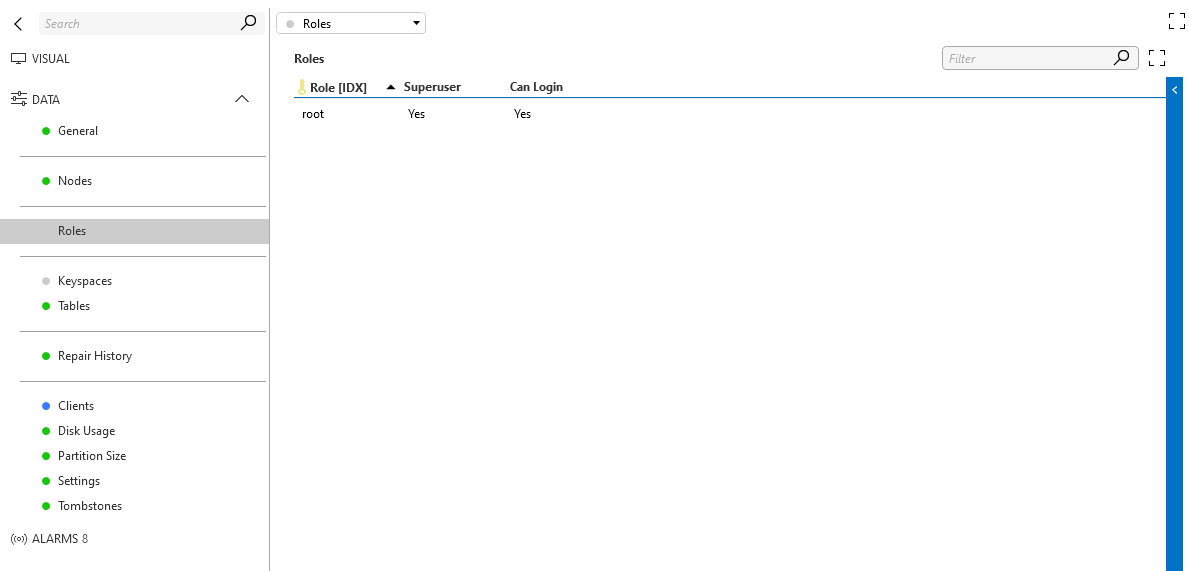 The Roles page shows a list of all the users available in your Cassandra cluster.
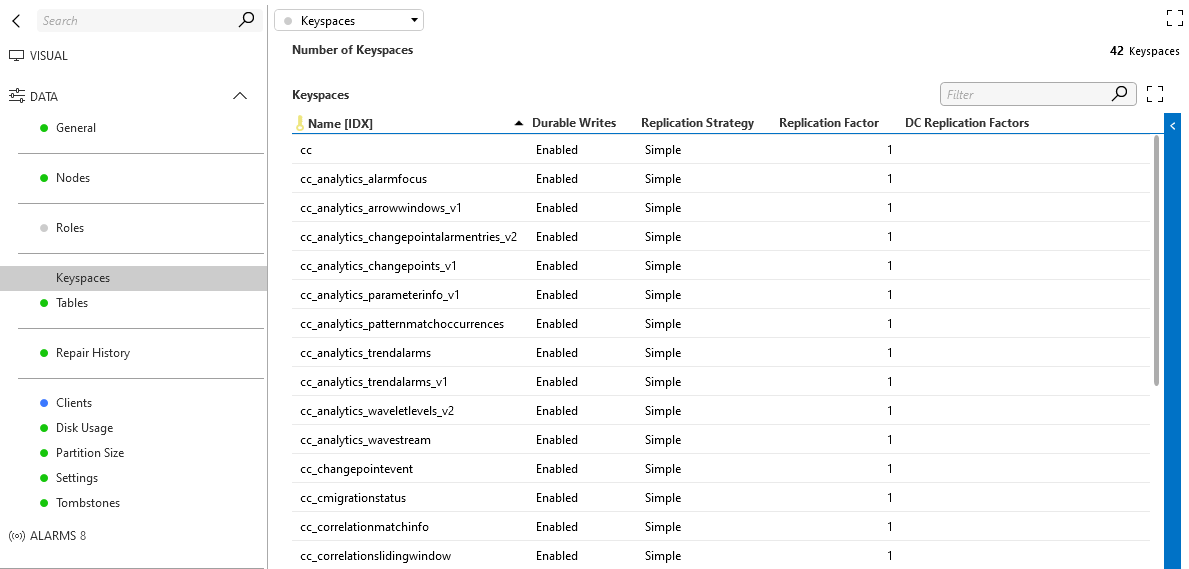 The Keyspaces page shows the keyspaces available in your system.
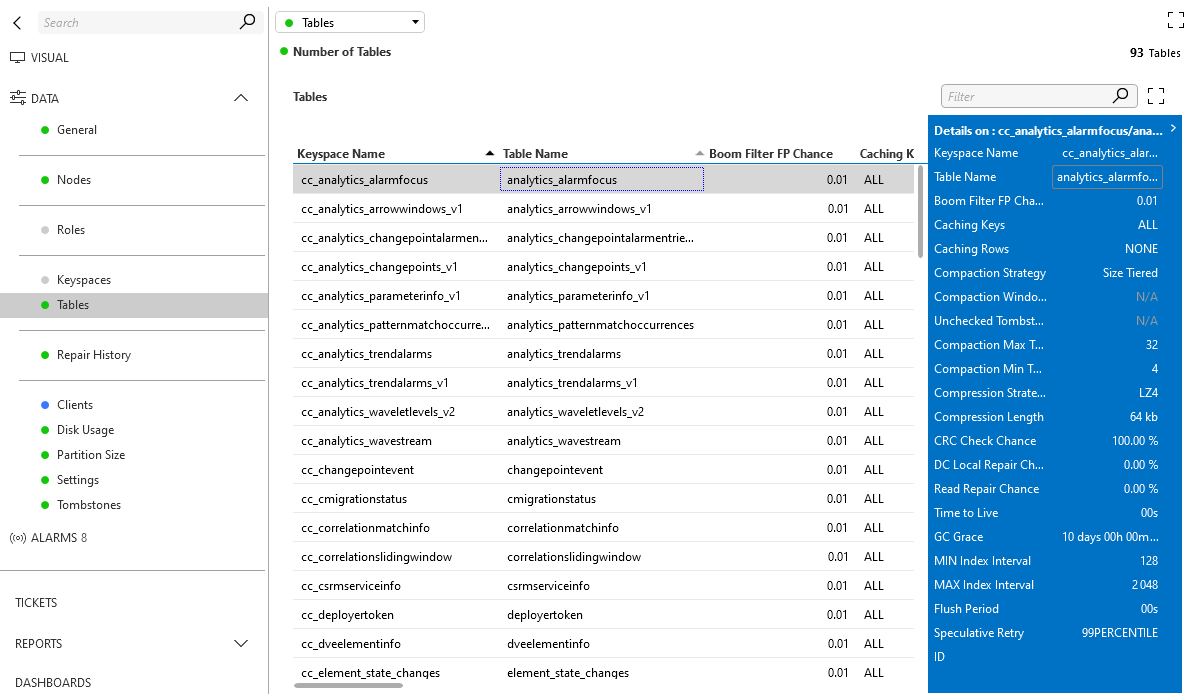 The Tables page lists the tables available in your system. You can also see which compaction strategy is configured for each table.
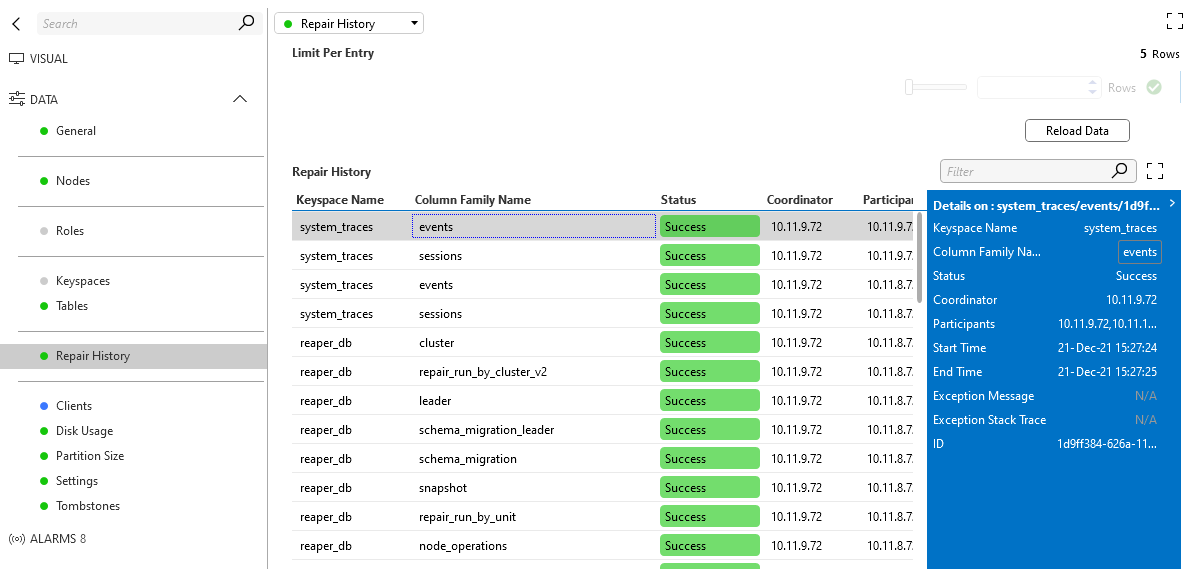 To keep data in sync between your nodes (in case your replication factor is larger than one), repairs are needed. The Repair History table allows you to keep track of the most recent repairs. By default, the last 5 repairs are shown for each table, but you can customize this number.
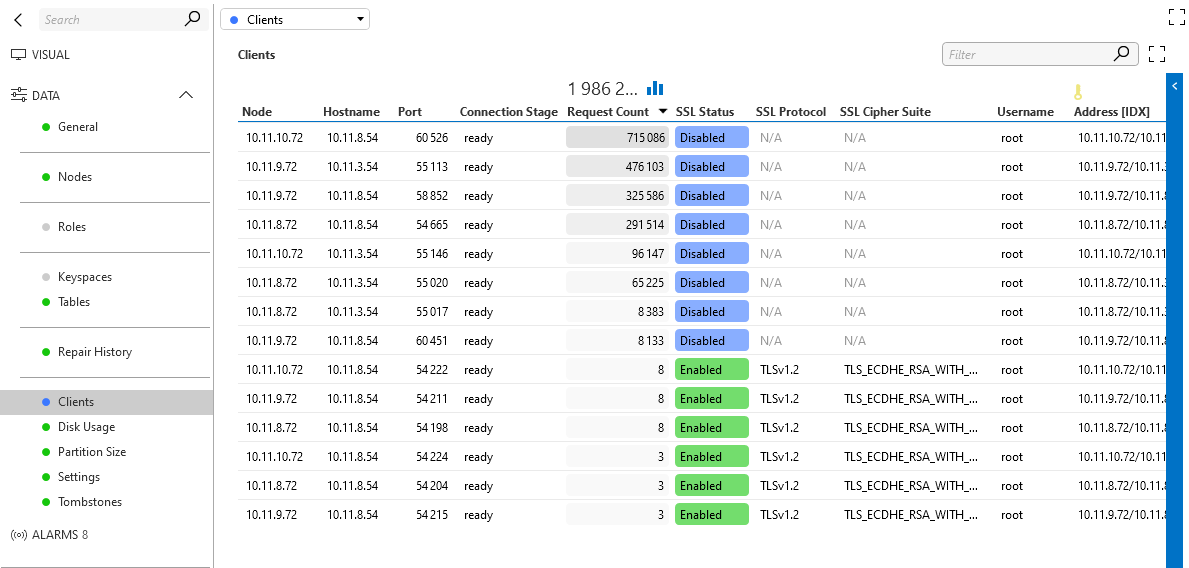 In the Clients table, you can see who is connected to your database and which IP they are using. You can also verify if the clients use SSL to protect your data going in and out of the database. This table is only available from Cassandra 4.0 onward.
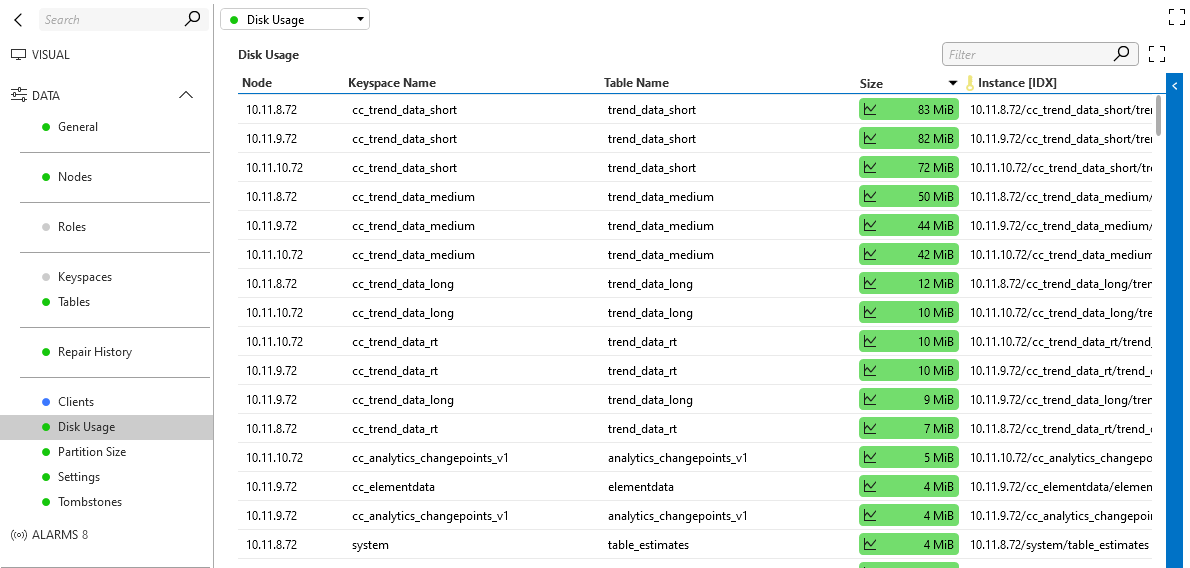 If you want to know how much space specific tables are using on the nodes in your cluster, you can check the Disk Usage table to immediately find out. Note that this table also requires Cassandra 4.0 or higher.
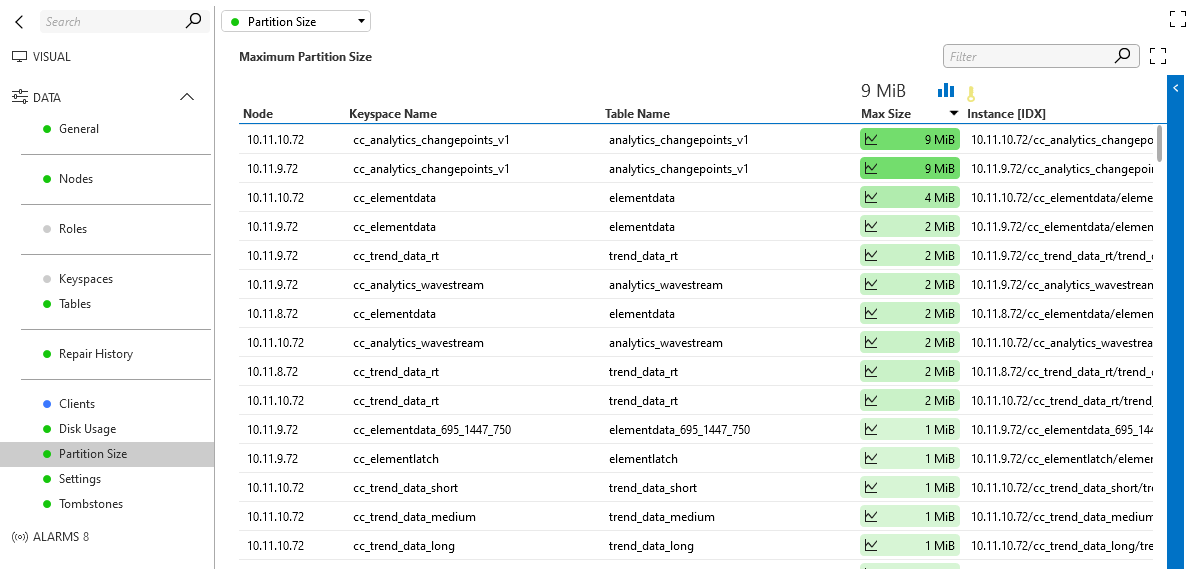 To keep your CPU and memory utilization in check during repair and compaction actions, it is important to keep your partition sizes under control. You can do so with the Maximum Partition Size table, where you will immediately see which tables are problematic. This table also requires Cassandra 4.0 or higher.
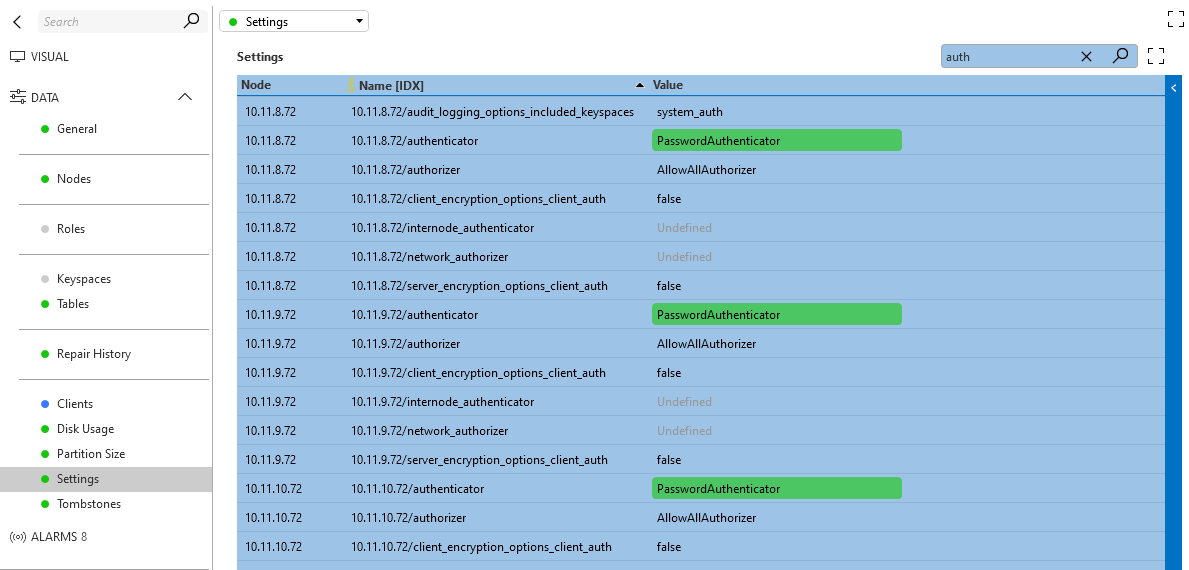 You no longer have to connect to all the nodes in your cluster via RDP to check your settings. This table shows which settings are configured on the nodes, and you can even configure alarm monitoring on it to ensure consistent settings throughout your cluster. This table also requires Cassandra 4.0 or higher.
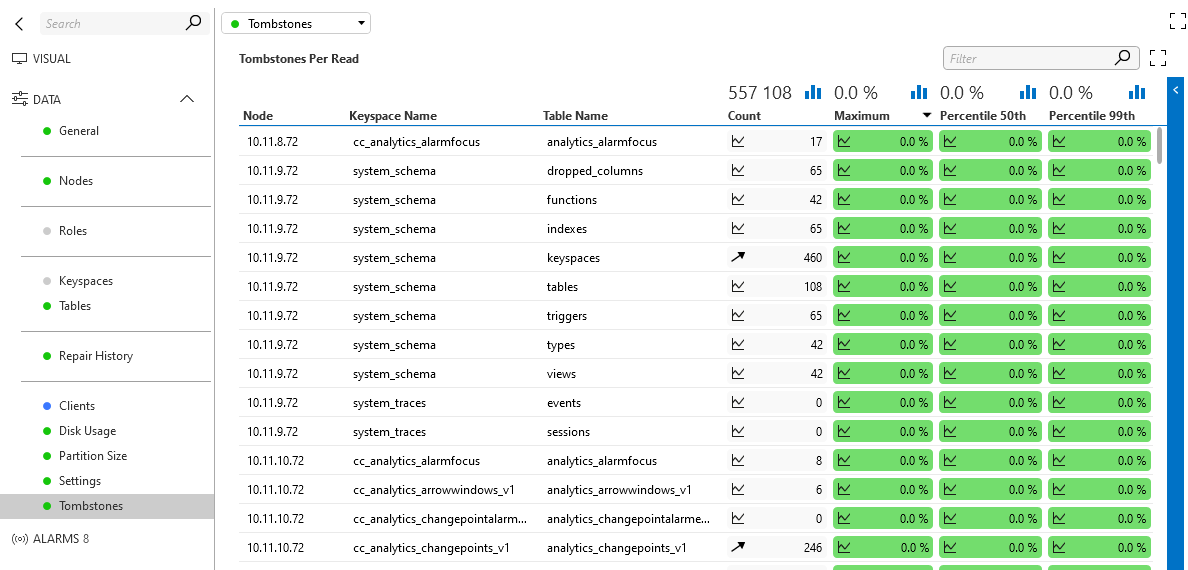 Tombstones in Cassandra can lead to large delays on your queries and could lead to system failure when certain thresholds are reached. The Tombstones Per Read table will help you keep the tombstones under control. Like the previous tables, this one also requires Cassandra 4.0 or higher.
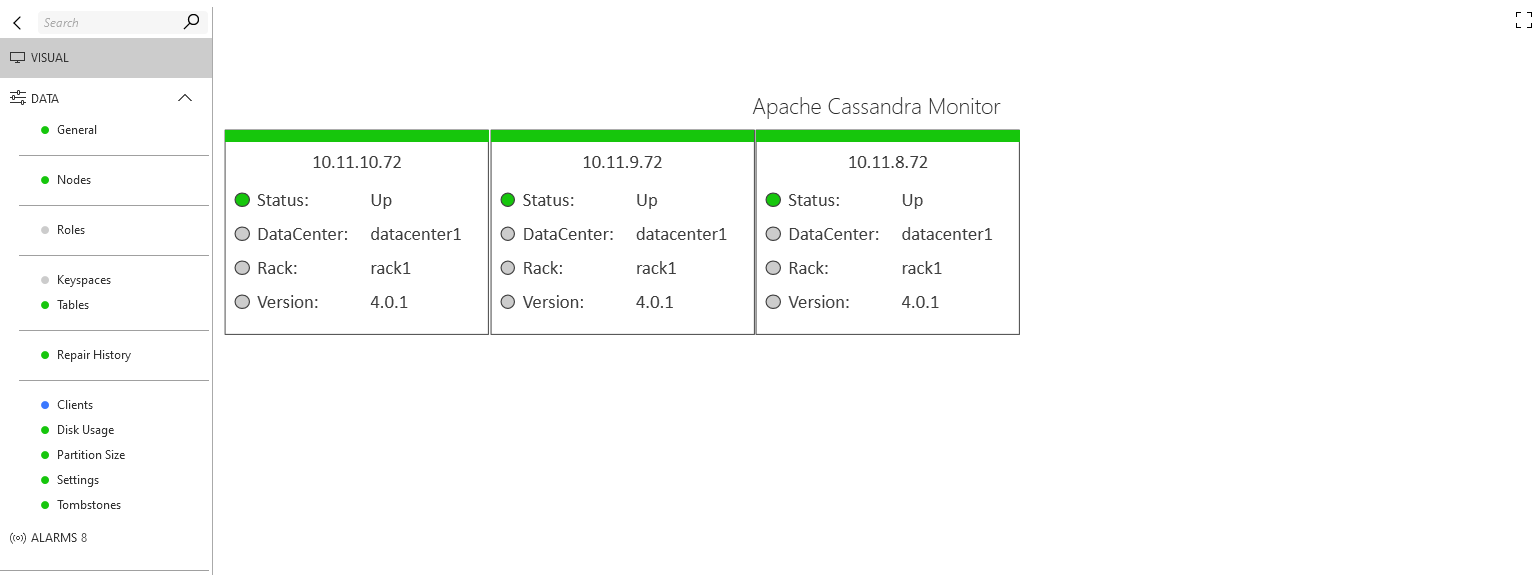
The default Visual Overview page shows a clear overview of the nodes in your system.
Tombstones in Cassandra can lead to large delays on your queries and could lead to system failure when certain thresholds are reached. The Tombstones Per Read table will help you keep the tombstones under control. Like the previous tables, this one also requires Cassandra 4.0 or higher.
The default Visual Overview page shows a clear overview of the nodes in your system.