Hi Team,
I’m looking to understand the technical backend workings of the "State Timeline" feature in DataMiner Dashboards—specifically how it retrieves and visualizes data from the backend.
We’ve encountered a couple of issues:
- A critical alarm was raised and lasted for approximately 5 seconds, but it was not reflected in the State Timeline bar. For context, we are using the "Severity" data type for this alarm in the timeline.
- In another instance, even after we have clear alarm, the State Timeline bar continued to show greyed-out data, which seems inconsistent with the actual alarm state.
Could someone help clarify how the State Timeline handles short-duration alarms and post-clear states? Any insights into the data polling or caching mechanisms involved would be appreciated.
Thanks in advance!
Best regards,
Avinash V
As this question has now been inactive for a very long time, I will close it. If you still want more information about this, could you post a new question?
Hi Avinash,
For the short alarm interval, is it still not visible if you customize the time range of the full time line (let's say to about 15 minutes or so)? Very tiny timeslots of different alarm color might be not visible for the eye if the relative width of the other color is too small. In that case though, you can mouseover it and it should highlight subparts anyhow: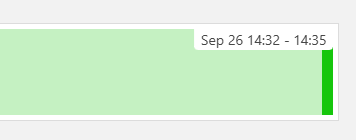
in this ^^ example the full bar is green, but it has an tiny red segment in it (which you cannot see). The mouseover highlight indicates the interruption (the highlight splits the bar in two) and should trigger the user for a zoom.
If that is not the case in your example and also for the second item you reported, I guess we'd better investigate the cases you had via our techsupport.
Many thanks Pieter!!
Let me check further.
I see that this question has been inactive for some time. Do you still need help with this? If not, could you select the answer (using the ✓ icon) to indicate that no further follow-up is needed?