Hi Dojo,
we are using self-developed drivers / connectors for some elements which have only a limited and simple set of parameters. For some of these parameters we have trending activated in a trend template (real-time & average). But all we see is the real-time trend data, and no long term average data.
In the system settings we’ve set the TTL of the real-time trend data to 2 days (instead of default 1 day), and this has an effect on the trend graph as expected!
What may be the root cause for the missing average trend data? We’ve already checked the driver implementation and compared it to other drivers, also self-developed, where trending is working just fine.
Any ideas where to look at? Thank you very much! 🙂
Edit:
Meanwhile, we have discovered that the data type defined in the driver was the root cause for this issue. In the driver which was having trouble with trending this was set to “string” for numerical values we wished to trend – this was now set to “double” and trending looks good!
<Param id=”34″ trending=”true”>
<Name>Delay_1</Name>
<Description>Delay_1</Description>
<Type>read</Type>
<Information>
</Information>
<Interprete>
<RawType>numeric text</RawType>
<Type>double</Type> <- this is where the change was made
<LengthType>next param</LengthType>
</Interprete>
<Alarm>
<Monitored>true</Monitored>
</Alarm>
<Display>
<RTDisplay>true</RTDisplay>
<Positions>
<Position>
<Page>General</Page>
<Column>0</Column>
<Row>2</Row>
</Position>
</Positions>
<Units>ms</Units>
</Display>
<Measurement>
<Type>number</Type>
</Measurement>
</Param>
H Nils,
Thank you for reaching out to us.
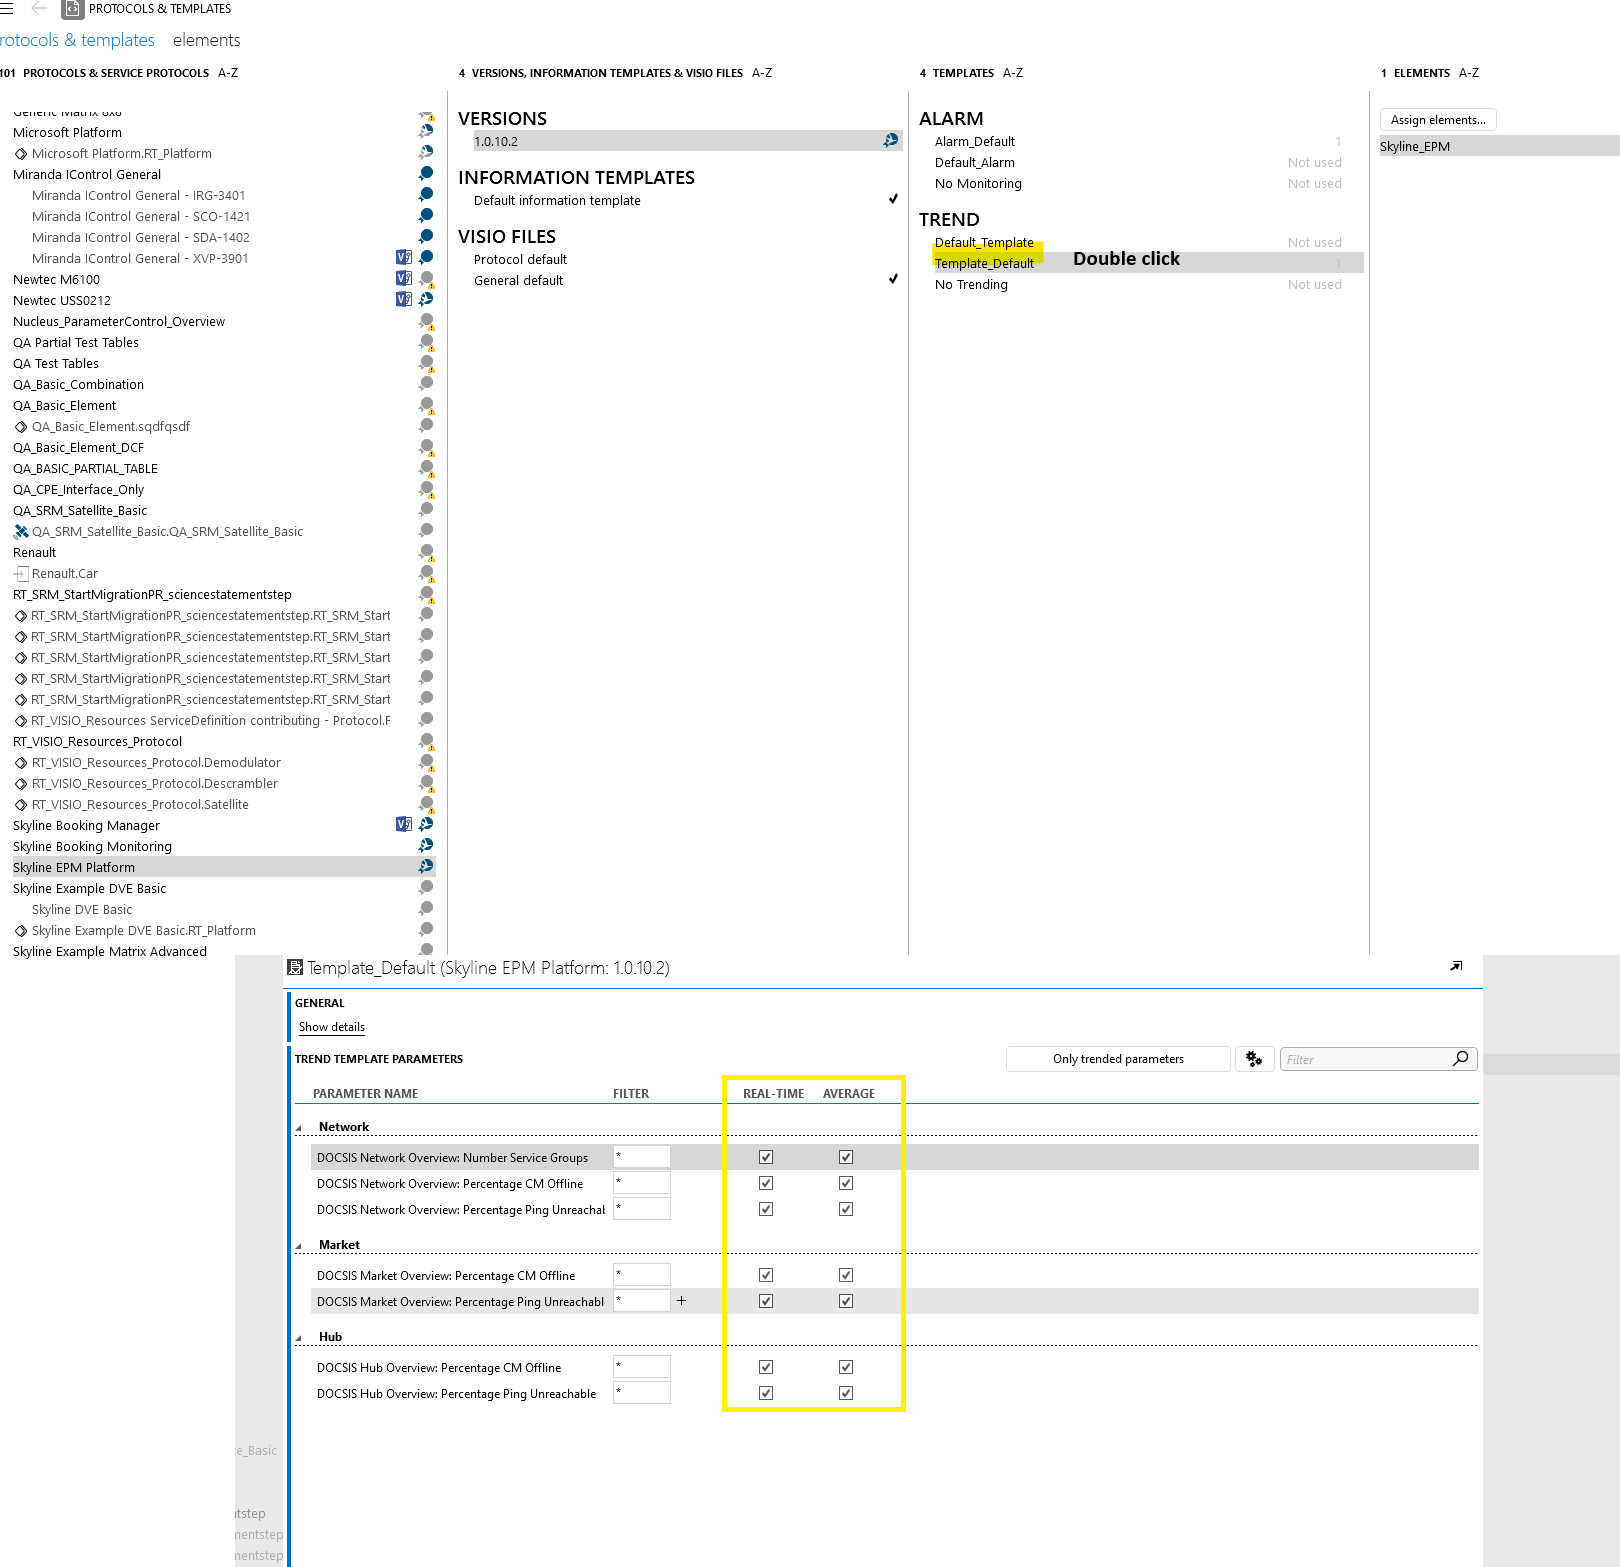
How is the trending template defined on your connectors?
Could you verify that the average trending is enabled?
Example:

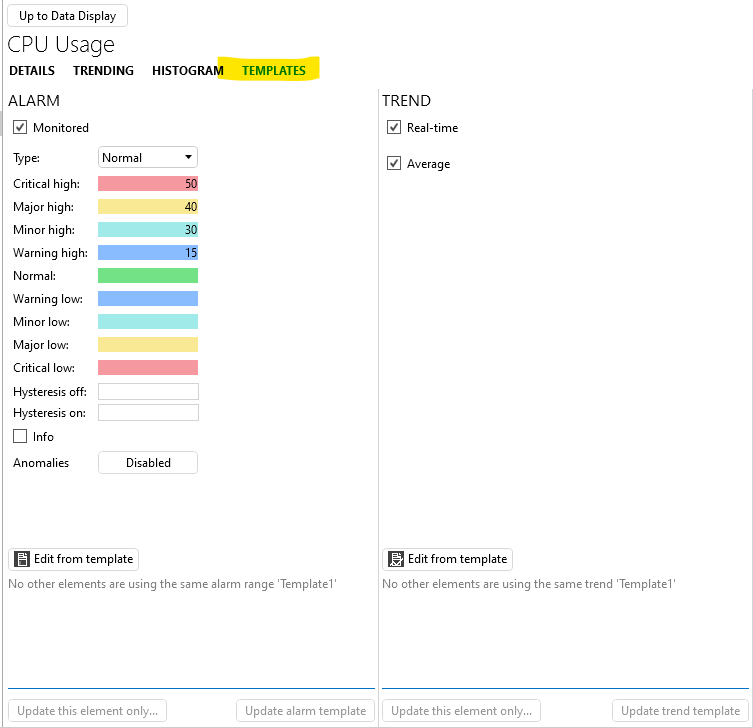
Other way to configure it is when drill down on the parameter and go to the templates tab.
Example:

Also, can you see the trending icon or an arrow on your trended parameters in the element data display?
Example:

Hope this helps you further.
Hi Matthias,
thank you for your input! Both is the case. I’ve added two more screenshots in the initial question to show that the configuration seems to be valid…
BR
Nils
Hi Nils. I think it would be better now is to create a support ticket as it is not straight forward to pinpoint the root cause of the problem you encountered.
Hi Matthias,
I’ve just created a support ticket. Thank you!
BR
Nils
Hi Nils,
I assume you do not have any overrides configured neither? Overrides can be used to configure dedicated trend/TTL settings per protocol or version apart from the DMS defaults. See this link in the documentation pages.
The TTL settings are stored in the file DBMaintenanceDMS.xml. It might be worth to check this file as well on all DMA’s in your DMS to see if there aren’t any unexpected TTL settings in there.
Lastly you could use the Trend Data Inspector to consult the raw trend data for that specific element to see if there are really no average trend records available or if for some reason they cannot be loaded in the client.
In case you can’t figure it out, suggest to raise a support ticket.
Cheers,
Koen.
Hi Koen,
thanks for reaching out!
– indeed, no overrides are configured (see screenshot above).
– the DBMaintenanceDMS.xml files are identical on all our DMAs and are looking unsuspicious in the section related to trending
– the Trend Data Inspector shows that there is real-time data, but it seems that there is no average data stored in the database? Two screenshots above, one is showing proper RTD, whereas there is no AVG data in the same timeslot (as well as further back in the past [last week] – same output of the inspector). So I’m assuming that indeed no AVG data is stored in the DB (?).
So should we move this to a support ticket / task?
BR
Nils
Hi Koen,
I’ve just created a support ticket. Thank you!
BR
Nils
Great to hear you’ve found the root cause. Interprete type ‘String’ would indeed result in processing the value as a string, which makes it difficult to ‘average’. Thanks a lot for sharing the solution to this problem