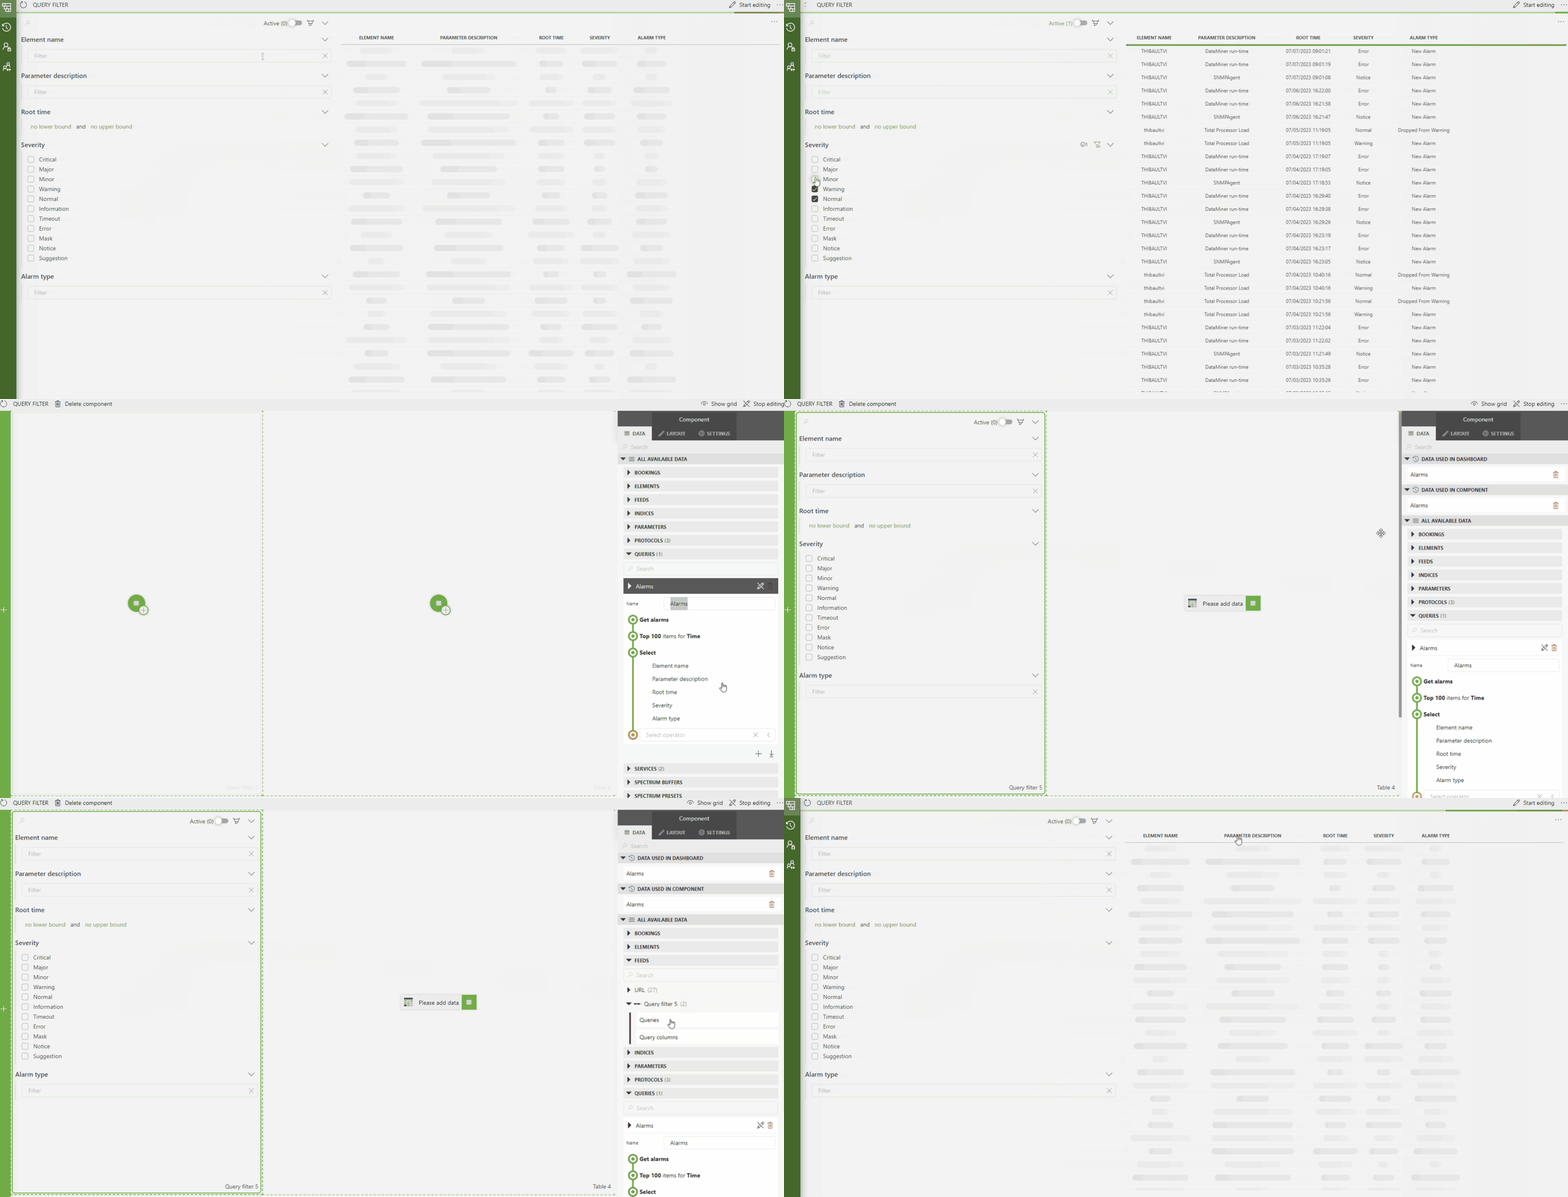
In a world fueled by data, the ability to efficiently explore and analyze vast amounts of information is crucial. Data filtering plays a vital role in this process, enabling users to extract relevant insights quickly. If you’re familiar with the Dashboards app or Low-Code Apps module, you’re likely aware of the various ways to filter data and gain valuable insights. Introducing the query filter: one of the most powerful and versatile tools to accomplish this, about to emerge out of its soft-launch phase!

What is the query filter component?
The query filter component serves as a gateway for filtering and refining data. It acts as an intermediary between the raw dataset and other components, enabling seamless integration and facilitating a smooth data flow.
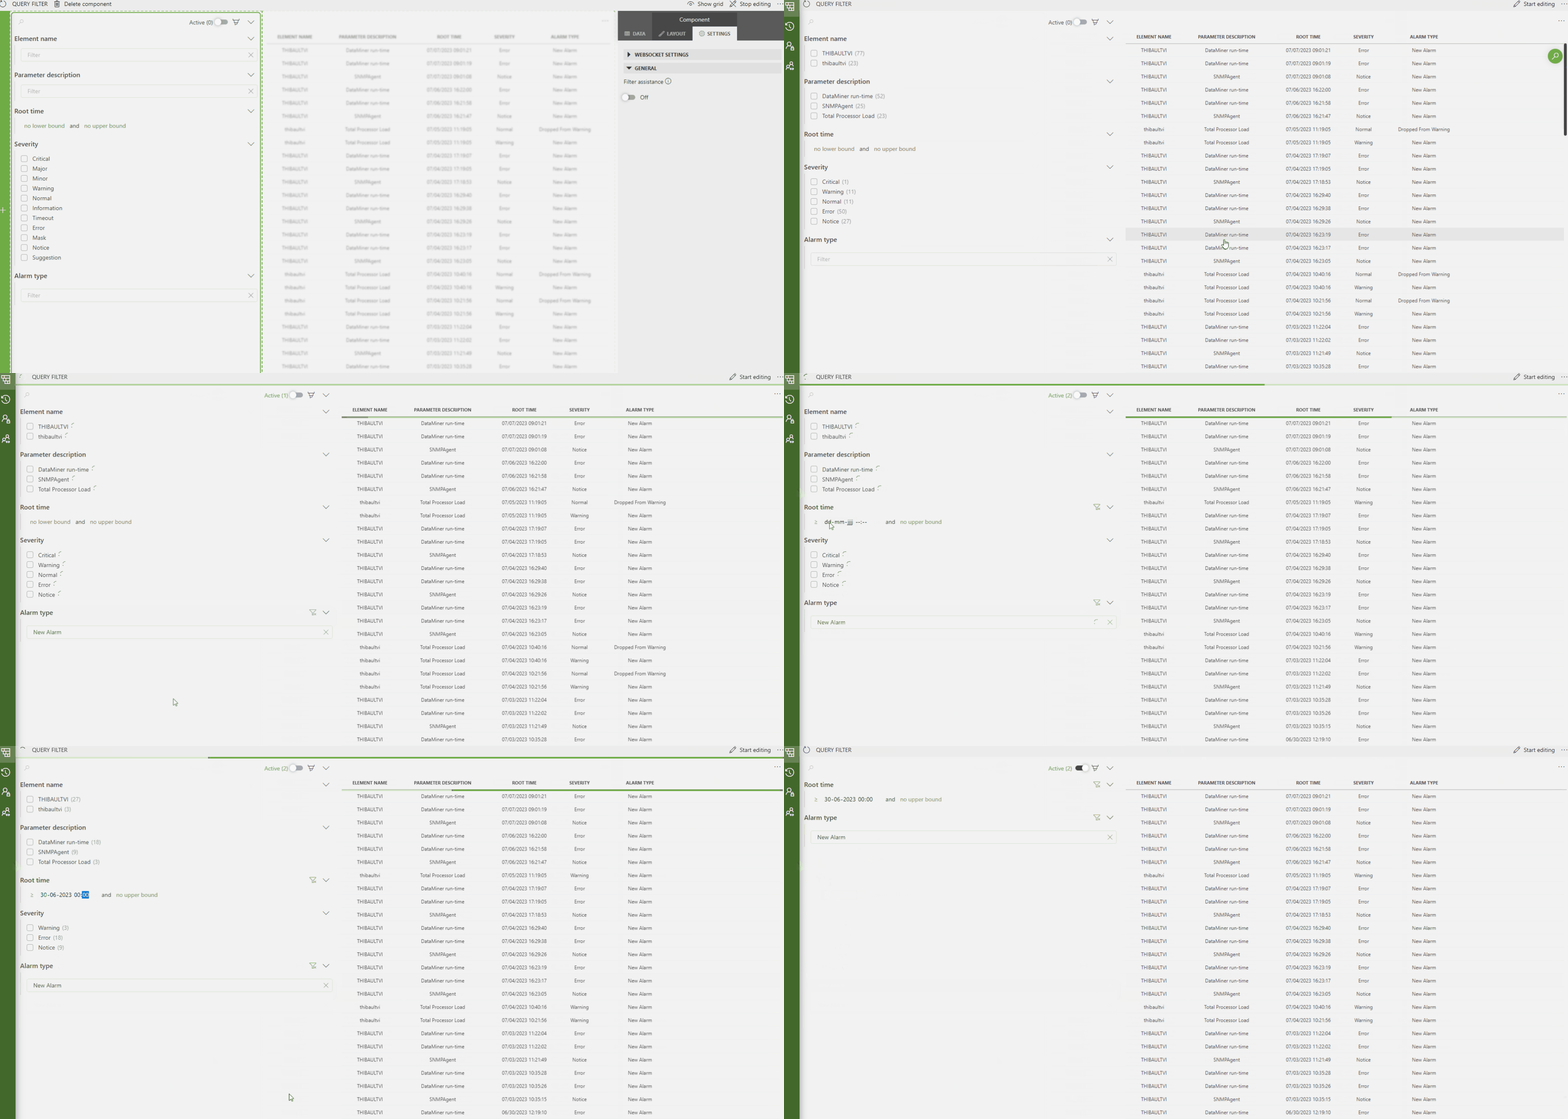
The primary functionality of the query filter component is to filter data based on specific criteria. The component receives a query, constructed in the query builder of your dashboard or low-code app, and presents a suitable filter for each column in the query result. Depending on the data type of the column, the filter can manifest as a text input field, a range filter, a list of checkboxes, and much more. It outputs a new query that incorporates additional filter nodes, starting from the original query result. This new query can then be consumed by other components using a feed.
⭐ TIP ⭐
Want to read up on queries? Take a look at our documentation about GQI!
Another notable feature of this component is the filter assistance setting. By enabling this setting, you can unlock valuable information and enhance the functionality of your query filter. The specific assistance provided varies based on the data type. This can range from smart suggestions when typing in your filter to displaying the frequency of occurrence for certain options within the dataset.
Using the filter assistance setting might have an impact on performance, especially when dealing with larger queries. However, the added value it brings to an already useful component is substantial.

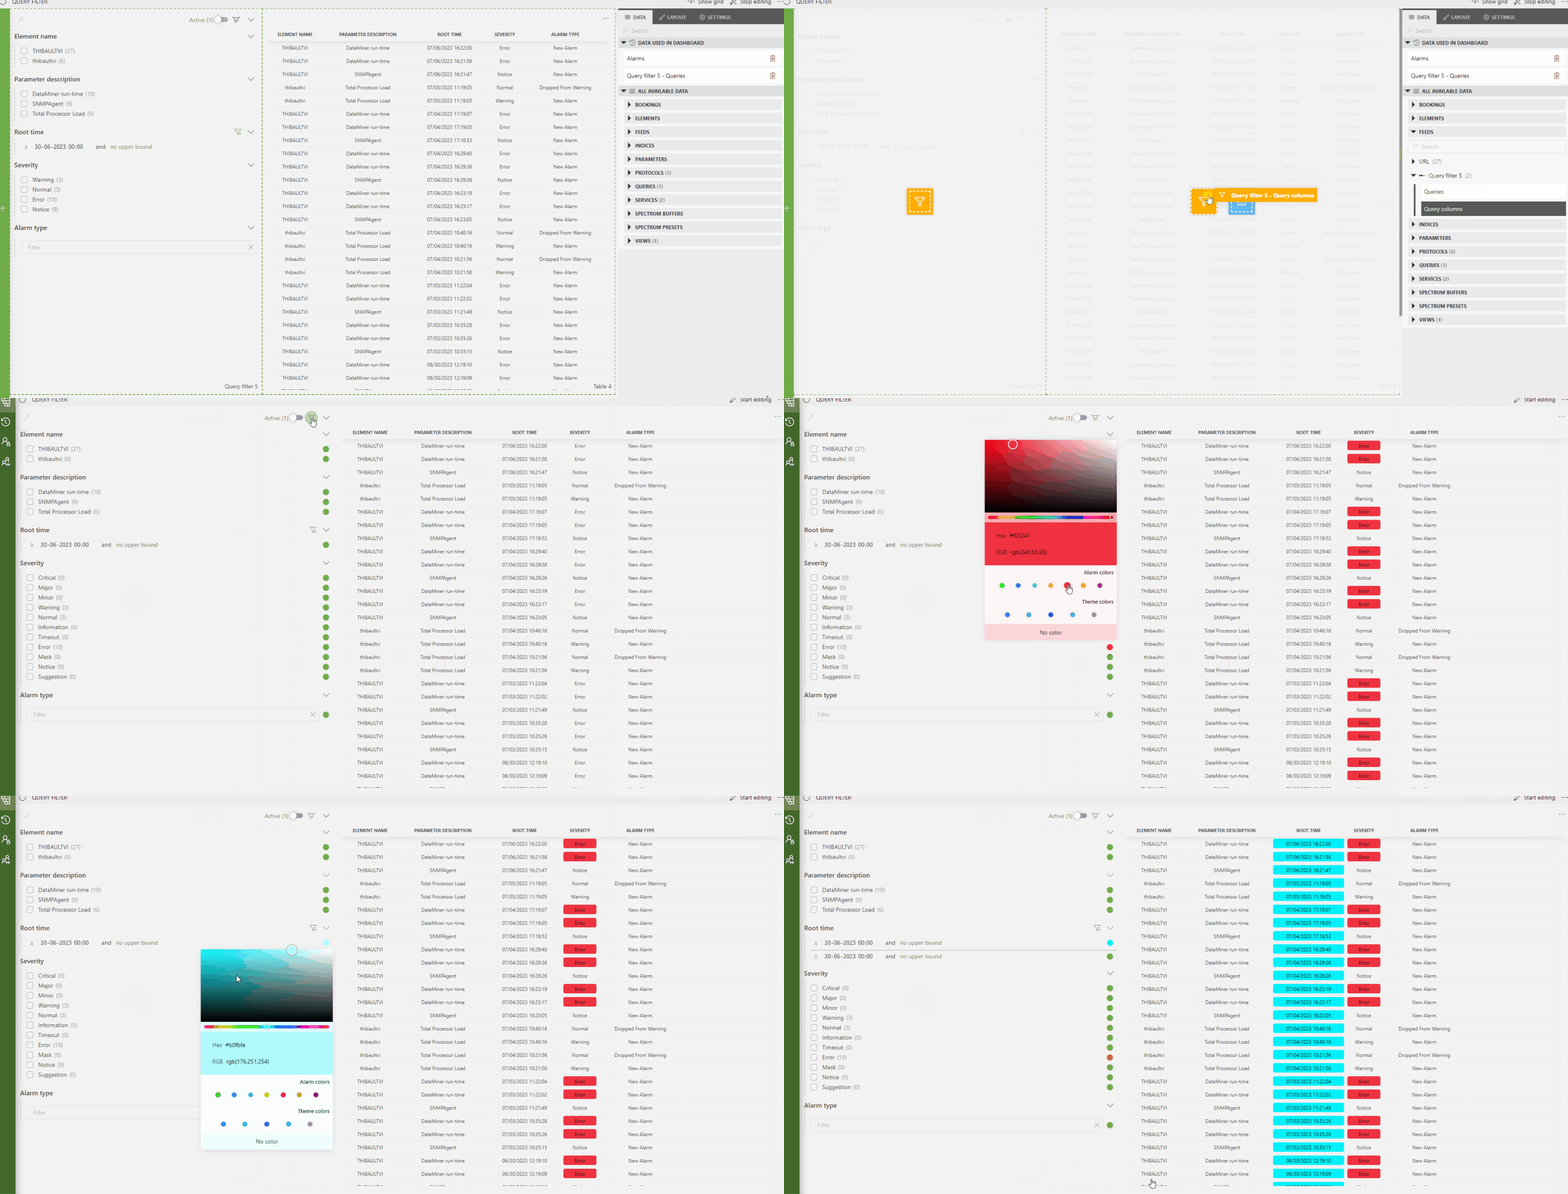
In addition to filtering data, the query filter component offers a significant enhancement in the form of conditional coloring on columns. This feature enables users to apply visual highlighting to specific data points based on predefined conditions. This not only improves data visualization but also aids in quickly identifying trends and outliers.

Benefits and applications
The query filter component offers a range of significant benefits and finds applications across various domains:
- Improved data analysis efficiency: By enabling users to filter data, the query filter component accelerates the analysis process. The component helps you to quickly narrow your focus, eliminating irrelevant data and concentrating on key insights. The fact that you can use different subsets of data for different visualizations while using just one query also enhances the efficiency and usability of Dashboards and Low-Code Apps.
- Enhanced data visualization: With the query filter component’s ability to apply conditional coloring on columns, you can create visual representations that highlight specific patterns, trends, or exceptions. This feature greatly enhances the clarity and impact of data visualization, making it easier to understand and effectively communicate findings.
- Increased interactivity: Integrating the query filter component with interactive data exploration tools empowers you to dynamically adjust the filters and instantly see the updated results. This real-time interactivity promotes a more exploratory and iterative analysis approach. Additionally, the ability to refine data within a visualization without altering the original query in the query builder provides an extra layer of interactivity for all users with access to the dashboard or low code app.
In the realm of data exploration and visualization, the query filter component stands as a powerful and useful tool. By facilitating data filtering and incorporating conditional coloring on columns, it helps you to efficiently explore, analyze, and present data insights. Its seamless integration with other components enhances the overall data exploration experience, providing more people with an easier way to visualize and filter their data according to their specific needs and preferences. The query filter is available starting from DataMiner 10.3.9.
I’ve been using the soft-launch version of the query filter and can confirm it’s an essential piece in your data visualization! Great job team!