solution Use Case
Water gateway management
With the growing adoption of smart water meters across utility networks, it became essential to have a solution capable of collecting, normalizing, and monitoring water consumption data in real time from devices supplied by different manufacturers. Each model may send MQTT messages with distinct payload structures, making centralized integration and analysis challenging. In addition, the system needed to ensure reliability, scalability, and flexibility to handle thousands of IoT devices transmitting simultaneously.
Solution
The implemented solution leverages DataMiner as the central platform for managing and monitoring smart water meters, using an MQTT Client element to receive and process messages published by the field devices.
This element acts as the communication gateway between the IoT devices and the management layer. It decodes the incoming MQTT payloads and translates them into structured and meaningful parameters such as accumulated consumption, battery level, and anomaly or communication alarms.
Approach
The architecture was designed with flexibility and modularity in mind. The MQTT Client element within DataMiner is implemented as an independent layer responsible for receiving and normalizing data from the field devices. It can be easily modified to handle any payload structure, regardless of the water meter model or manufacturer.
This design ensures that all incoming MQTT messages are parsed and standardized into a common data format before being processed by subsequent layers of the monitoring workflow. The normalized data is then visualized using the DataMiner Low-Code Apps module, allowing operators to monitor consumption trends, leak detection, fault alarms, and device connectivity. The integration also includes configurable alarm thresholds and historical data logging for auditing and performance analysis.
Outcome
The application delivers a unified and reliable view of the entire smart water meter network, significantly reducing integration effort and improving field diagnostics. By using DataMiner as the orchestration and analytics layer, the solution automates the monitoring of thousands of IoT devices, optimizing response time to events and providing valuable operational insights for water consumption management.
Thanks to the flexible parsing structure, new meter models can be onboarded with minimal configuration effort, ensuring scalability, maintainability, and long-term adaptability of the solution.
USE CASE DETAILS
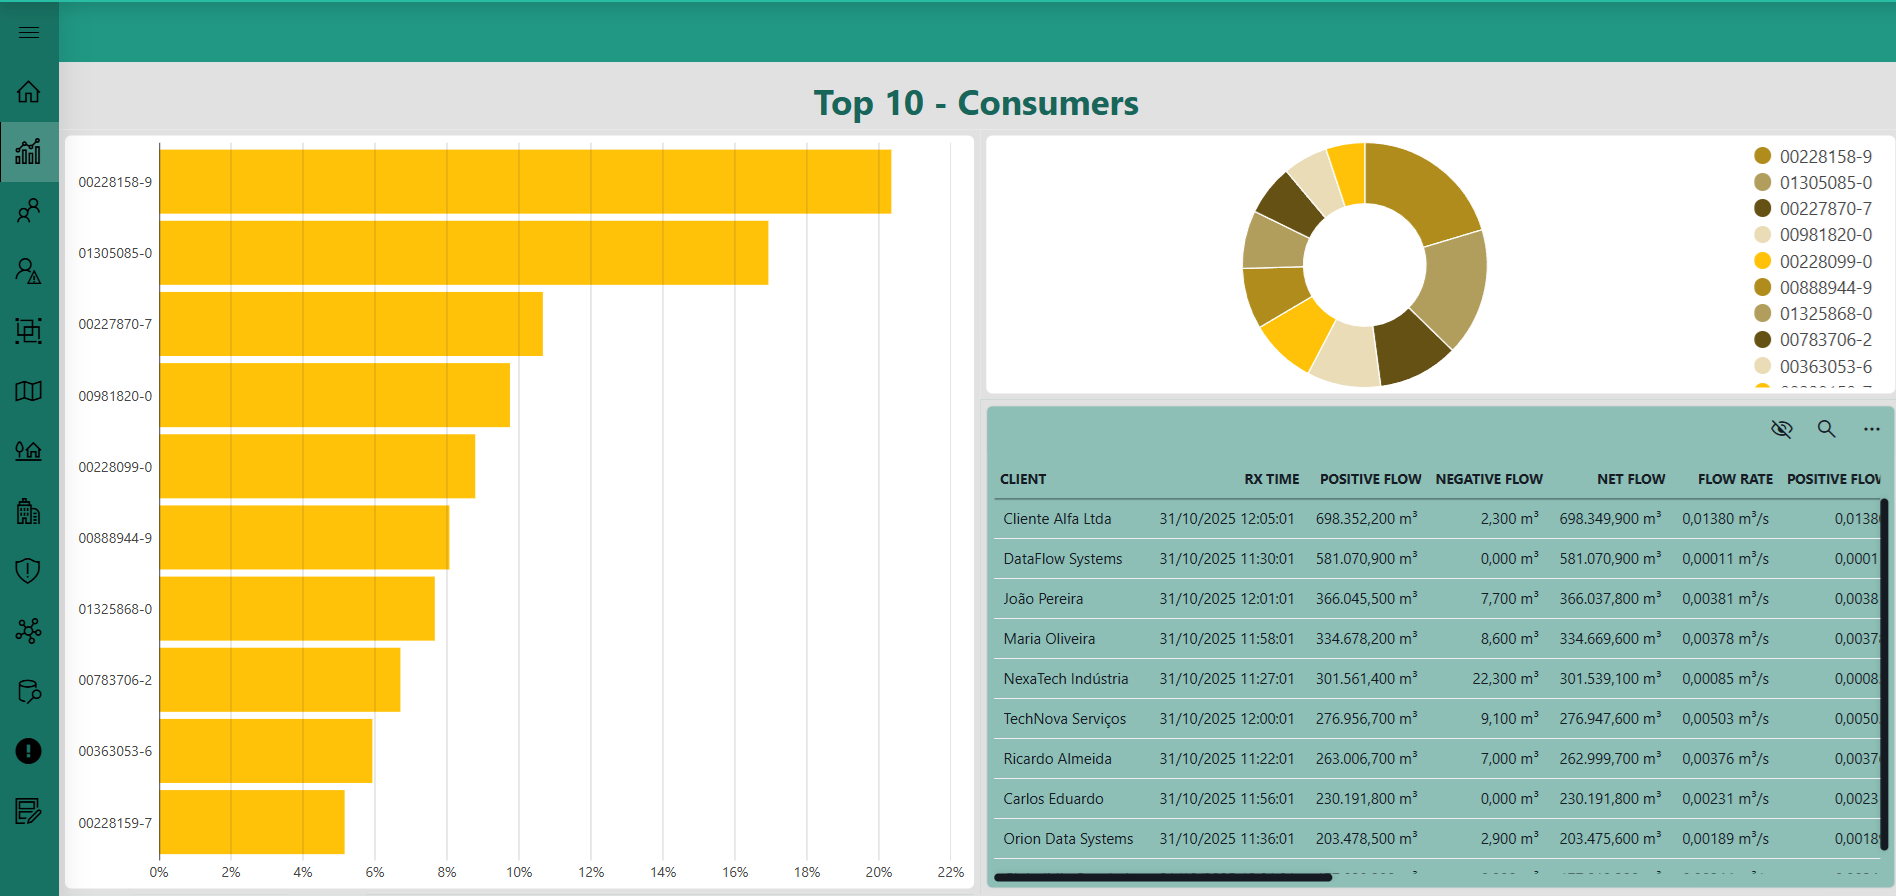 This low-code app page shows the top 10 water consumers clients based on their total accumulated usage. It includes charts and a summary table that highlight the customers with the highest consumption, providing a clear and immediate overview of usage distribution across the monitored network.
 The Consumers page serves as the primary overview and management interface for client data. On this page, you can view a comprehensive list of all monitored clients, along with key status information such as connection details (RX Time, Battery) and active alarms. A key feature is the Client Data panel, which allows you to edit specific client-related information. The main table displays summarized data for all consumers, and when you double-click a client's entry, a detailed client-specific page opens a Client Panel.
This detailed view provides in-depth information about the selected consumer, including an Alarm History section that chronologically lists all past and present alarms, specifically noting recurring issues like "Possible Leak Pulse 1." Furthermore, the page presents Daily Consumption data and a corresponding Consumption graph, offering a clear visualization of the client's historical water usage patterns. A crucial functionality is the Generate Report button, which allows you to create a PDF report for a chosen time interval. This report is enhanced with an Artificial Intelligence-driven analysis of the consumption and alarm data, designed to "assist" your data analysis process by highlighting potential issues or trends.
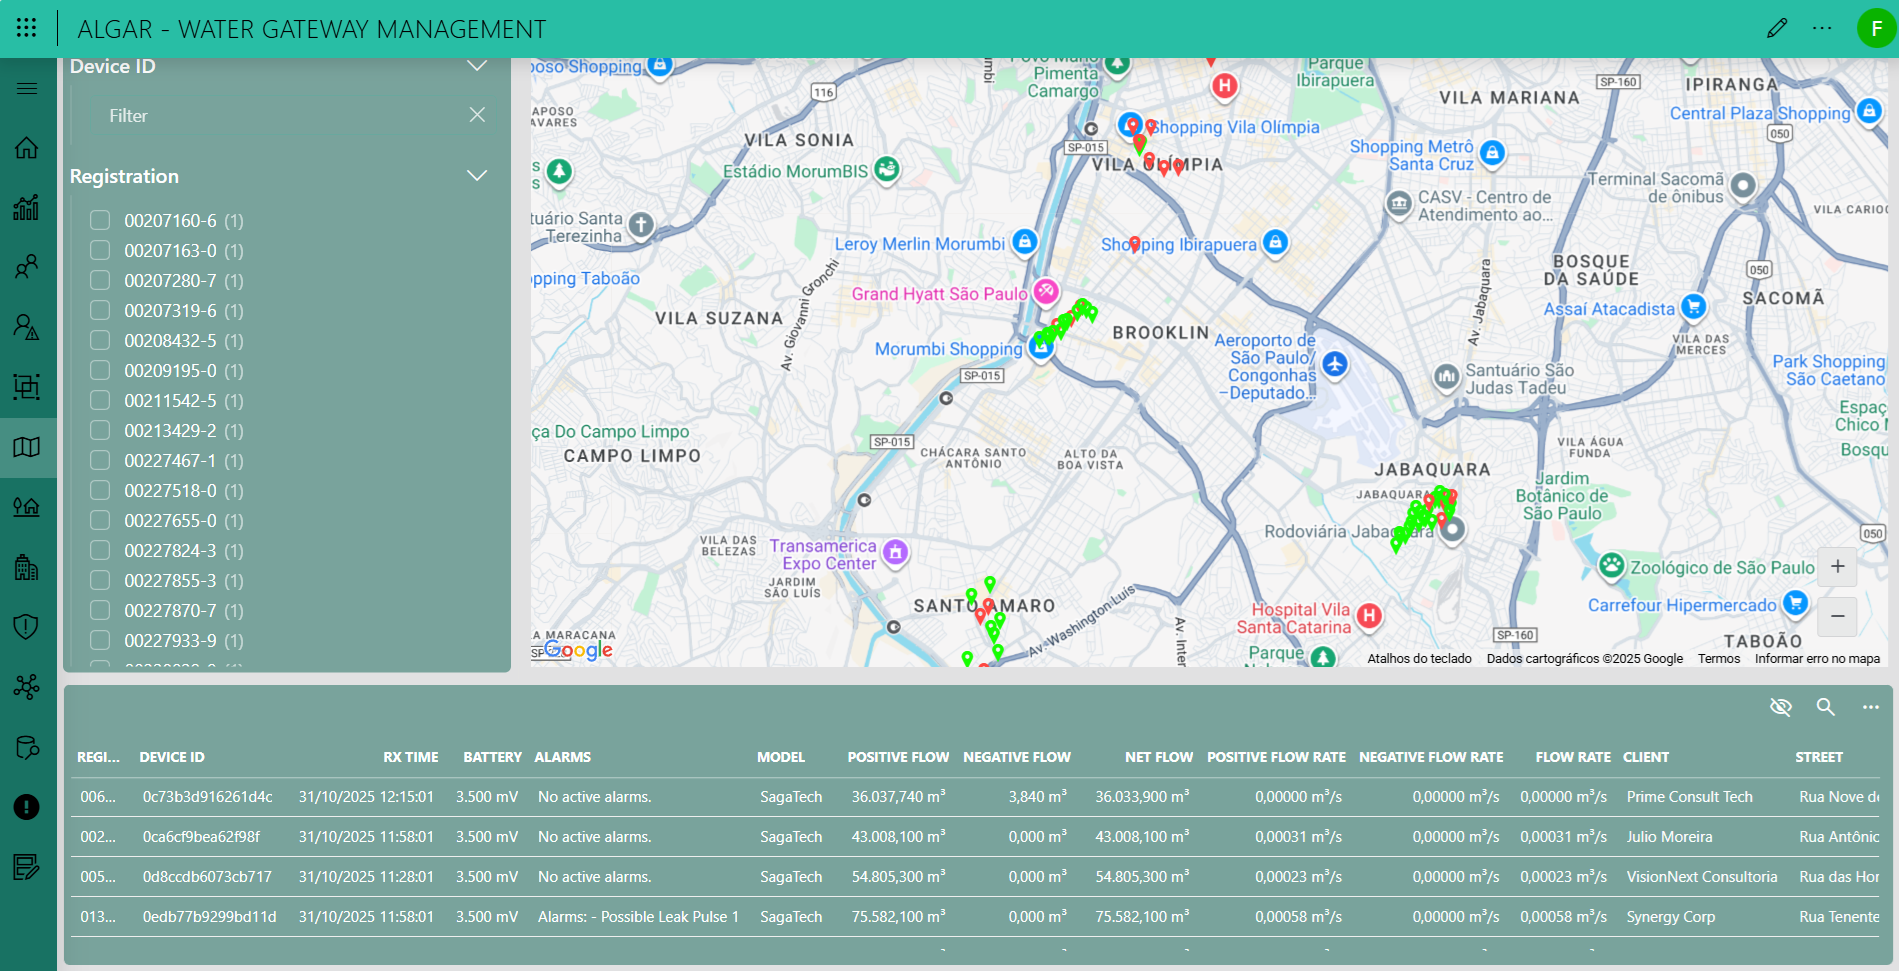
The Map page provides a complete geospatial visualization of the water gateway network. It plots all active devices on a map, using color-coded icons to represent their real-time status (e.g. normal or in alarm). Below the map, a detailed data table lists key metrics for each device, such as flow rates, battery level, and specific alarms, enabling you to quickly assess the health and performance of the infrastructure.
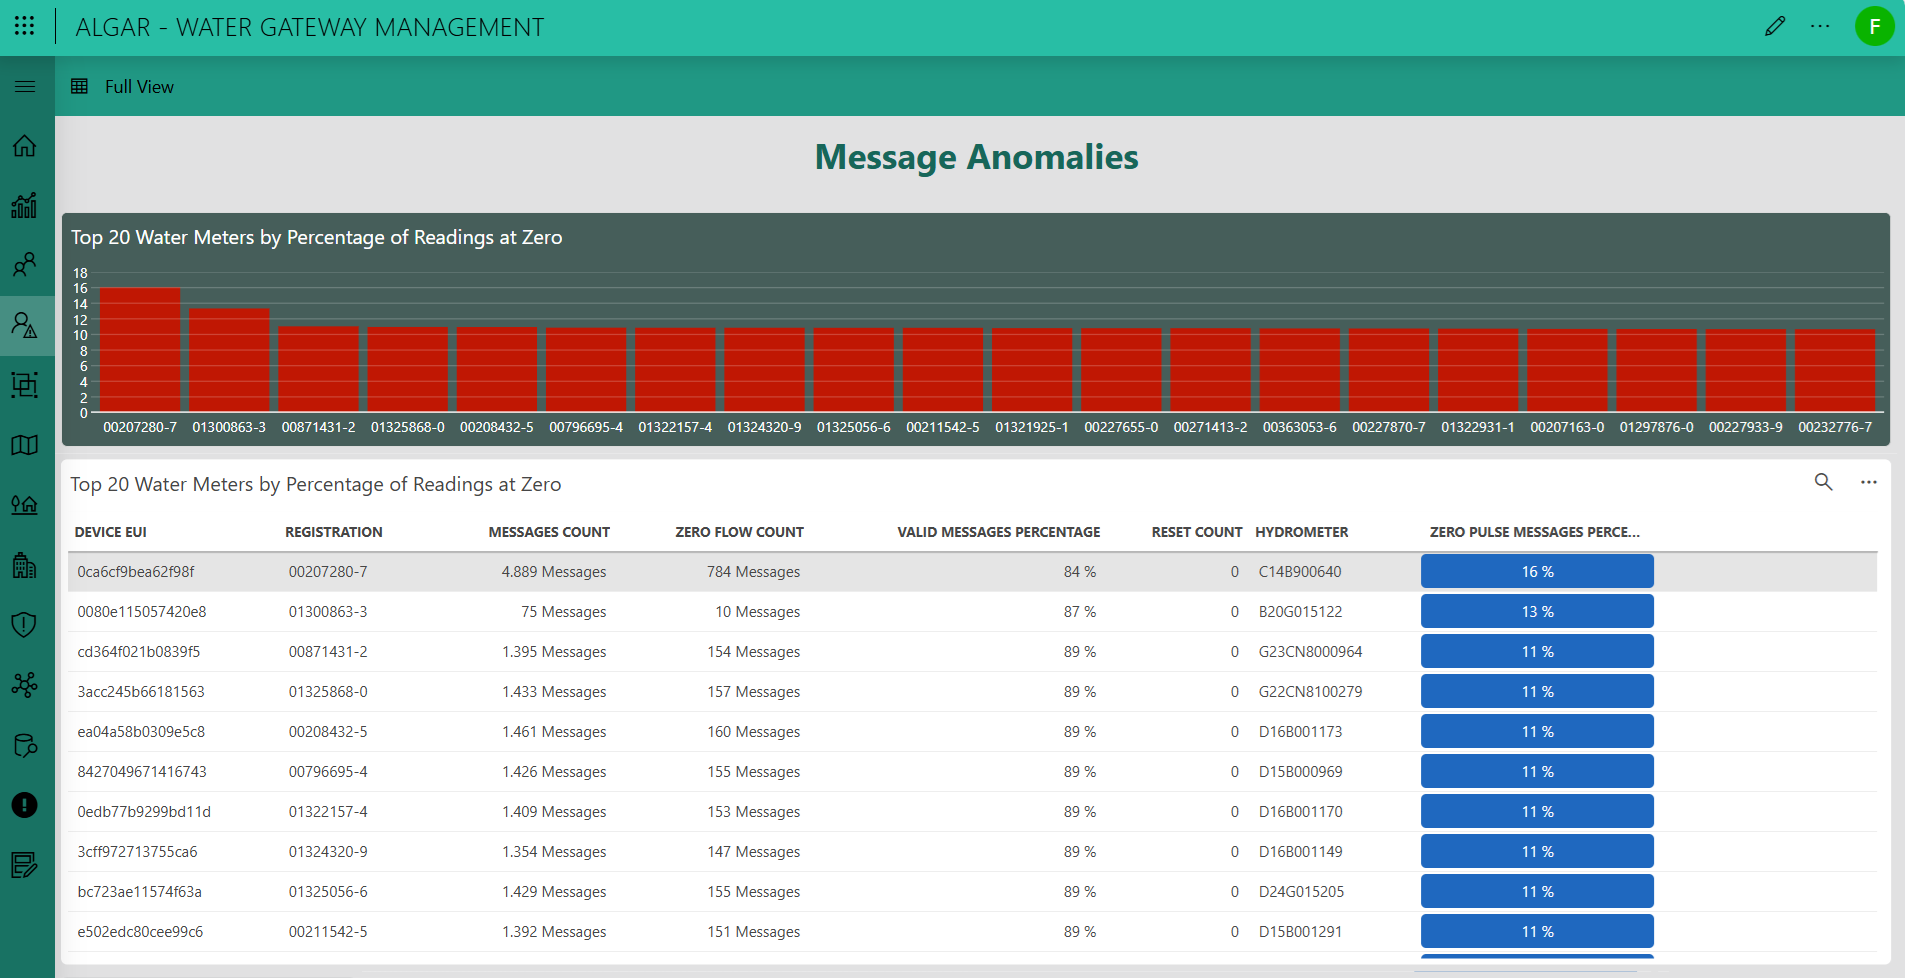 This screen displays the top 20 water meters with the highest percentage of zero-flow readings.
The bar chart and table highlight devices that frequently report zero values, allowing you to identify potential communication issues, sensor malfunctions, or periods of inactivity.
Each record shows message count, percentage of valid data, reset count, and hydrometer ID, providing a clear overview of message integrity and operational anomalies across the monitored network.
This screen displays the top 20 water meters with the highest percentage of zero-flow readings.
The bar chart and table highlight devices that frequently report zero values, allowing you to identify potential communication issues, sensor malfunctions, or periods of inactivity.
Each record shows message count, percentage of valid data, reset count, and hydrometer ID, providing a clear overview of message integrity and operational anomalies across the monitored network.
 The Streets page offers a geographical and analytical perspective on the monitored water distribution network. By aggregating the data collected from individual smart meters, this interface presents key performance indicators grouped by street, including total and average consumption, alarm occurrences, and flow balance metrics. The visual layout — combining interactive charts and detailed tables — enables you to quickly identify consumption trends, detect anomalies, and evaluate network efficiency across different urban areas. This consolidated view plays a central role in helping utilities make data-driven operational decisions, prioritize maintenance activities, and ensure a more efficient and sustainable water management process.
 The Neighborhoods page offers an aggregated perspective on the water distribution network at the neighborhood level. It presents key metrics — such as total and average consumption, alarm occurrences, and flow balance — through interactive charts and detailed tables. This page helps you identify consumption patterns, detect anomalies, and evaluate overall network performance, supporting informed operational decisions and efficient water management.
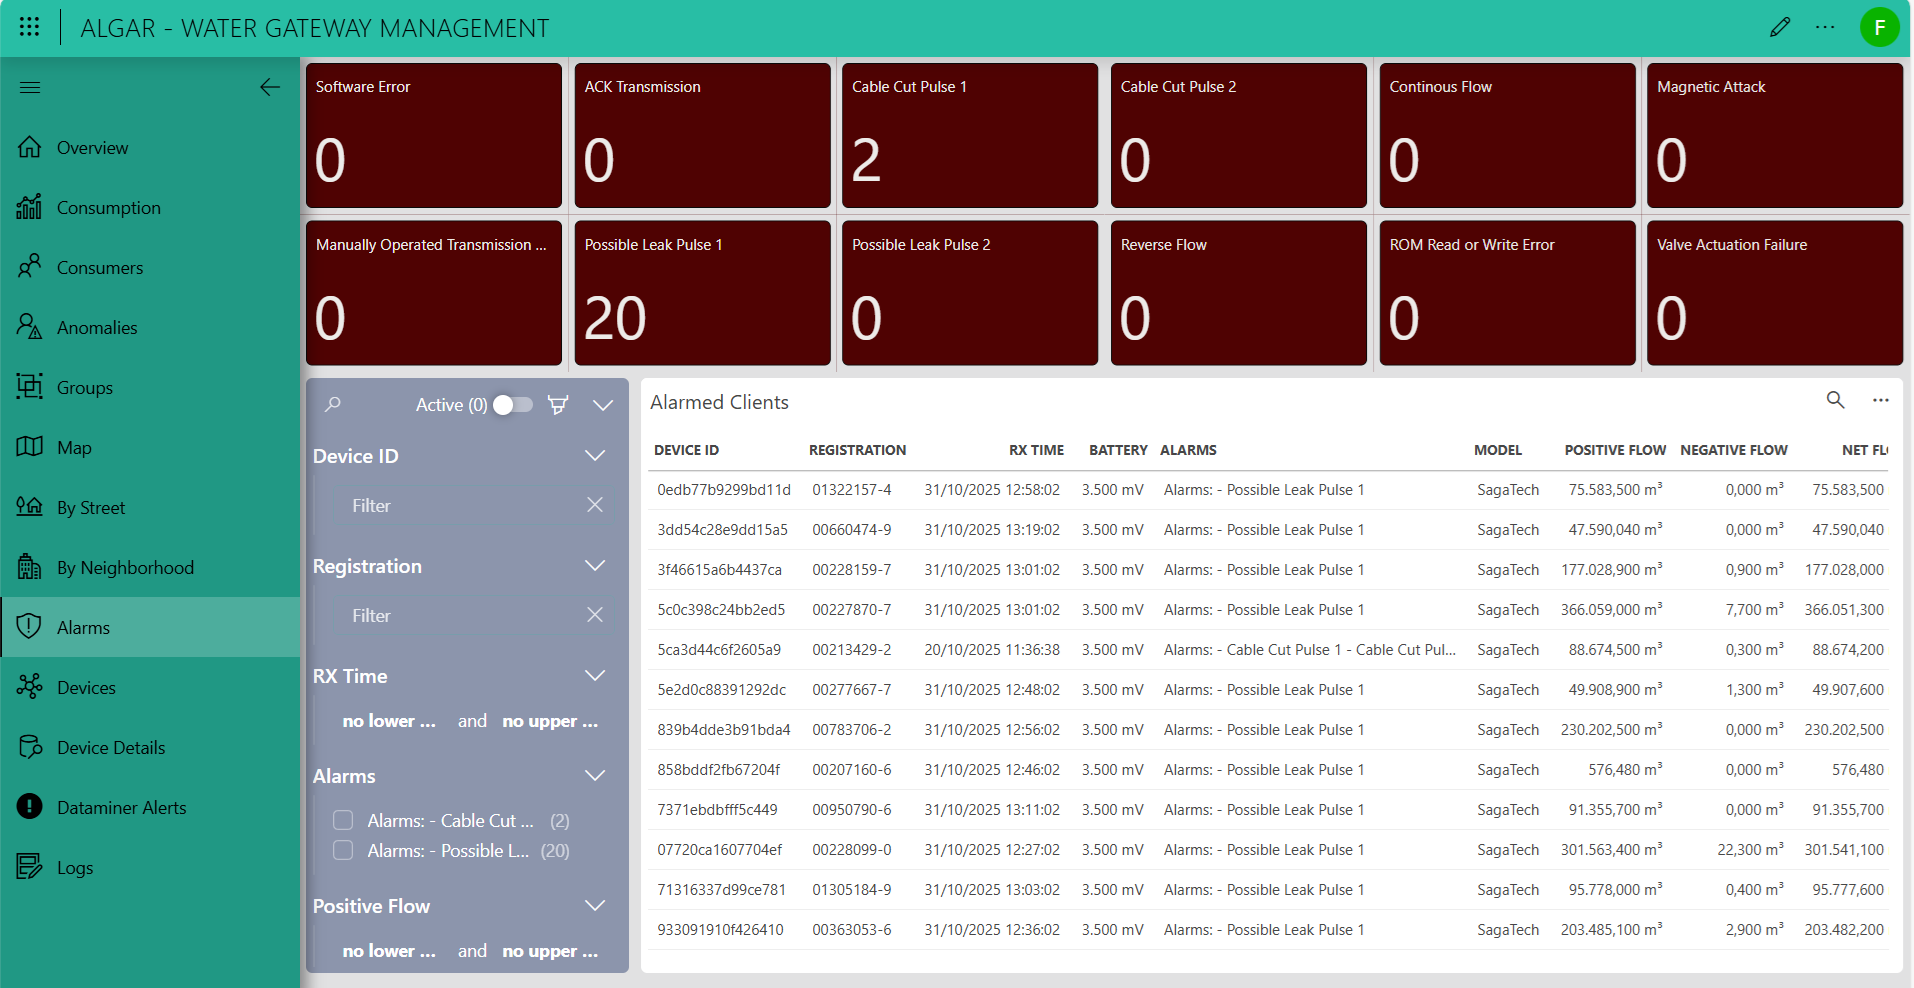 The Alarms page provides a real-time monitoring interface for the water distribution network, highlighting active alerts from smart meters. Key alarm types — such as possible leaks, cable cuts, and flow anomalies — are visualized as tiles that show total counts for quick identification. A detailed table lists all alarmed devices, showing device ID, registration, last communication time, battery level, active alarms, flow measurements, and model information. Filters and search tools allow you to quickly locate specific devices or alarm types, enabling fast response, root cause analysis, and proactive network maintenance.
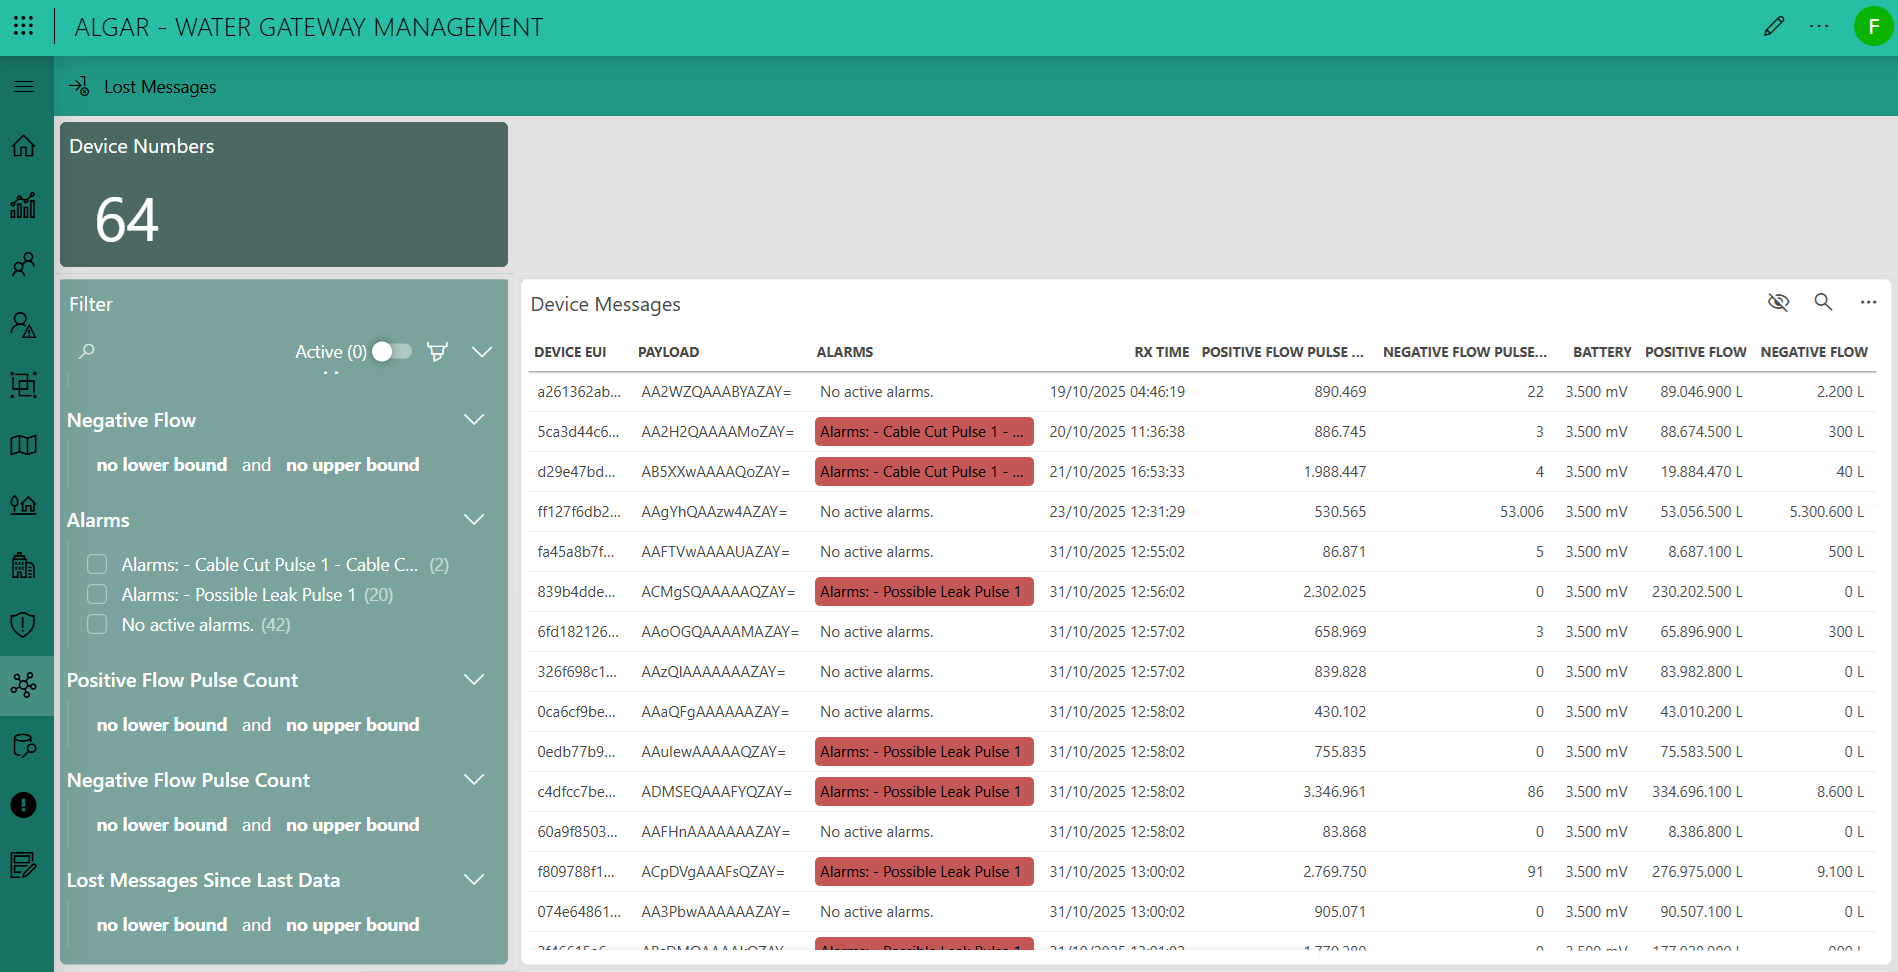 This page serves as a technical validation layer, providing a detailed look at individual device data prior to its association with a specific client. It uniquely displays the encoded payload in its hexadecimal format, allowing engineers to verify the incoming data stream. Alongside this, it presents key metrics that have already been processed and normalized by DataMiner, such as flow rate, battery level, etc. This intermediate view is critical for diagnostics, troubleshooting, and ensuring data integrity from the field. The page features robust filtering capabilities, enabling you to query and isolate devices based on their ID or any other reported parameter.
 The Device Data page is the central interface for comprehensive historical tracking and deep analysis of individual water meter performance. You initiate the process by searching for a specific device using its unique Device EUI (Extended Unique Identifier) or, if applicable, a registered serial number in the Registration field. Upon selection, the application retrieves and displays the device's complete historical message log and associated telemetry. The page prominently features the total consumption for the last 30 days and visualizes daily usage patterns through a Daily Consumption graph. Below the graph, a detailed table provides the Daily Consumption history, itemizing the consumption in liters, the number of messages received (Messages Count) for that date, and a flag for any possible anomaly detected by the system, alongside the final adjusted consumption. Beyond the core consumption metrics, the interface provides dedicated navigation tabs or panels for specialized data review. These include viewing the RSSI history for network signal strength analysis, examining the full list of raw messages, checking the integrity of message sequencing via the Counter UP history, and reviewing the record of all security or usage-related alarms. Furthermore, a sophisticated AI insights feature allows the system to generate a detailed report from the historical measurements, which is then processed by an Artificial Intelligence engine to evaluate complex patterns, detect advanced anomalies, and generate a final predictive and analytical report.
1 thought on “Water gateway management”
Leave a Reply
You must be logged in to post a comment.
Max, this article is excellent! I greatly admire the clarity with which you explained the complexity of integrating smart water meters from different manufacturers. The way you highlighted the flexibility and scalability of DataMiner demonstrates not only technical knowledge but also a solid vision for the future of sustainable water management. It’s inspiring to see how this achievement reflects the collaborative effort of everyone at NGN, which makes these innovations possible and truly makes a difference!