example Use Case
Video Services SLA Management
5G
ABR
PON
IPTV
HFC
DVB-C
OTT
FWA
RabbitMQ
Agama
Bridge Technologies
Touchstream
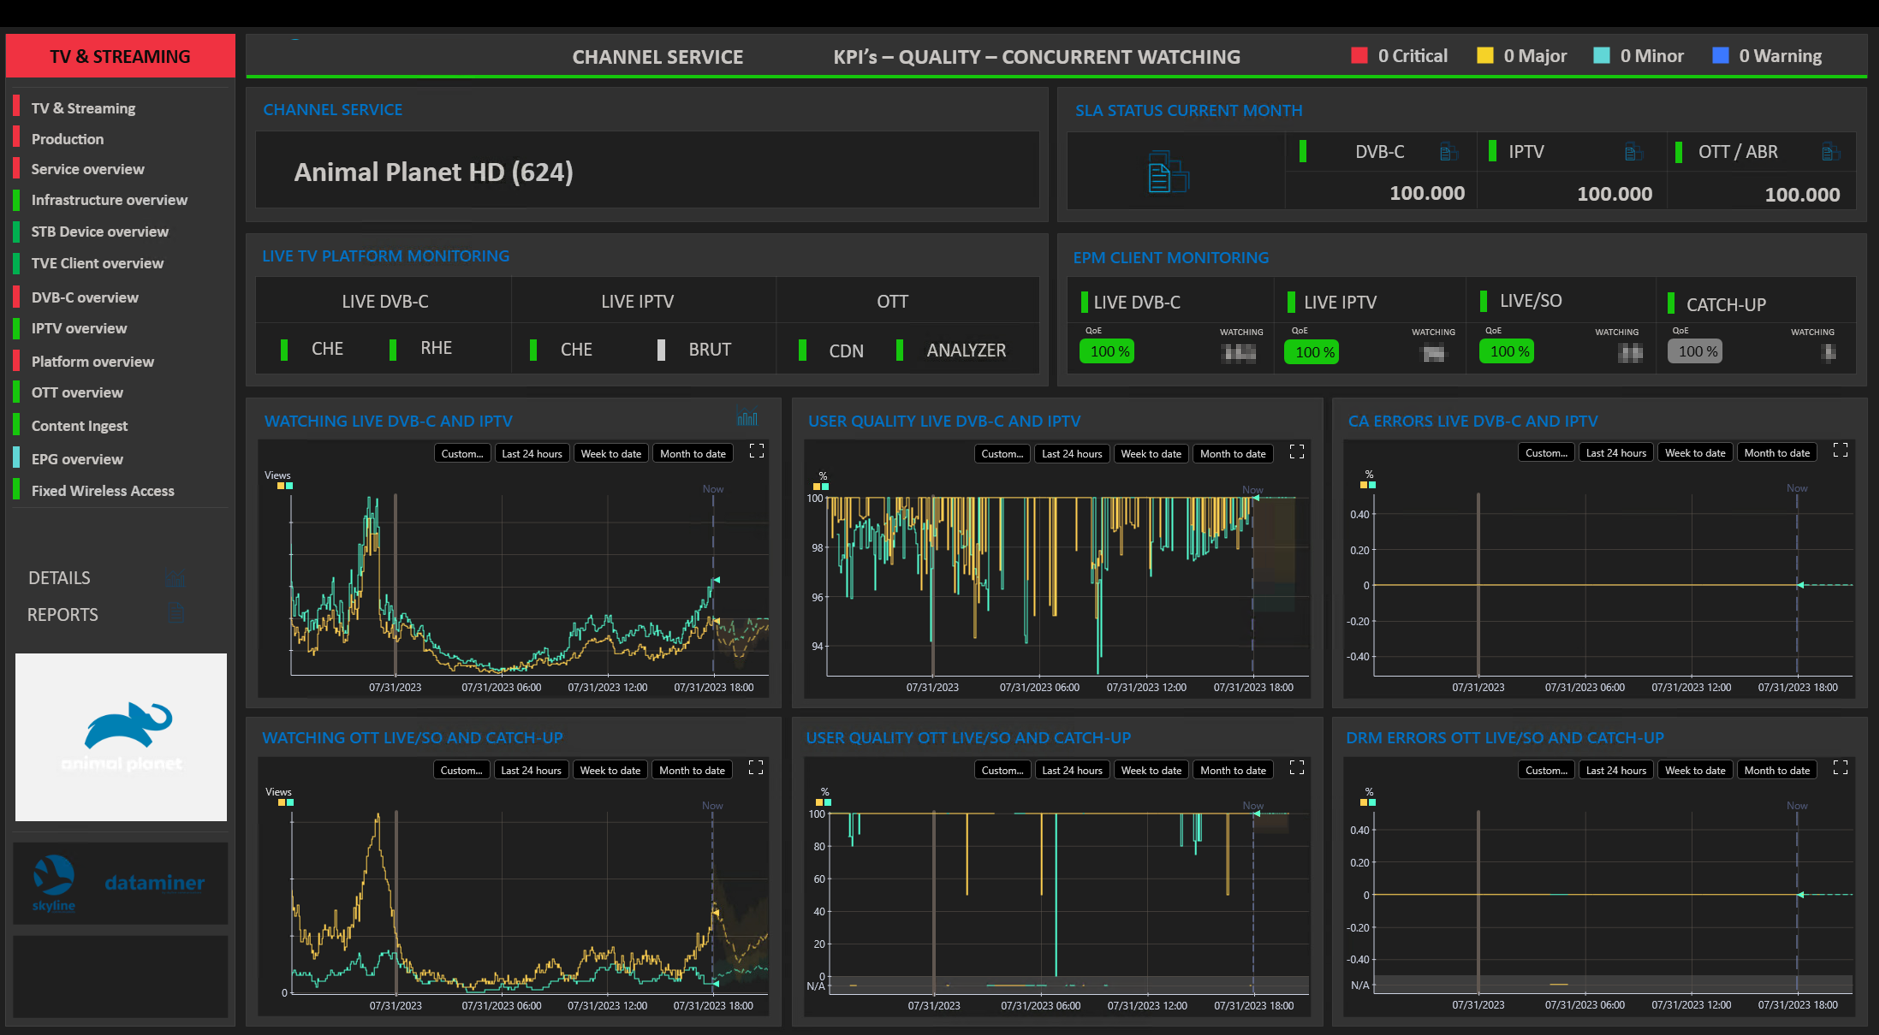
This is an example of consolidated SLA reporting for a full suite of video services delivered using multiple delivery schemes (DVB-C, IPTV, OTT) and access technologies (coax, fiber, and 5G).
USE CASE DETAILS
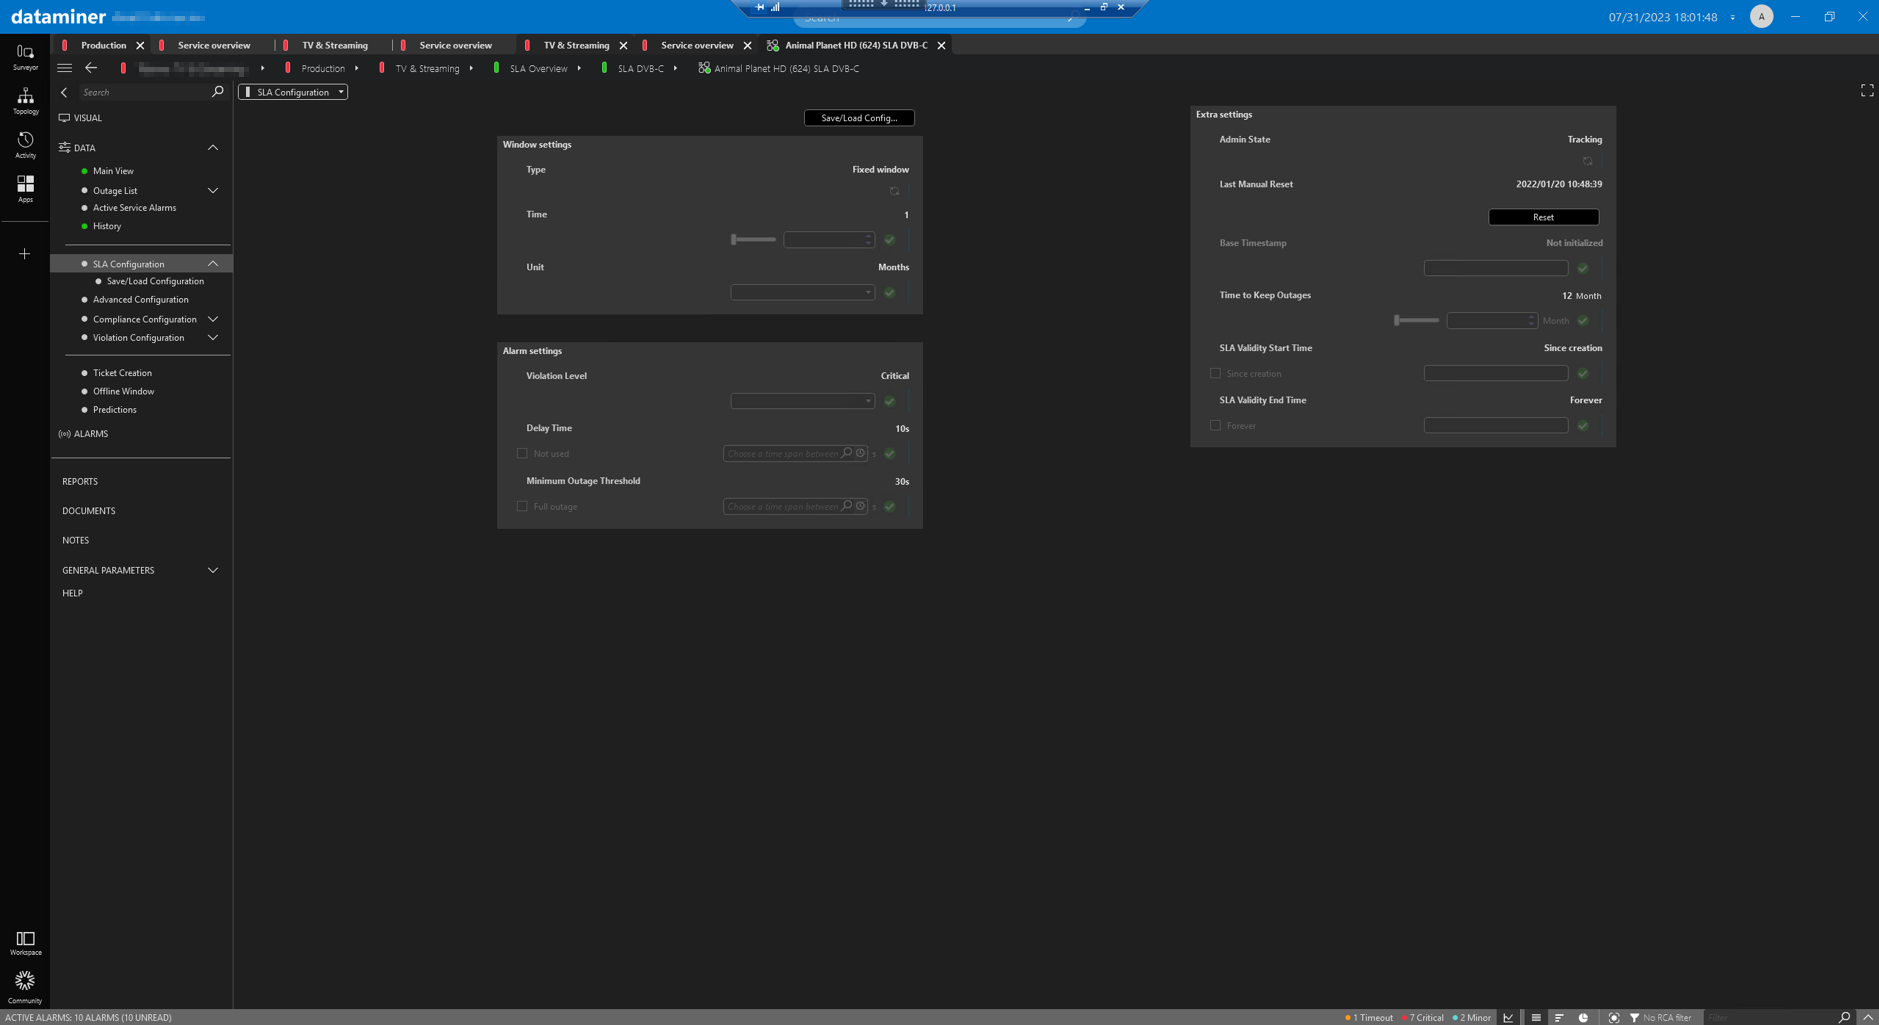 The “SLA Configuration” page, as shown here, contains numerous settings.
 In the top-left corner, under “Window settings”, the type and length of the compliance window is set. In this case, a fixed window of one month is selected.
Below this, the “Alarm settings” are configured. The service alarm level that triggers the start of SLA tracking is defined here; in this case the critical alarm level. The time delay and threshold are also defined here. These determine when the alarm condition will affect the service availability.
On the right, you can find several admin settings. Here you can enable or disable SLA measurement, reset SLA measurement, set the period for which the outage reports should be kept, etc.
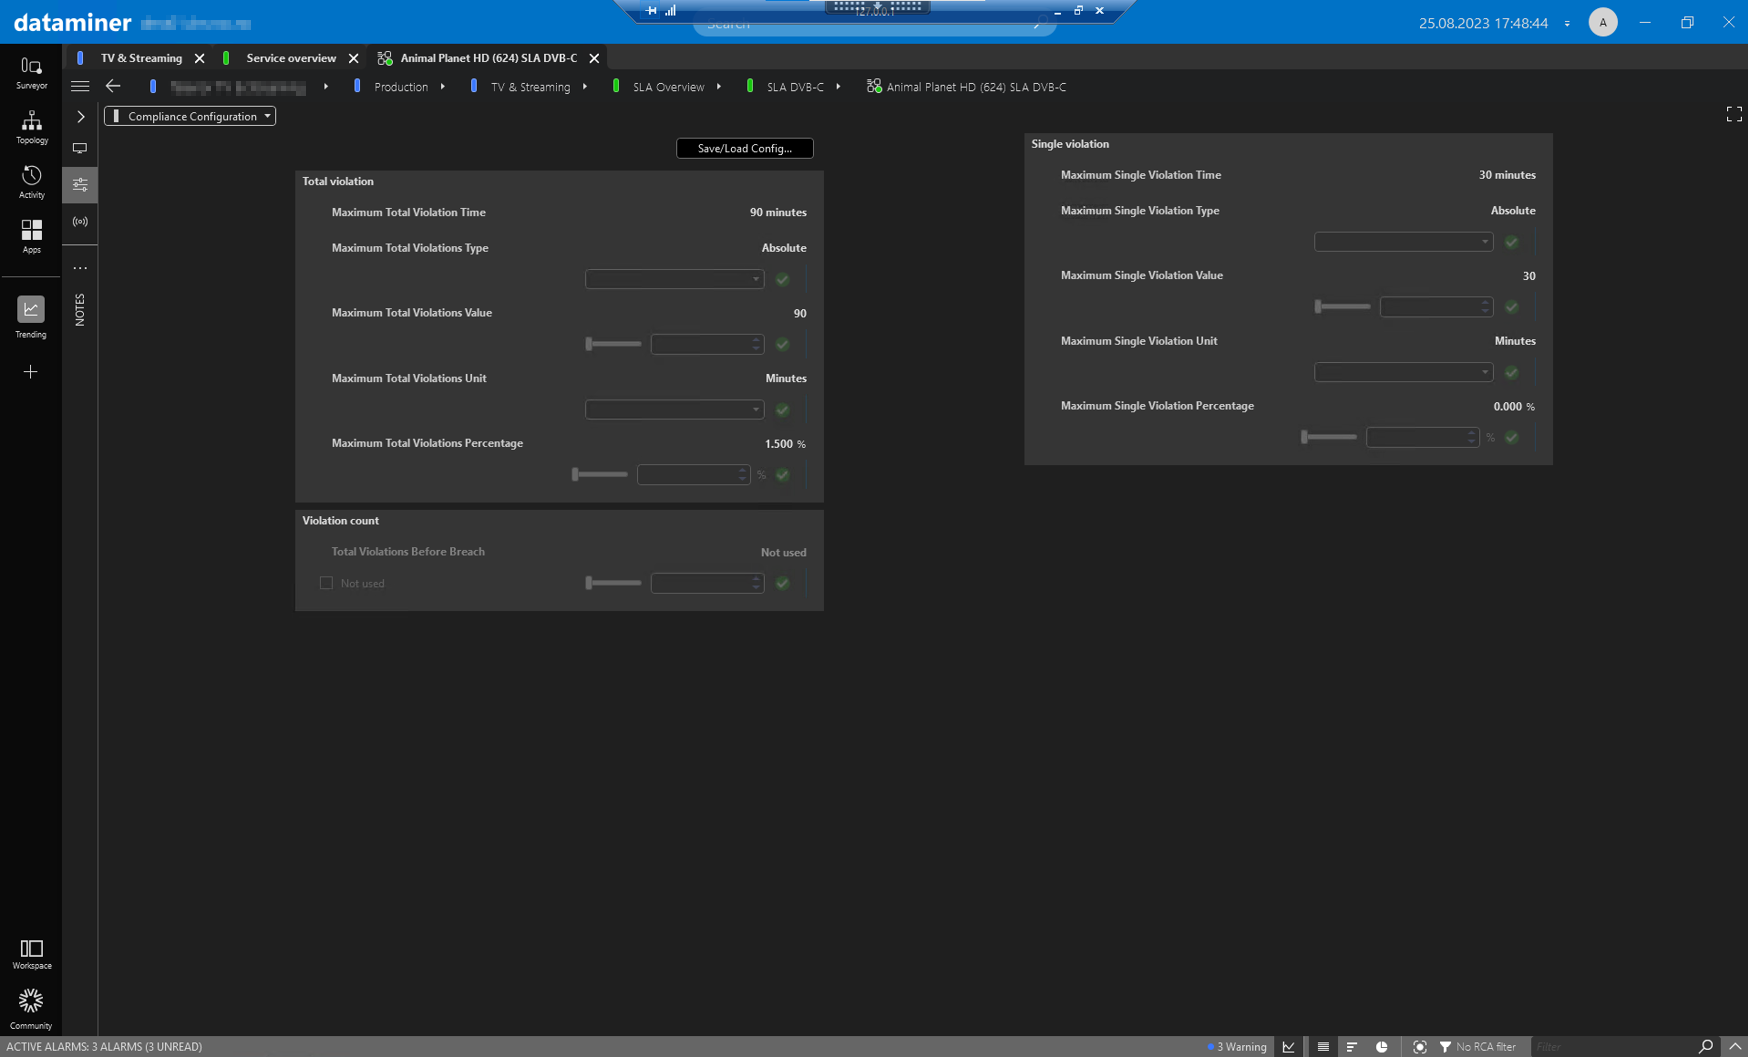 On the “Compliance Configuration” page, the outage measurement type is configured.
For absolute measurement, the violation time is tracked in hours, minutes, and seconds. For relative measurement, the violation time is tracked as a percentage of the window length.
The configuration also includes the maximum single and total violation values that will result in the service compliance status turning to “Breached”. These can be set as a time value or as a percentage, depending on which type of measurement is selected. In this example, absolute measurement is selected, with a maximum single service violation of 30 minutes, and a maximum total violation of 90 minutes.
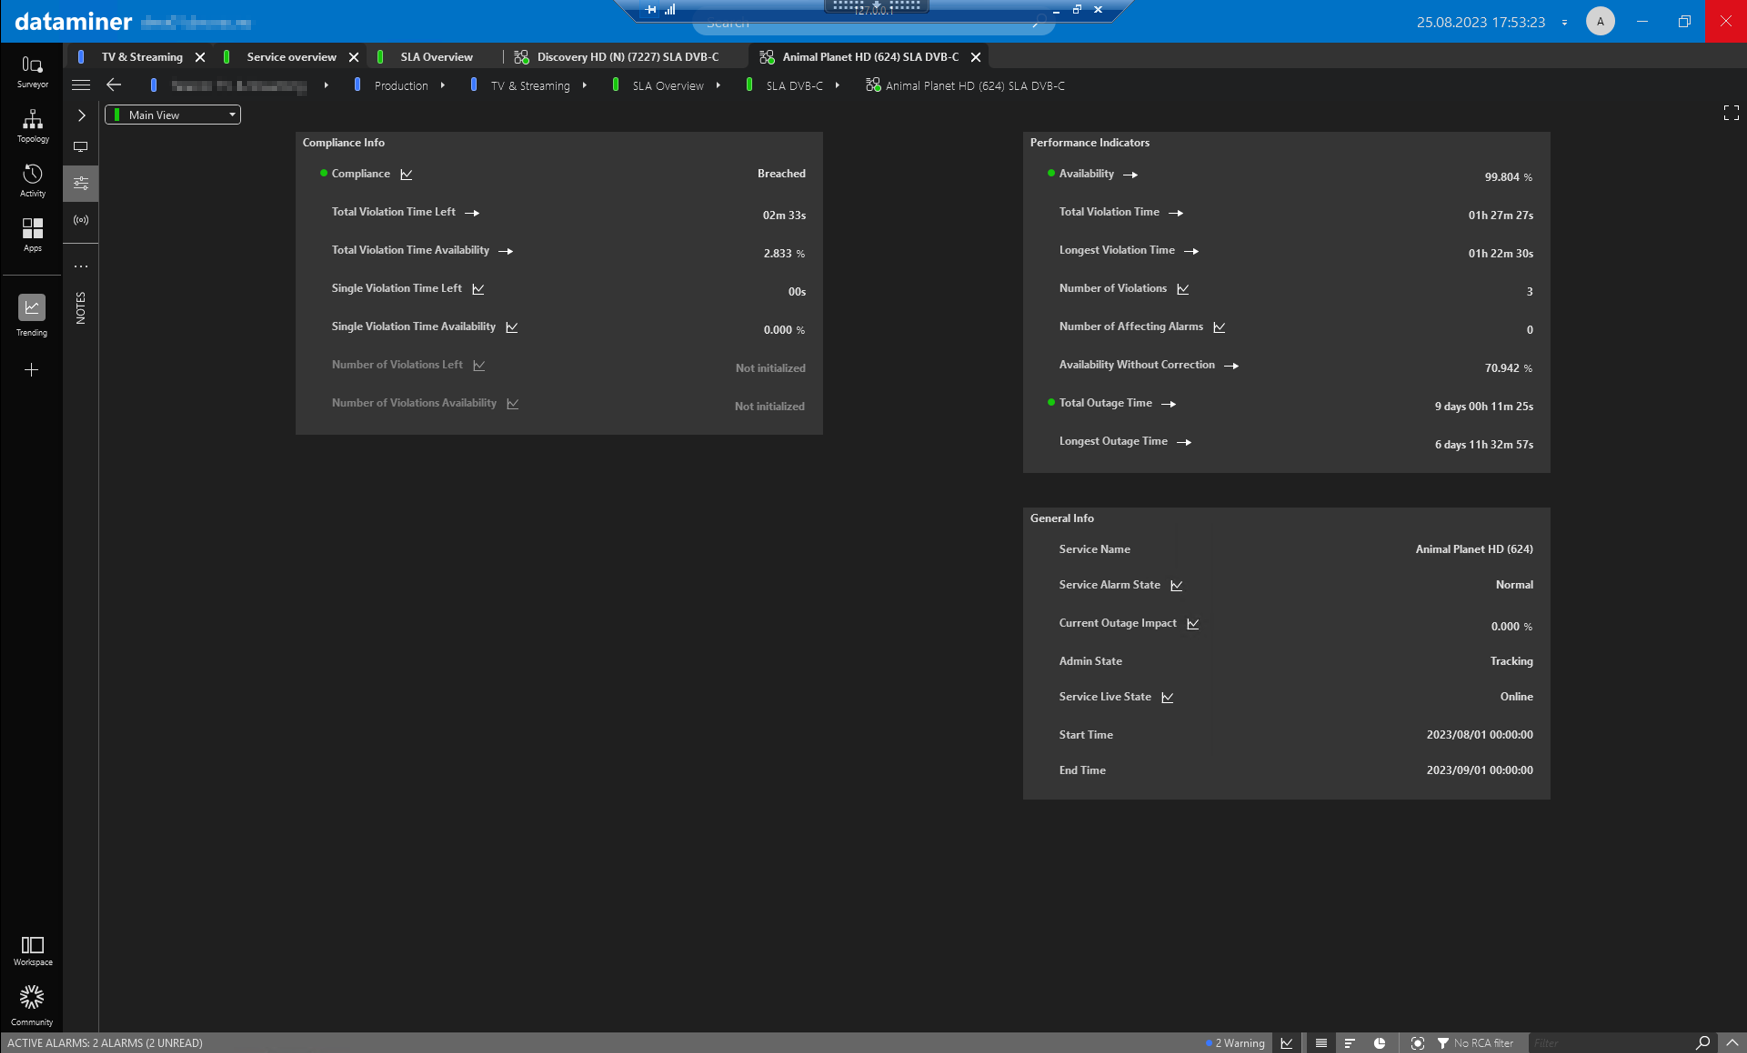 On the “Main View” page, you can find the actual compliance state of the service in the top-left corner.
 This is followed by information on how much total and single violation time is left before the service SLA will transition into a breached state. Note that for this example, the service SLA is breached already, and the following lines tell us that this is caused by a single violation instance with a duration that exceeded the maximum single violation duration as set in the “Compliance configuration”.
On the right, you can find the actual service availability figure, as well as details related to the number of alarms, the number of violations, the longest single/total outage, and the violation times associated with the service within the current SLA window period. The section in the lower right corner shows general information about both the service (including name, live state, and alarm state) and the SLA (including admin state and start/stop time for the current SLA window).
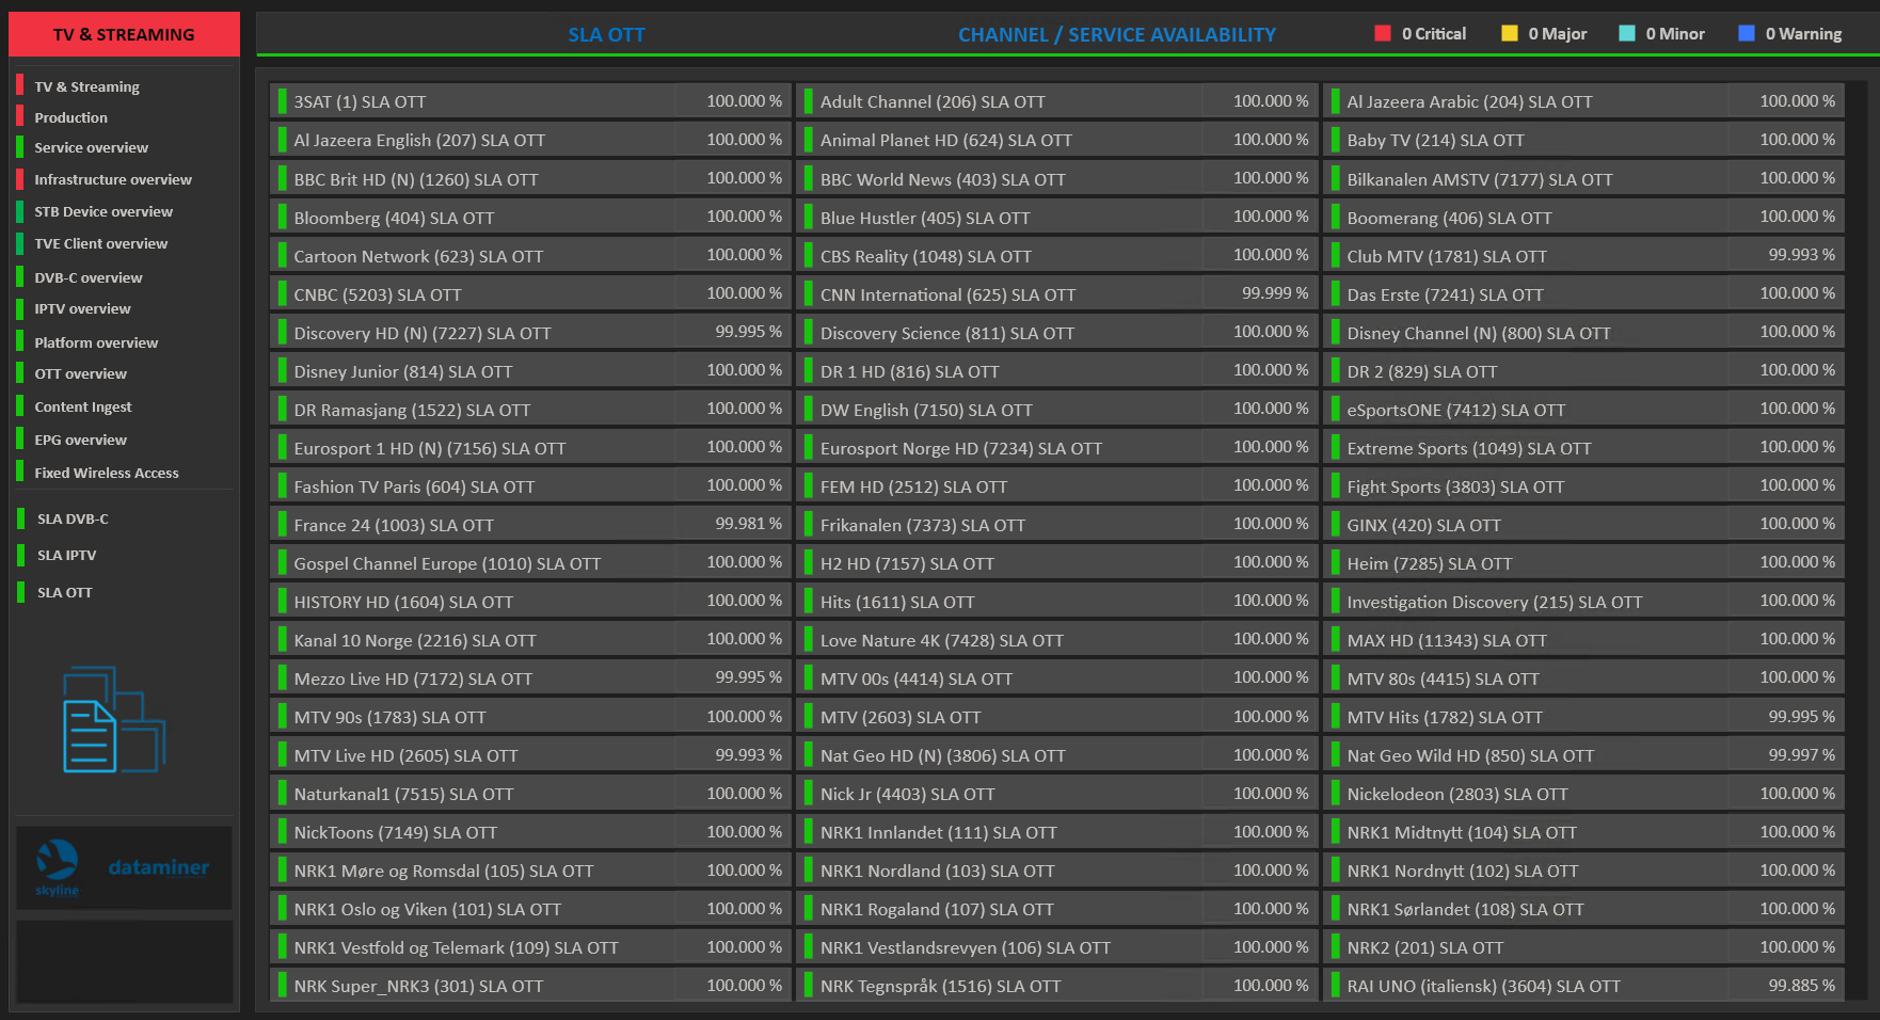 The service SLA information itself can be accessed directly on the “Channel/Service Availability” pages, which exist for every playout, or indirectly by clicking a specific service in the “Channel Service Overview”.
Here you can see a “Channel/Service Availability” page for a sample OTT playout. It lists all the services complete with their actual SLA status.
If you click a specific service in the overview, this will take you to the detailed SLA overview for the OTT instance of that specific service (see next image).
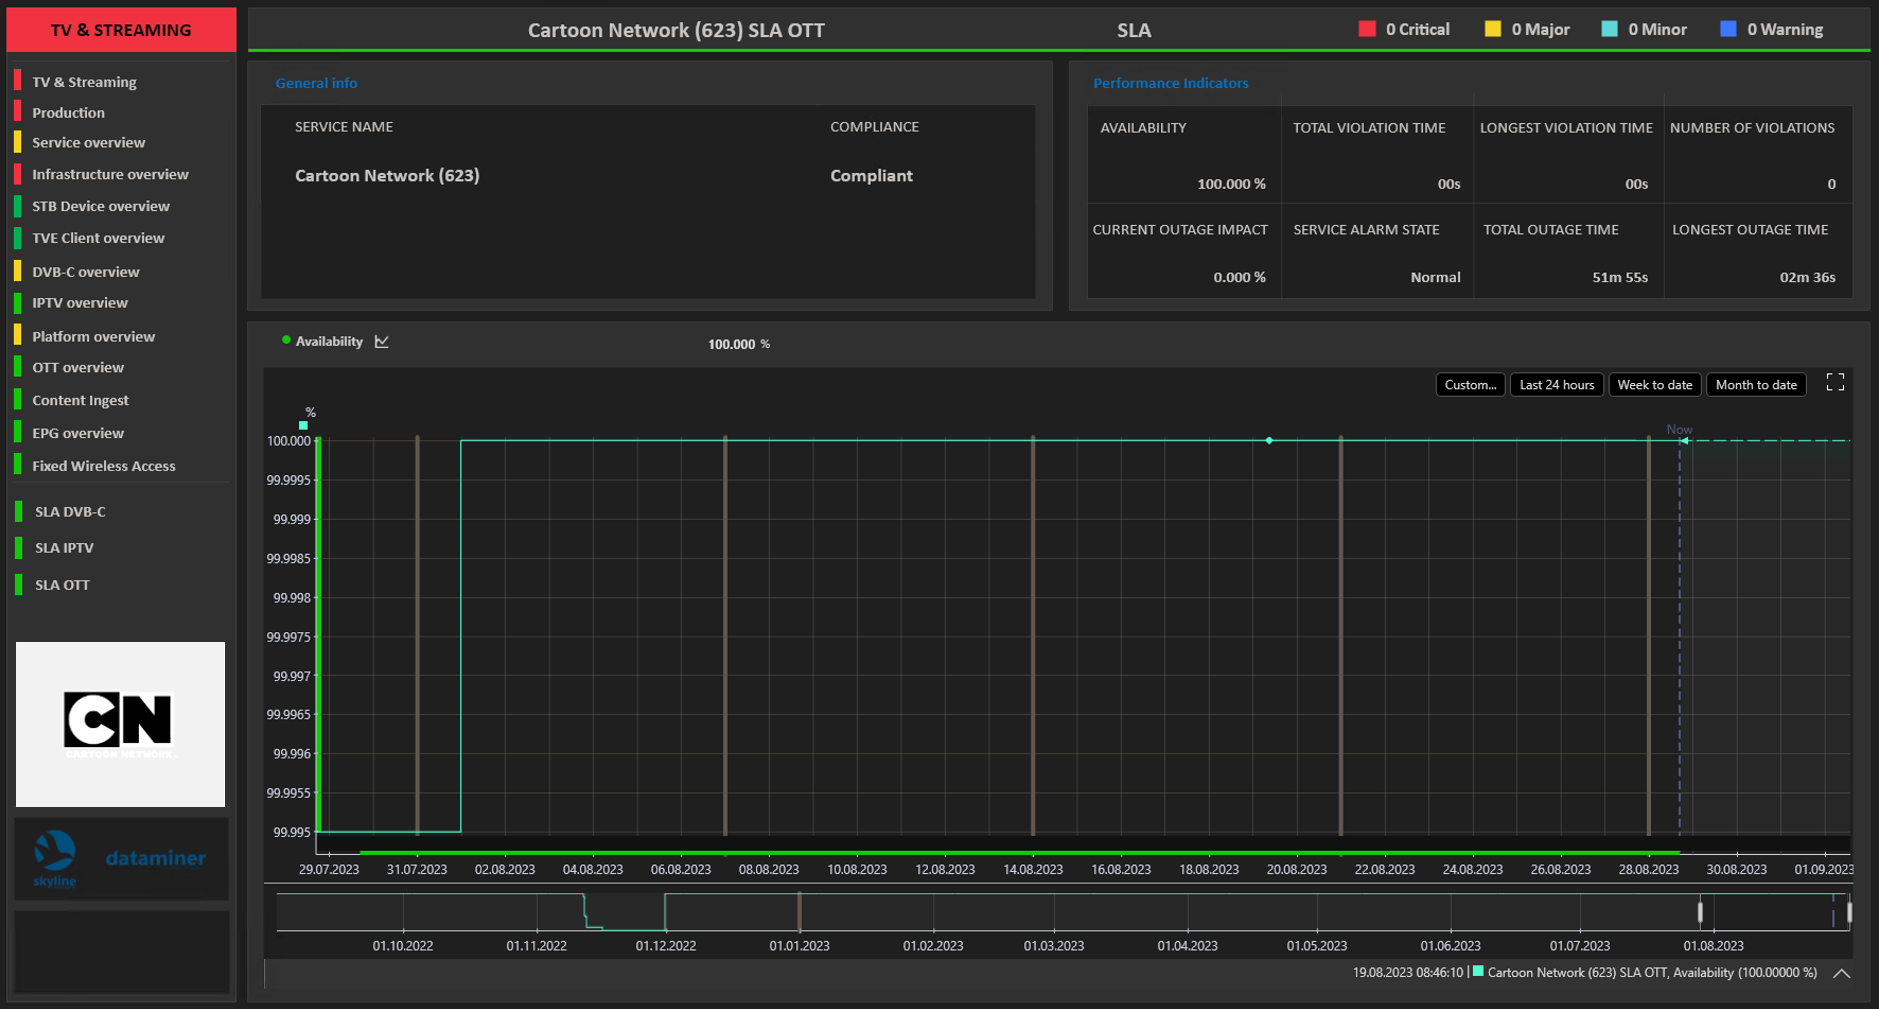 This is the detailed overview page for a specific service, in this case for an OTT/ABR instance. It shows not only the service name and actual compliance status, but also additional details such as the actual availability, the number of violations, and the total and longest service outage and violation time for the current SLA period.
Below this, a trend graph of the availability is shown. Here it shows the trend for the “Month to date”, and with a current availability of 100%, it’s obvious that there haven’t been any drops since the start of the month. You can also immediately clearly see the SLA figure at the end of the previous month.
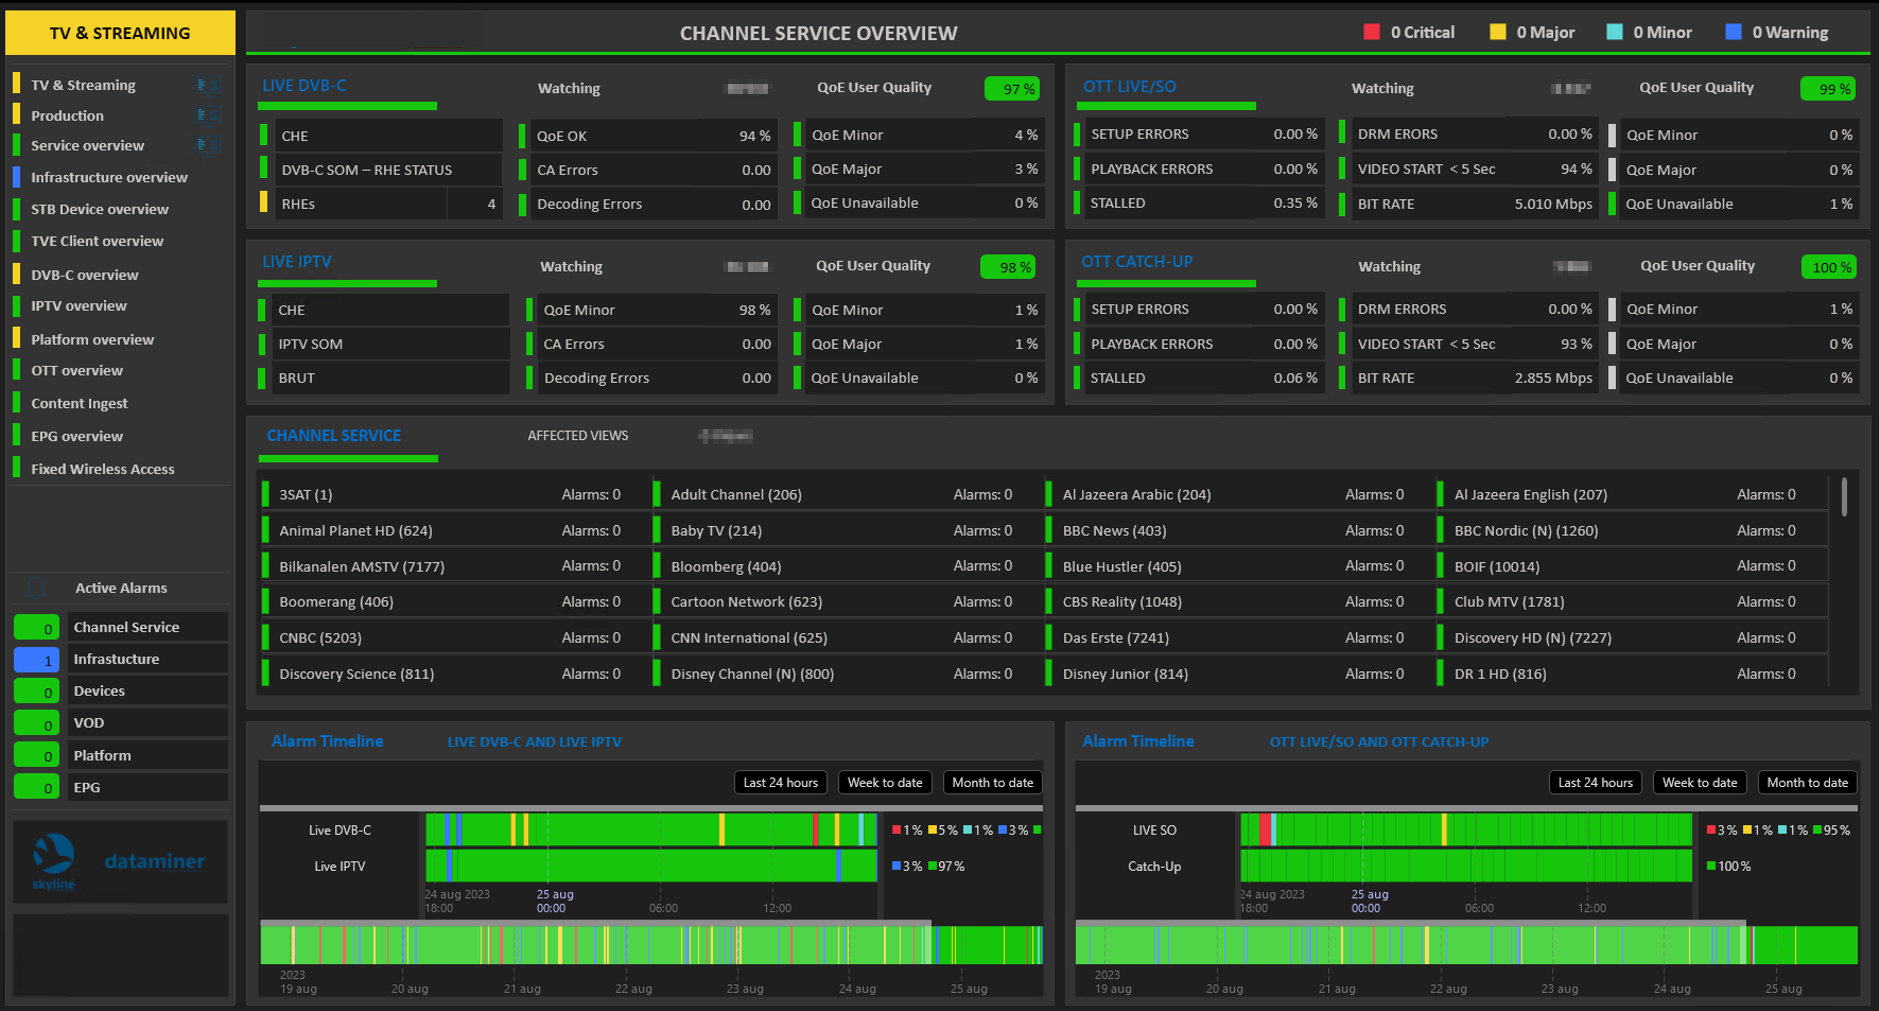 Above, you could see how operators can directly access the SLA status for a specific instance of a channel service. They can also access the same information indirectly by clicking a specific service in the “Channel Service Overview” page, as shown here. This will show the “Channel Service” page (see next image).
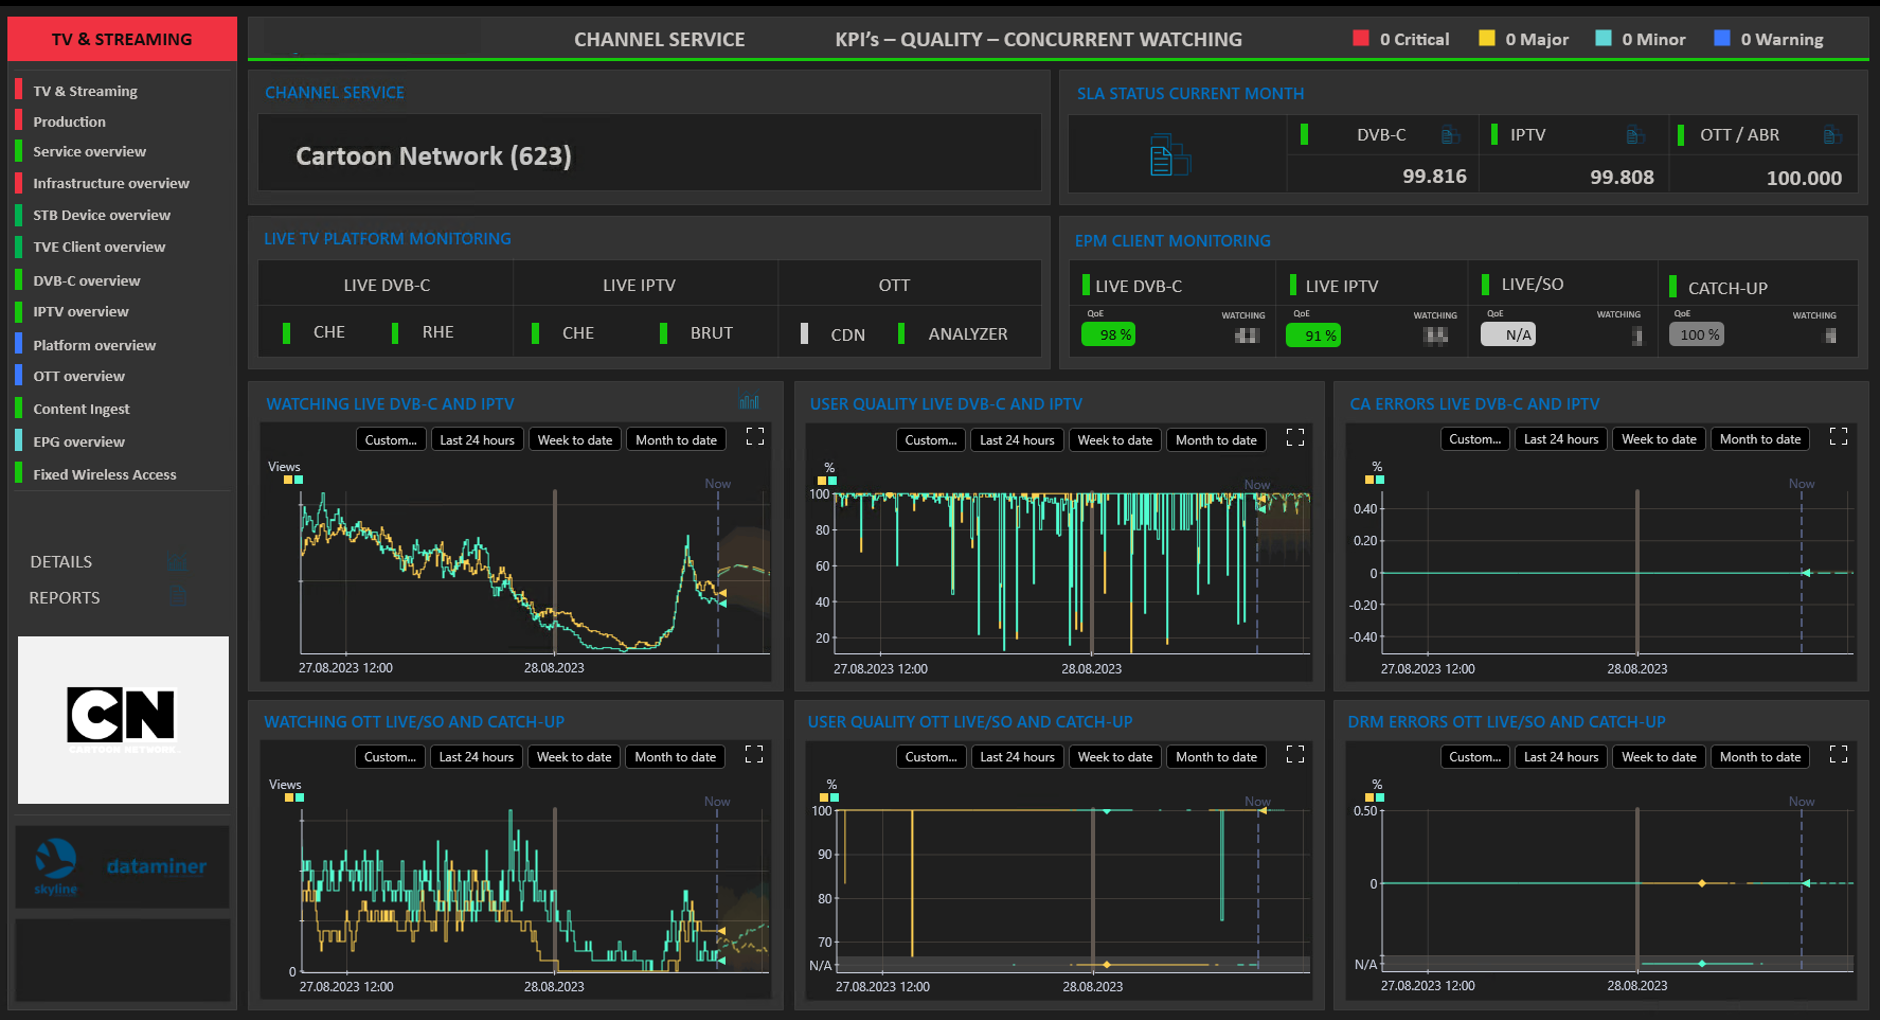 This screenshot shows a sample of a “Channel Service” page shown after an operator clicks a service in the “Channel Service Overview”.
Like the “Channel Service Overview” page, this page is not yet associated with any playout. It presents the actual SLA figures for all service representations (DVB-C, IPTV, and OTT/ABR), with the possibility to navigate further to the detailed overview (as shown above) by clicking one of the blue icons above the different availability figures.
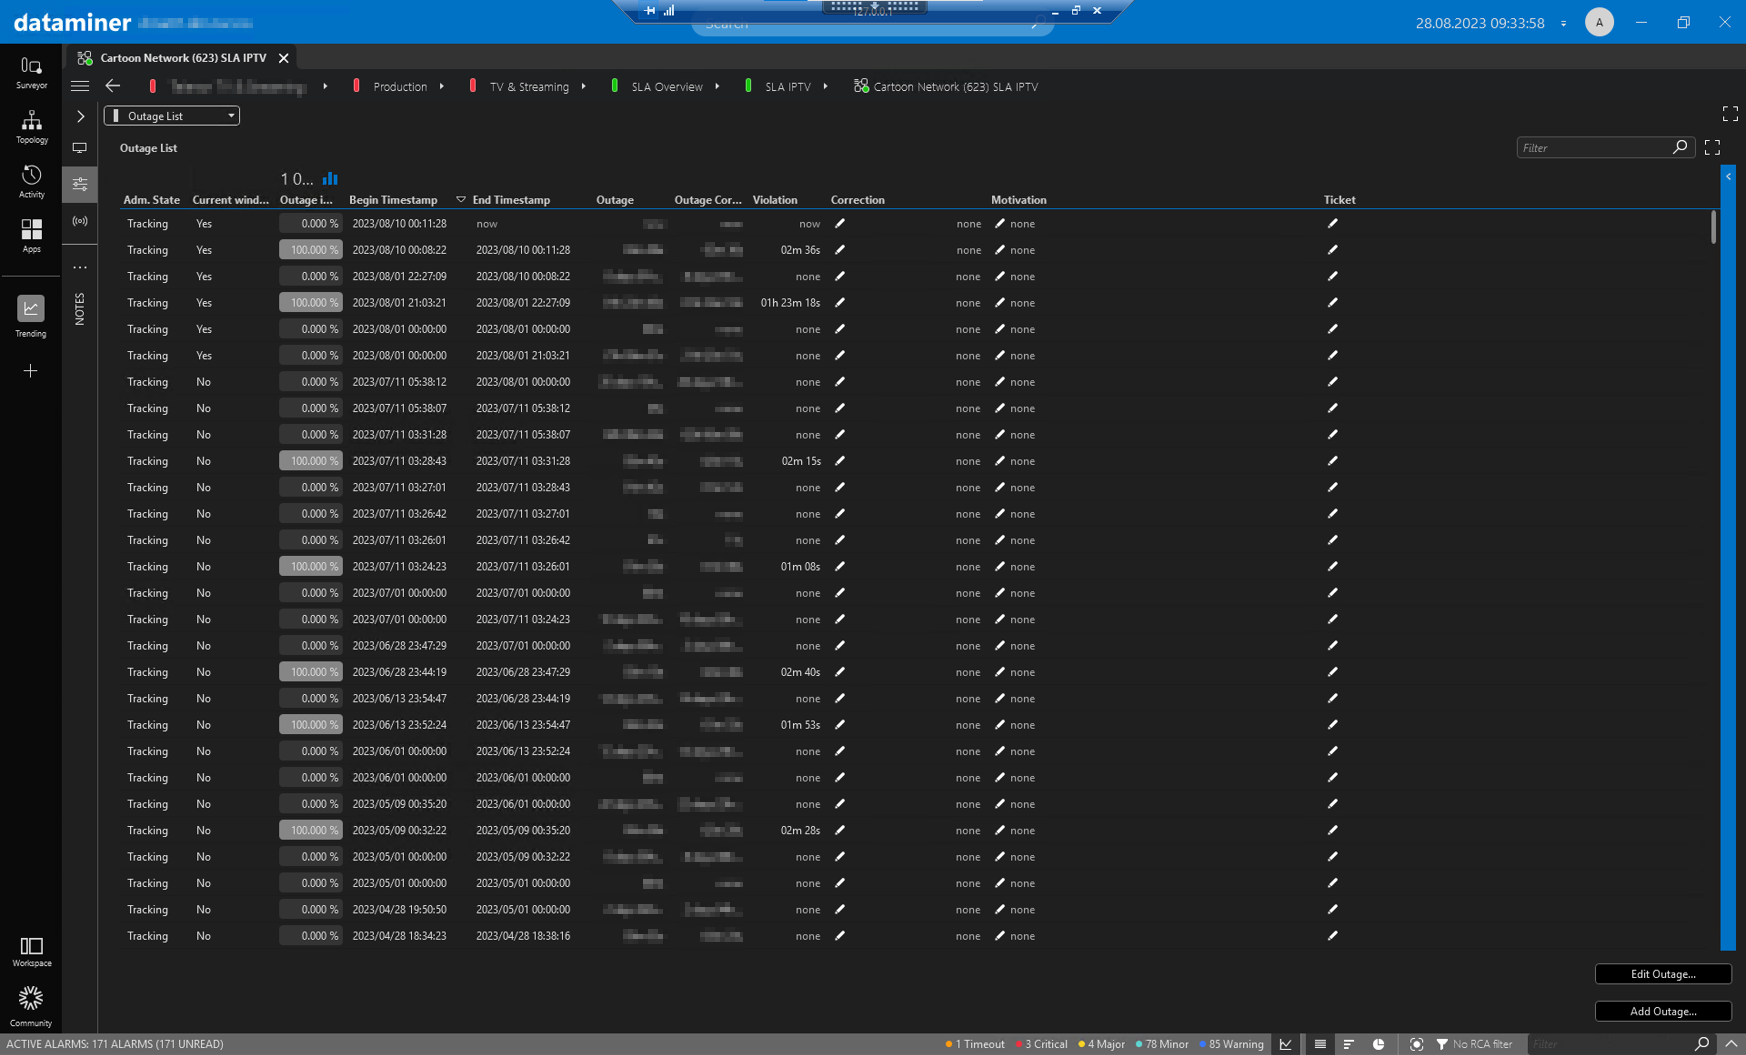 The “Outage List” page of an SLA shows all the incidents associated with the service in full detail. In this case, the list is sorted by “Alarm Severity”, with the “Critical” severity at the top. Only the incidents with this severity are taken into account for the SLA. For each of these, the violation time will be deducted from the maximum violation time for the SLA period, determining how much can still be incurred for the remainder of the SLA period.
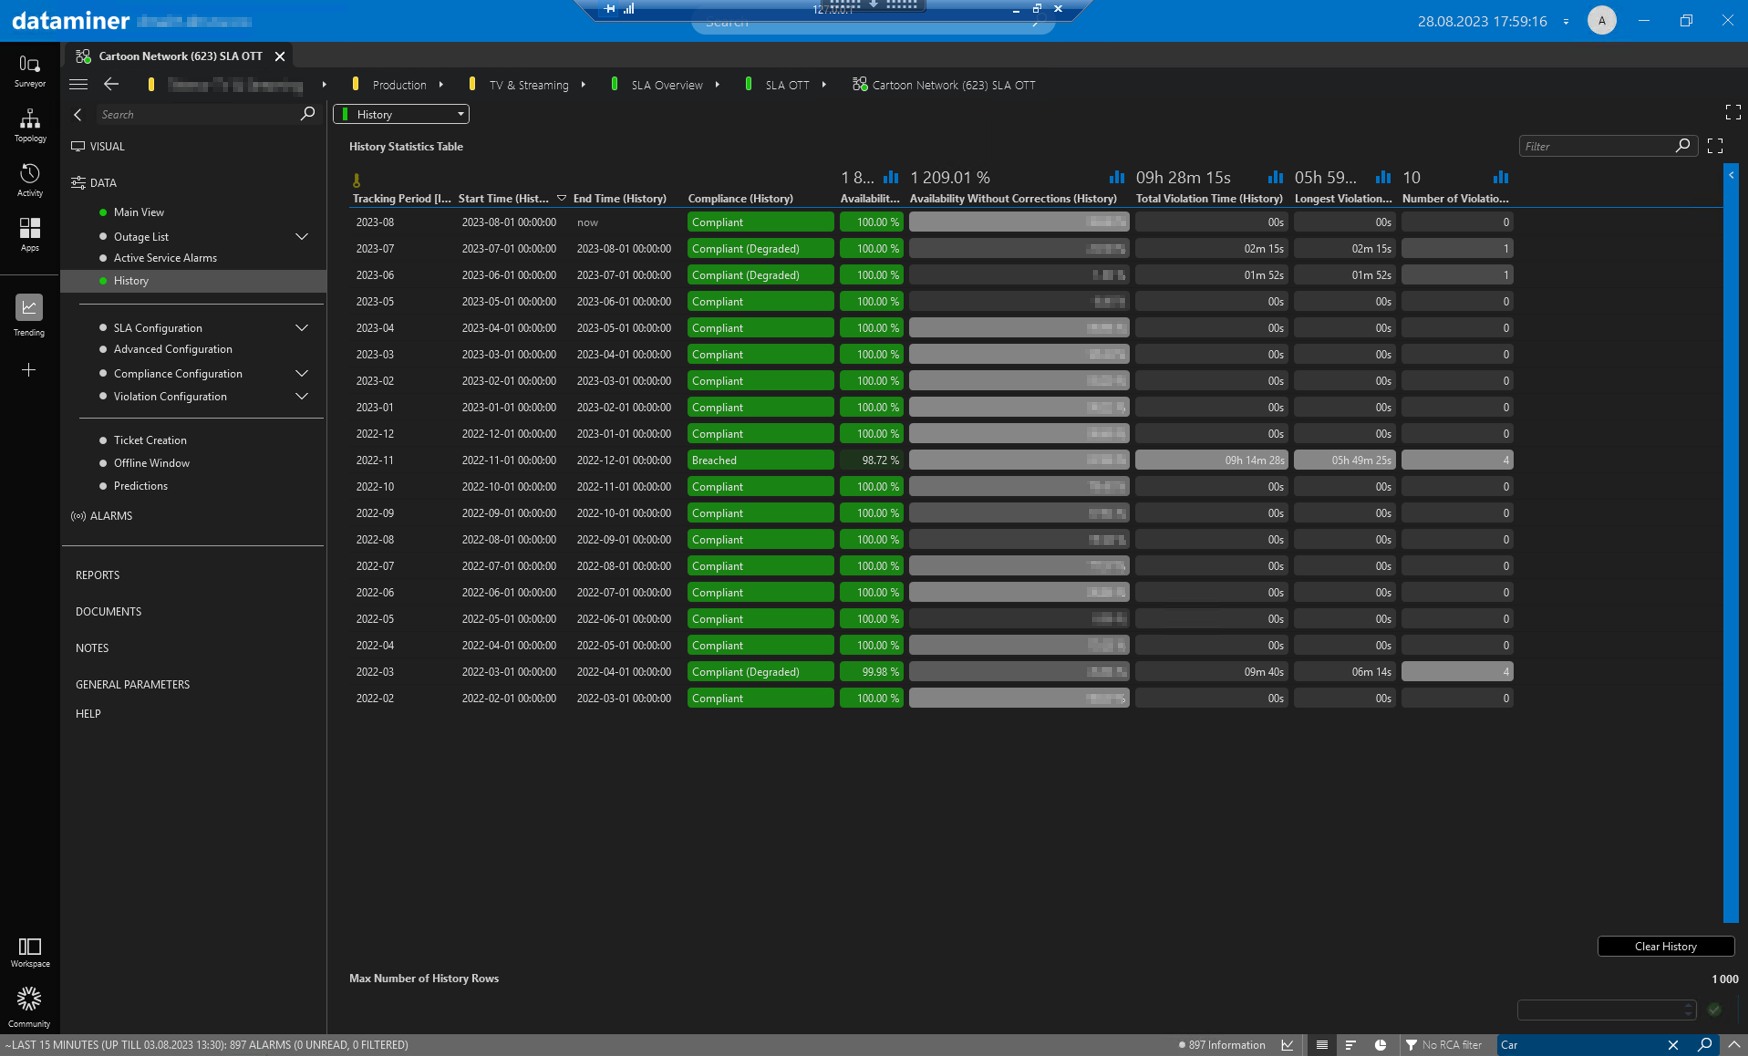 The platform complements the presentation of the actual channel service availability figures for the active SLA window with a full log of the same figures for all earlier periods.
 This log can be found on the “ History” page. It makes it very easy to monitor SLA performance over longer periods.
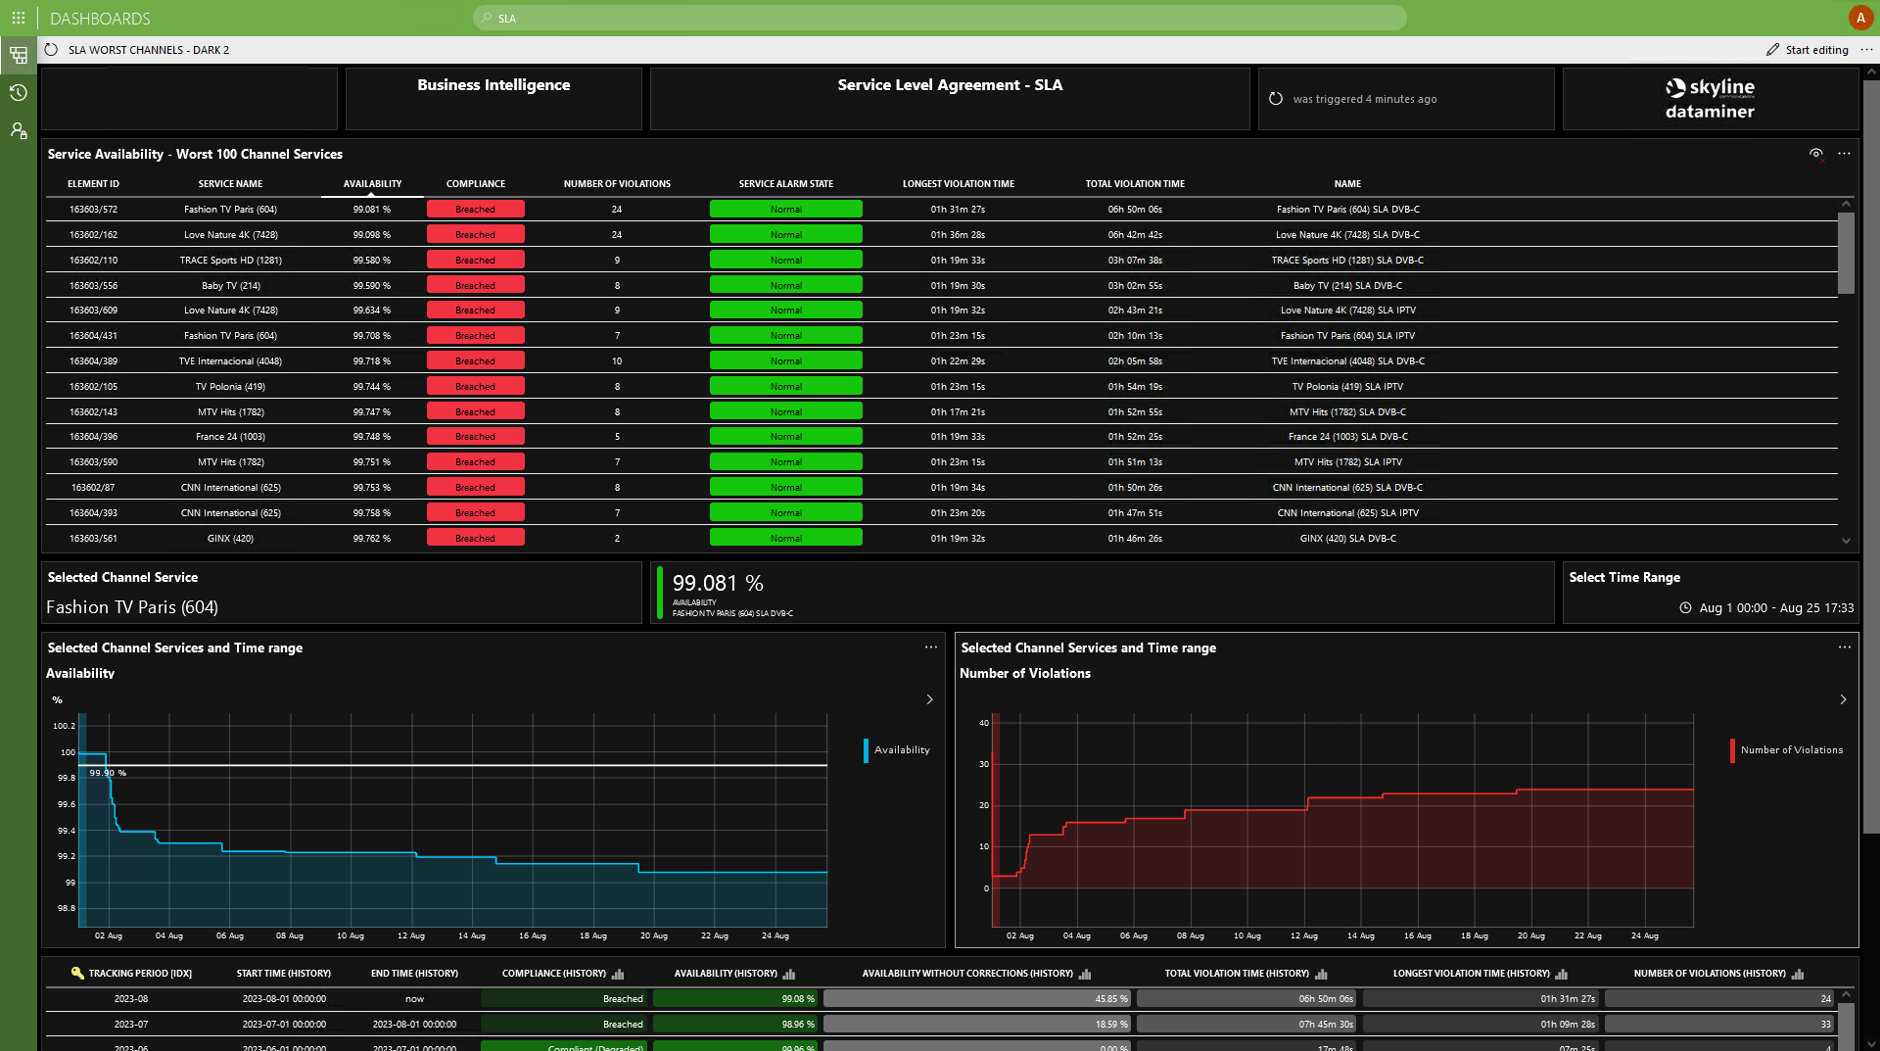 It’s often necessary to get immediate visibility on which channel service instances fail to meet the configured target. This can easily be implemented with a DataMiner GQI “Top-X” query.
2 thoughts on “Video Services SLA Management”
Leave a Reply
You must be logged in to post a comment.
wonderful use case, thanks Dominique for sharing!
Exemplary and applicable to so many operations. SLA management in DataMiner is so easy to setup !