solution Use Case
The VSAT Broadband Observability solution
VSAT systems can be complex to manage, and effective oversight is critical for organizations relying on them. Regardless of the ground infrastructure hub system and the type of VSAT terminal—whether aviation, enterprise, or maritime—observability and access to key metrics are essential to manage and control these complex systems.
At Skyline Communications, we are excited to introduce a solution designed to manage any type of VSAT hub system. It provides a clear overview of both the VSAT hub and terminal metrics.
With easy access to Key Performance Indicators (KPIs) such as signal quality, bandwidth usage, latency, and uptime, this solution supports proactive monitoring and optimization.
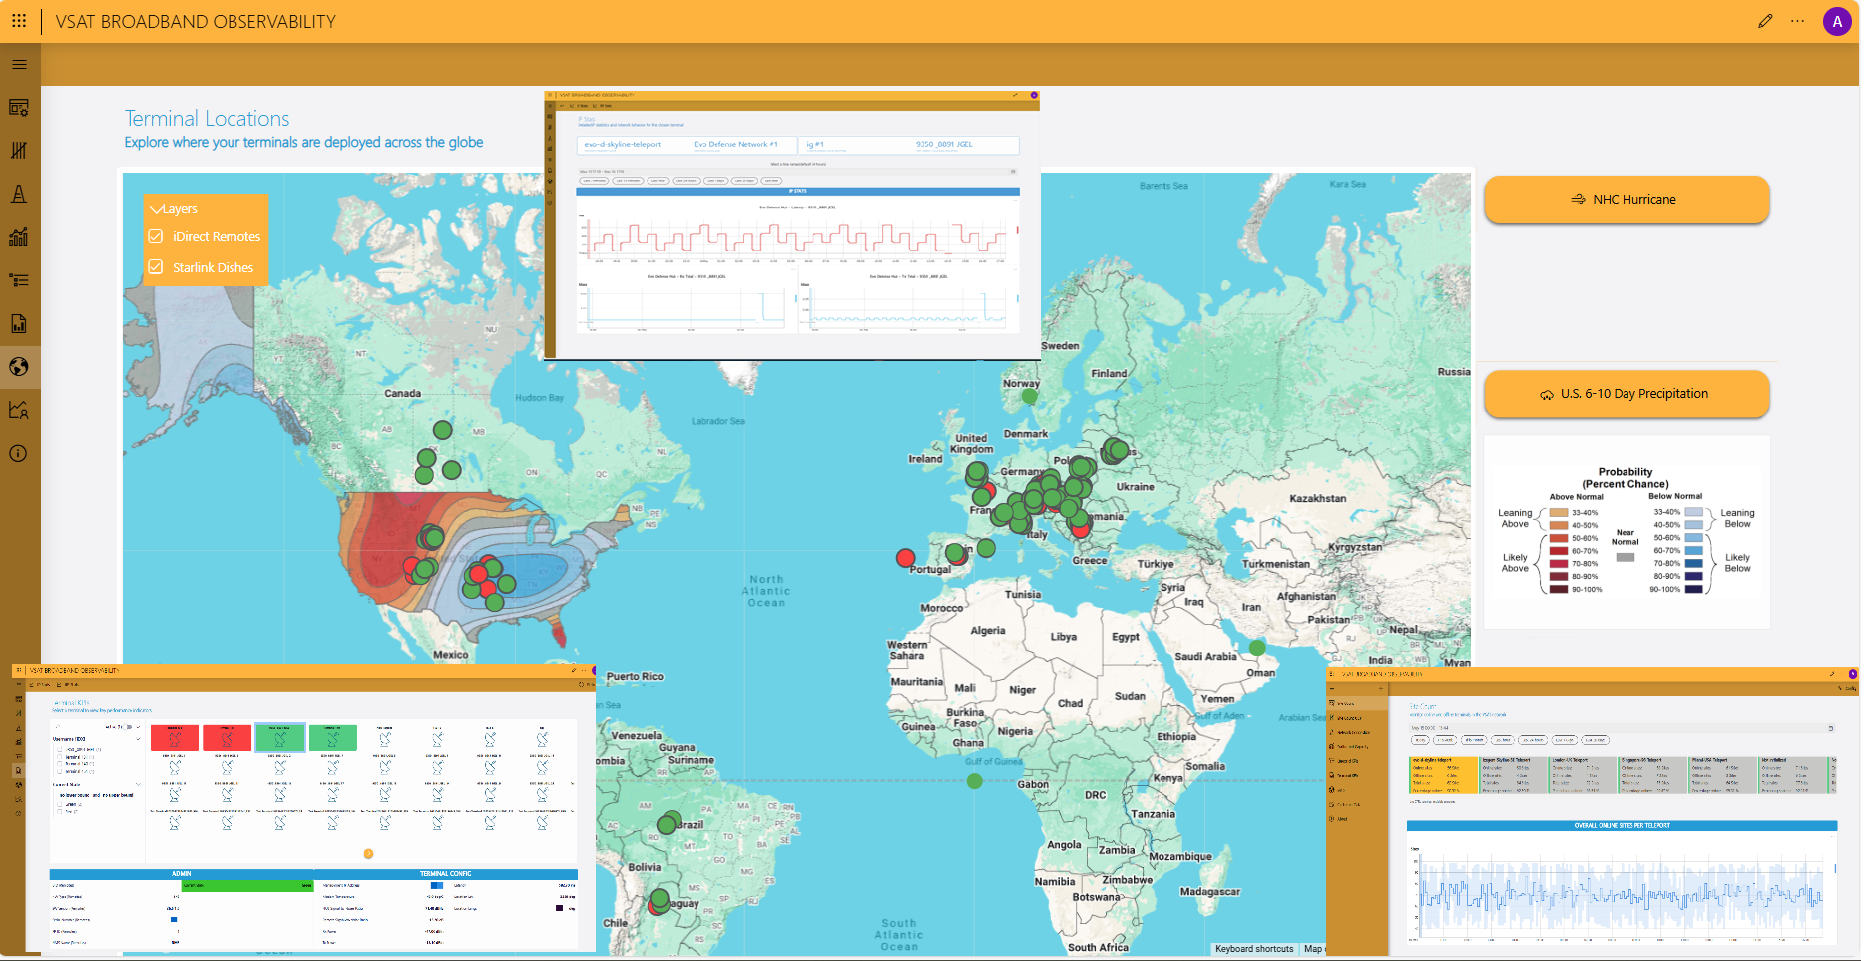
One of the standout features of our integrated solution is the ability to visualize the entire terminal network on Google Maps. This intuitive interface offers a geographical view of assets, enabling you to pinpoint locations, identify potential connectivity issues, and streamline operations with precision.
Thanks to our low-code app and the connectors that we’ve developed for various VSAT hub systems, this integration provides a solution that simplifies the job of any Network Operations Center (NOC).
USE CASE DETAILS
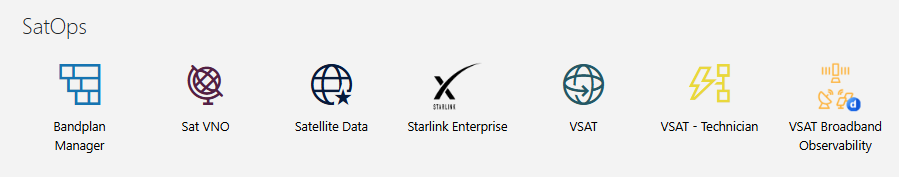 Deploy the VSAT Broadband Observability package from the DataMiner Catalog to automatically set up the necessary connectors and low-code app. Once deployed, you can access the app by going to your DataMiner root page. The VSAT Broadband Observability solution was developed using the iDirect Evolution VSAT hub system, with additional aspects of the Starlink LEO terminal data. While this particular use case focuses on iDirect’s Evolution platform, the solution is designed to be easily extended to support any VSAT hub platform.
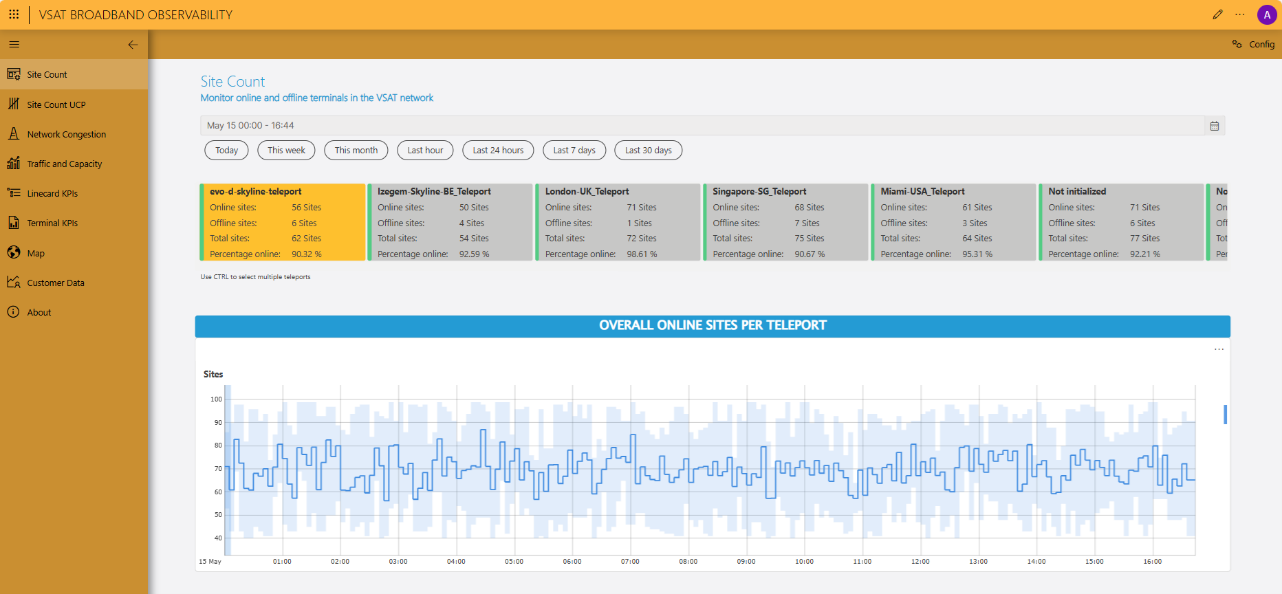 The Site Count and Site Count UCP pages provide a quick summary of the number of terminals in the VSAT system. For each teleport configured on the Evolution platform, the page displays the count of online and offline terminals.
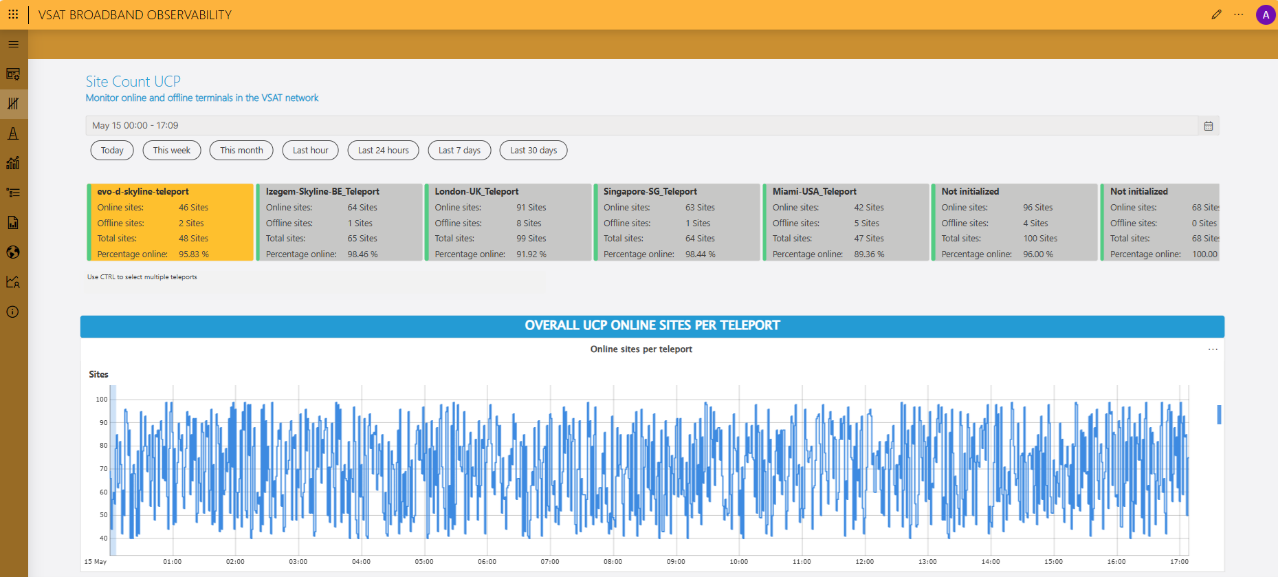 Terminal count data is also broken down per network defined within the Evolution platform. All terminal count data is visualized in a trend chart, based on the time range defined by the user.
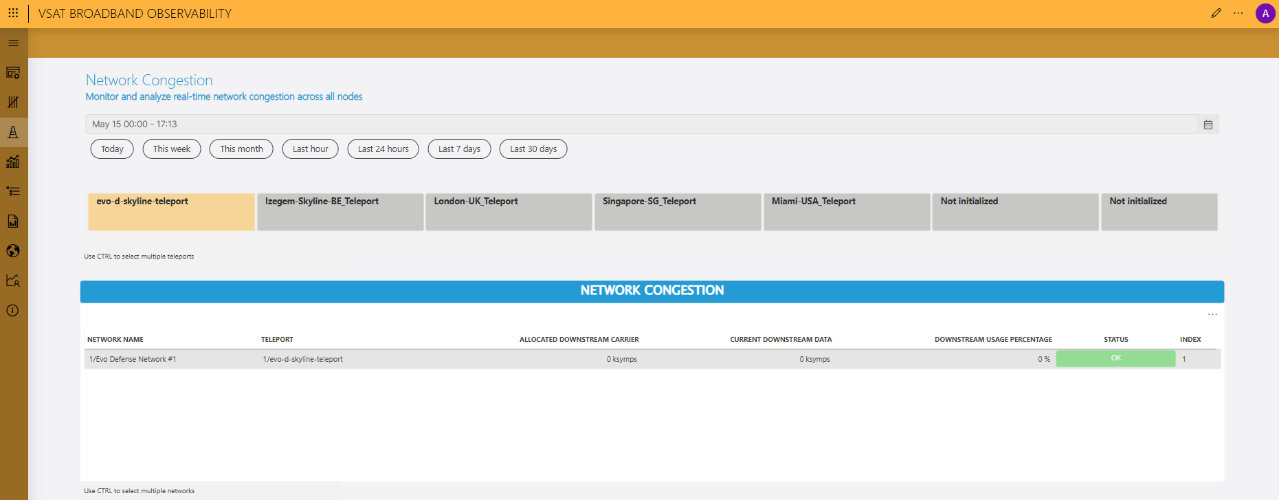 The Network Congestion page shows the performance of each VSAT network defined on the Evolution platform. Real-time upstream and downstream data is presented in trend charts. For each network, the application displays the allocated downstream bandwidth, current downstream usage, and downstream usage percentage. This allows NOC operators to quickly identify networks that are becoming congested. The app also provides insight into slot usage within inroute groups, as well as the upstream congestion status.
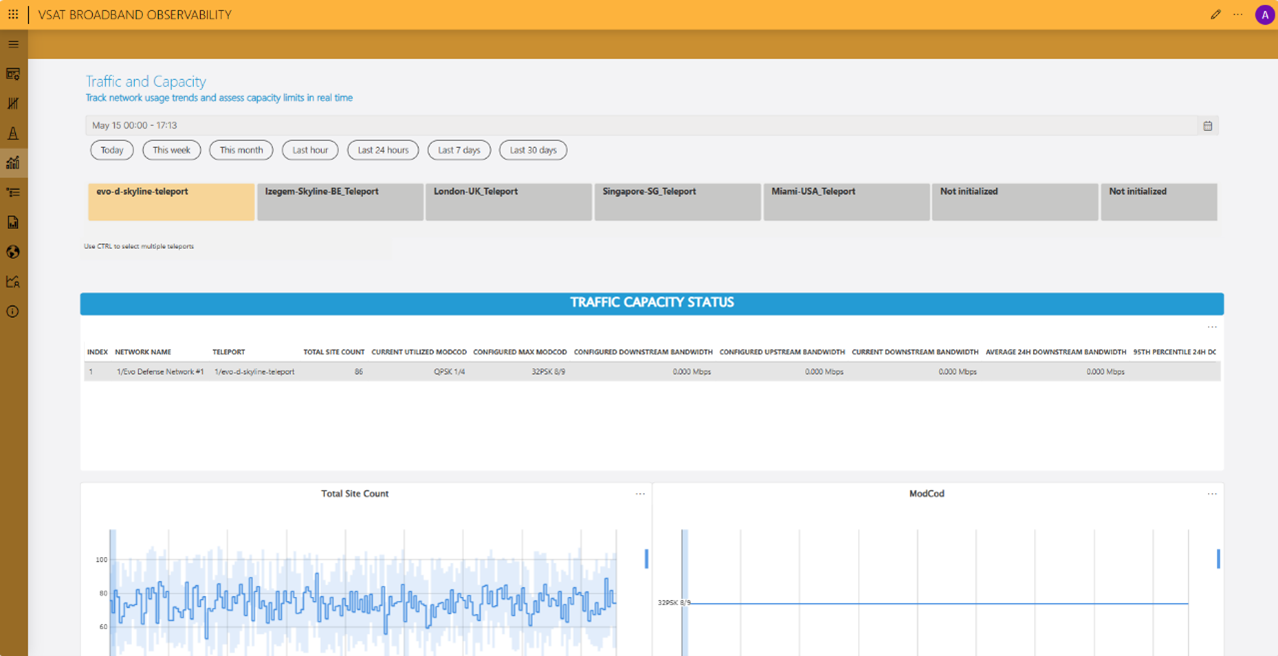 The Network Traffic and Capacity page is critical for any organization managing VSAT operations. It provides a clear view of capacity status, as well as key metrics needed to effectively manage a VSAT network. For each network, the application displays the site count, along with bandwidth and MODCOD usage data. All data is visualized in trend charts based on the user-defined time range. By default, the charts show data starting from the beginning of the current day.
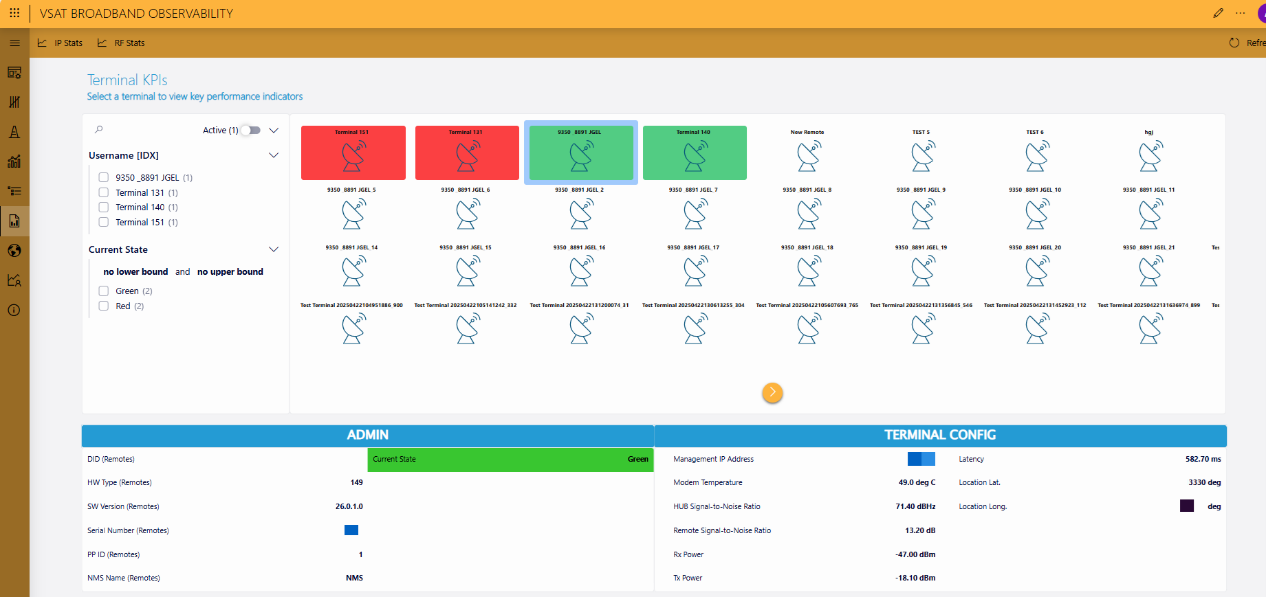 The Terminal KPI page provides a summary of terminal KPIs, including the location on a map and key metric trend charts. It also lists all terminals along with their alarm status, which can be configured and customized. The page also includes filtering options to help users focus on specific terminals within a large VSAT network.
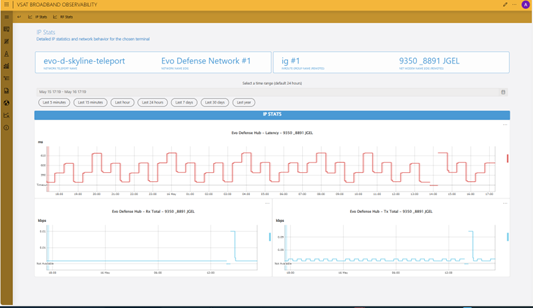 Additionally, the page offers subpages to display RF statistics and IP statistics in separate panels.
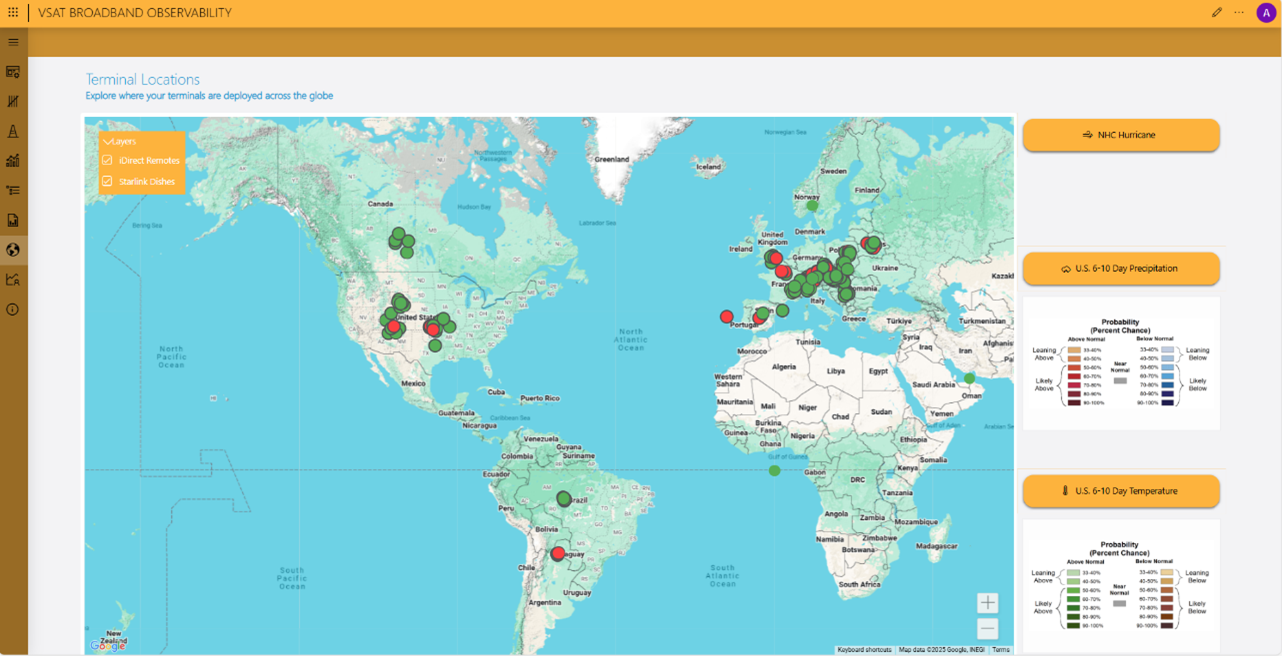 The maps component is a location visualization tool that provides a quick snapshot of the entire VSAT network. Built on Google Maps, it displays the precise location of each VSAT terminal along with its alarm status.
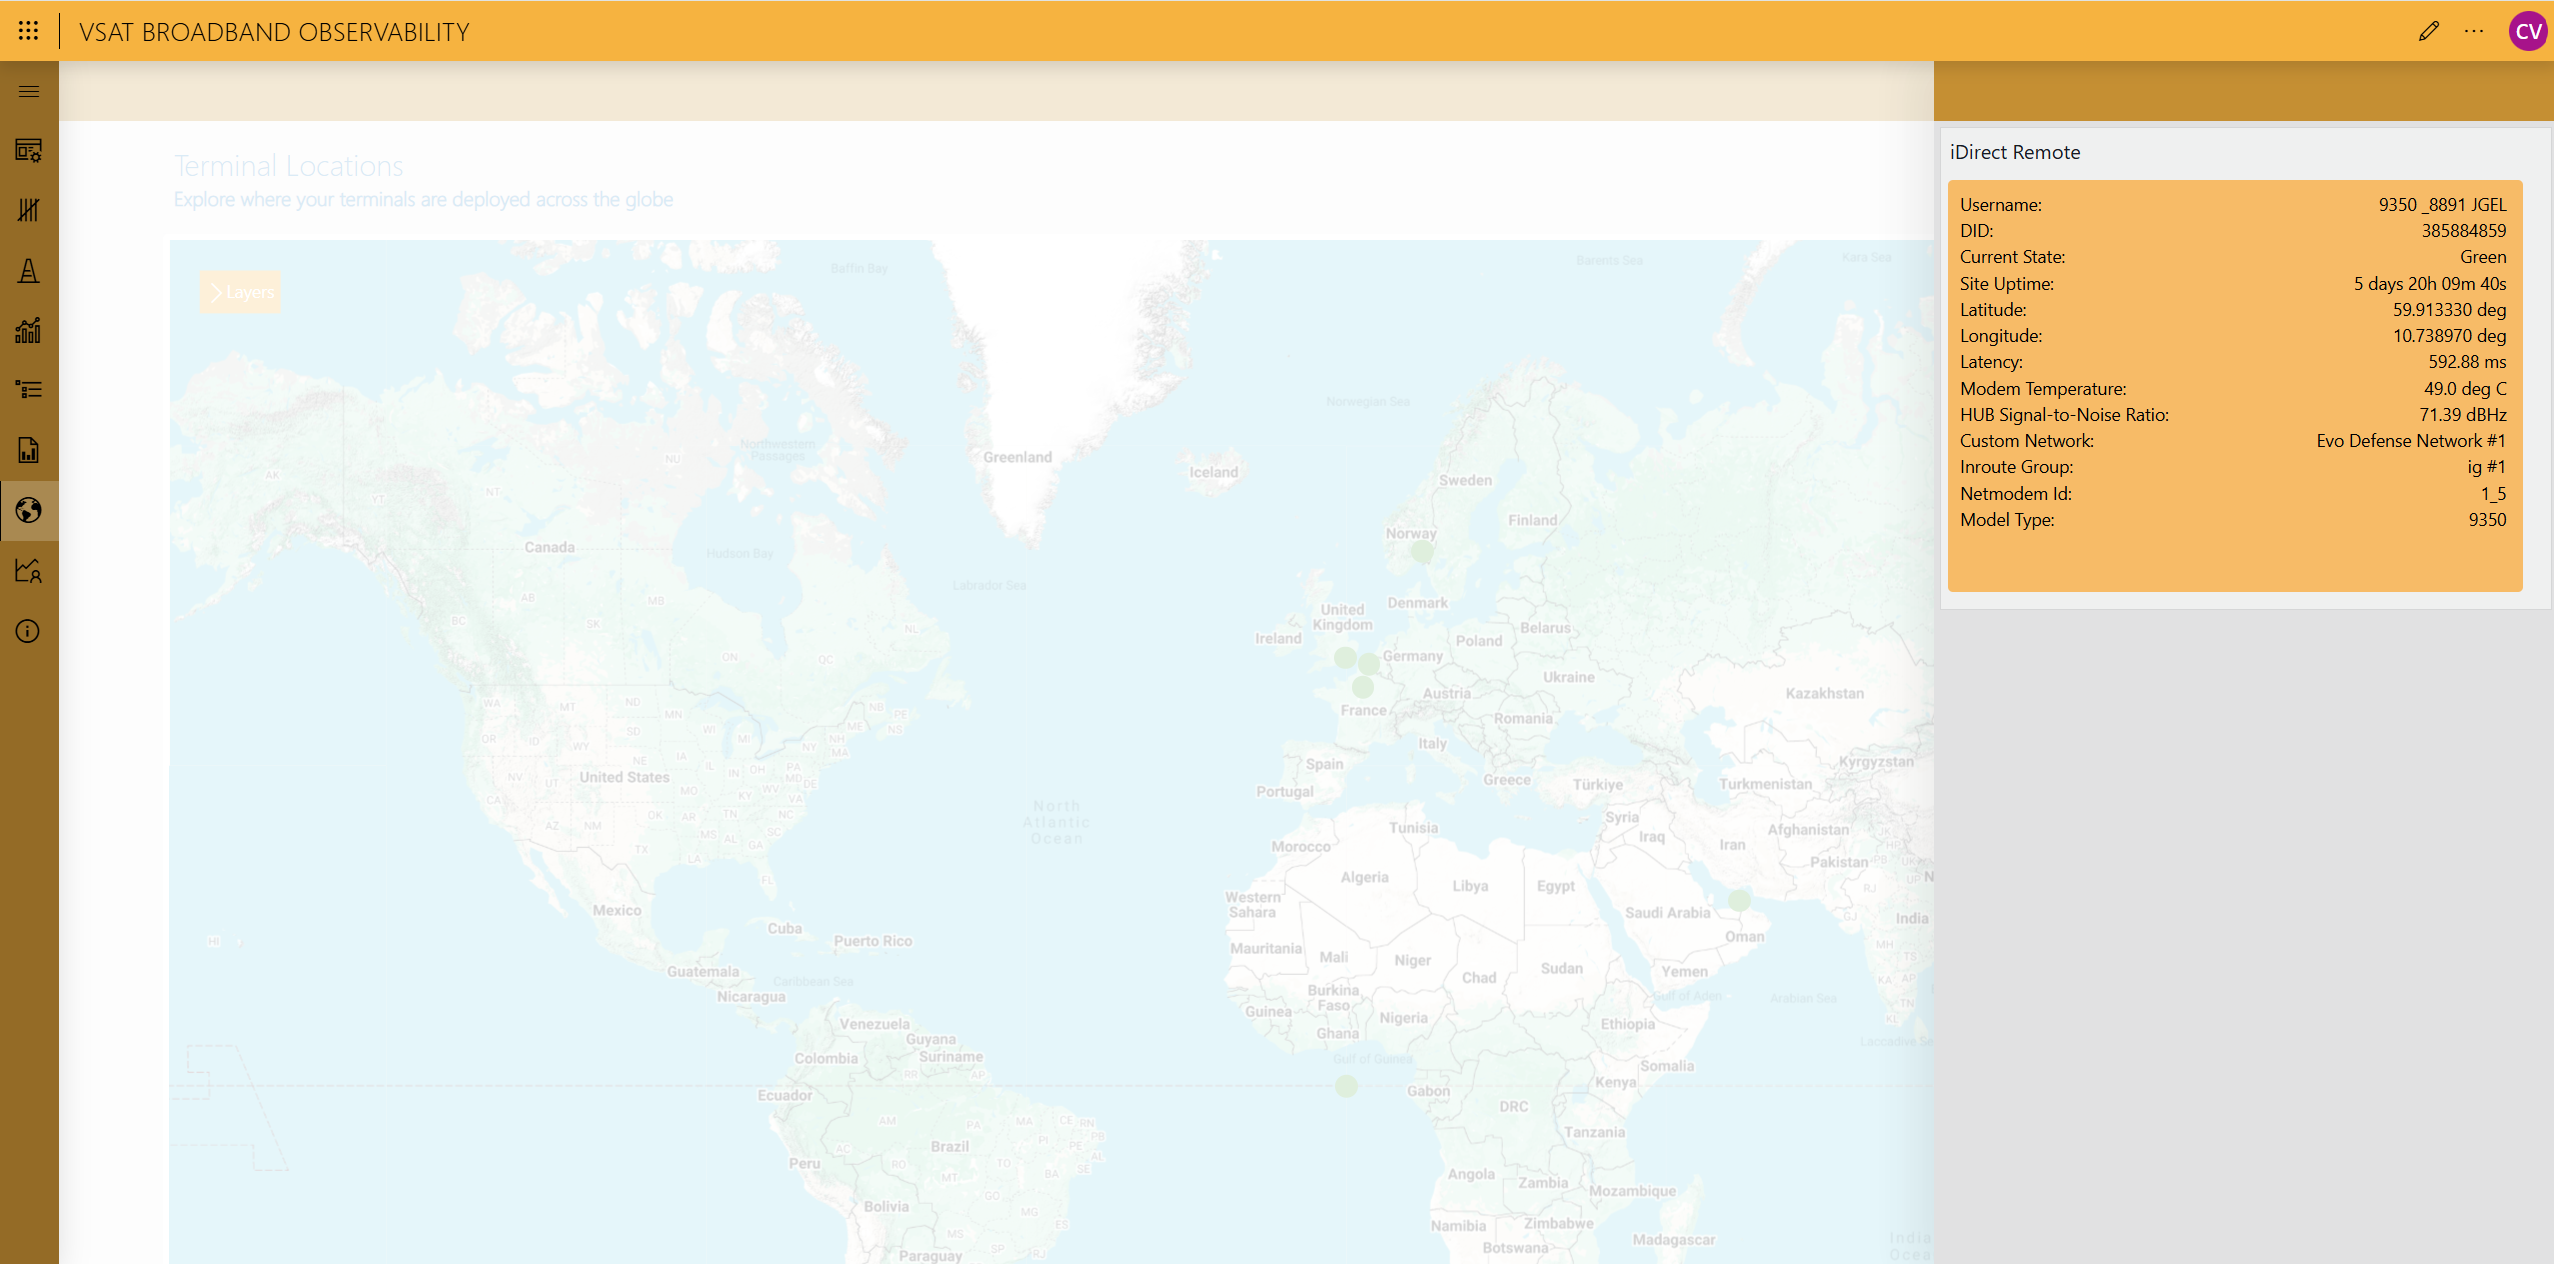 When a user selects a terminal, key information about the terminal is shown in a panel.
 This feature is extended to other VSAT platforms, like Starlink, so that the NOC operator can see all VSAT terminal locations—regardless of the underlying hub and satellite technology—in a single, unified view.
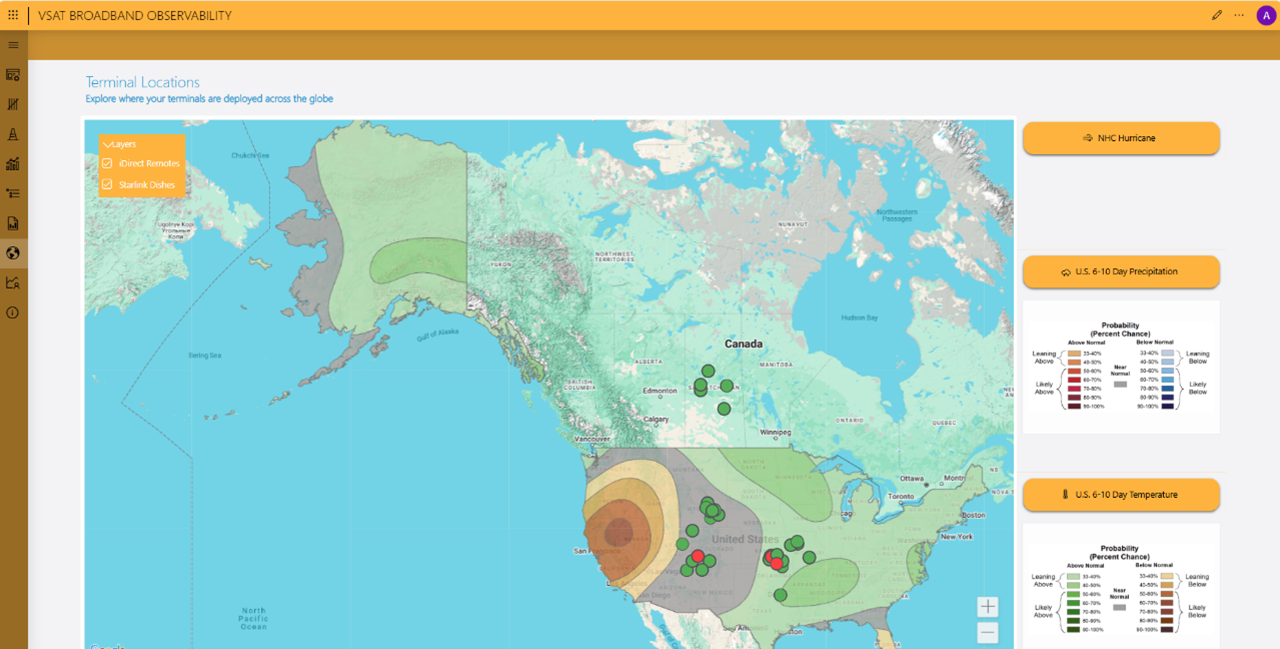
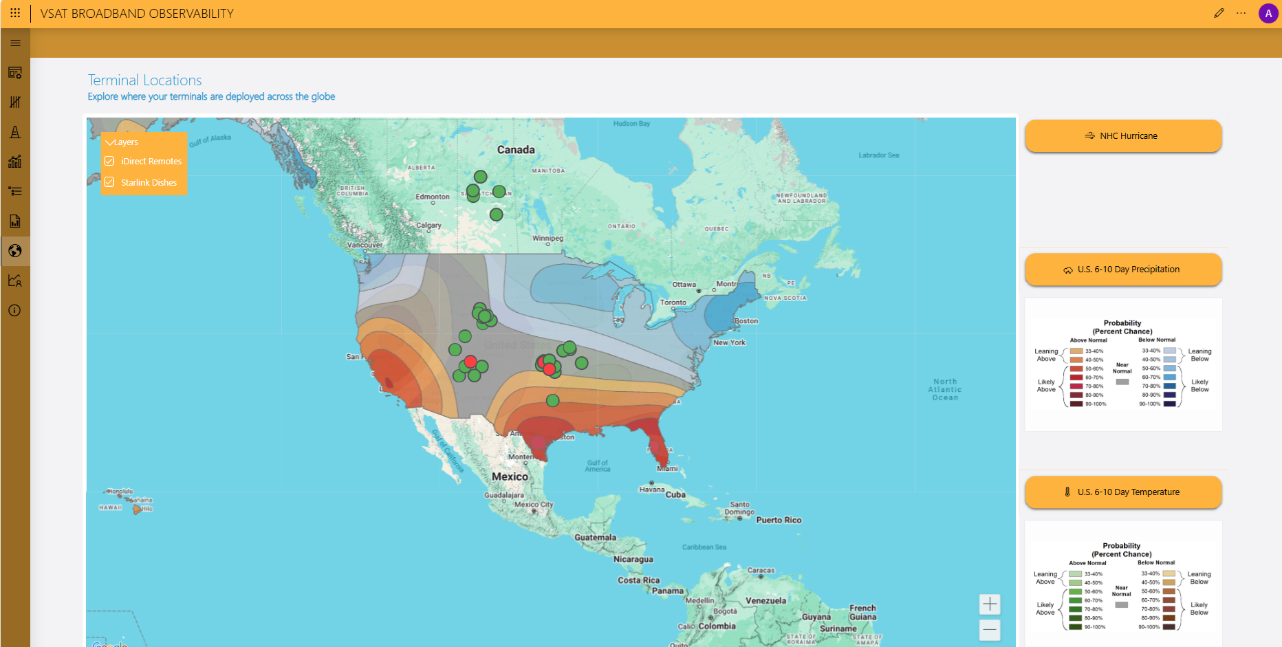 Weather overlays like precipitation and temperature can be applied to the terminal location map to identify weather-related issues on your VSAT platform.
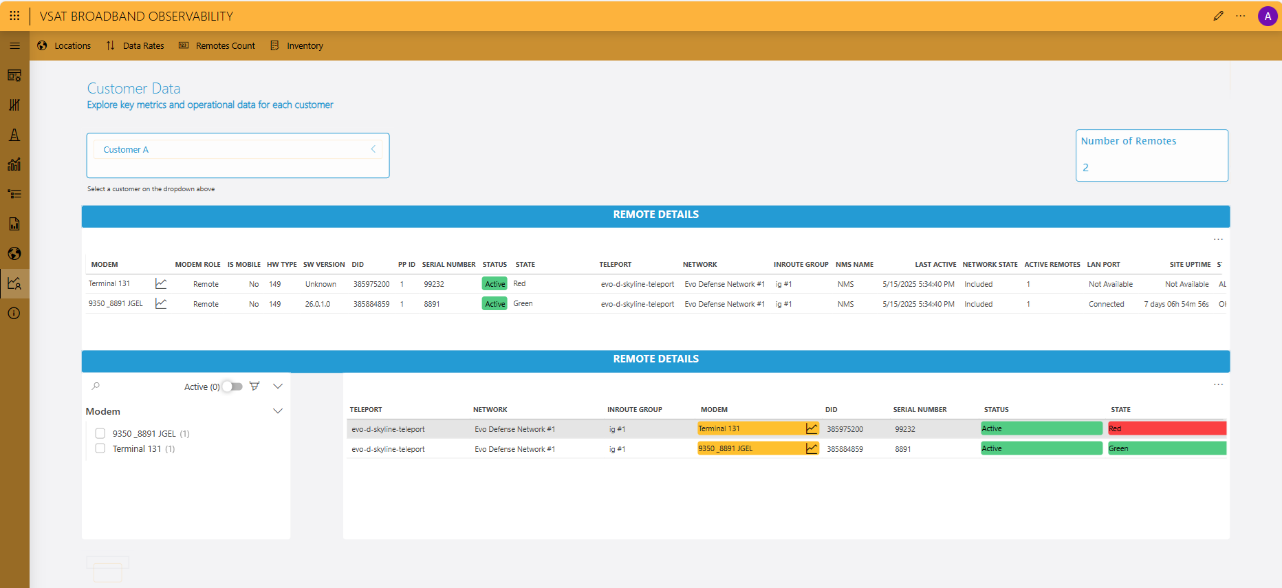 The Customer Data page and its subpages provide an aggregation summary of the VSAT network by customer.
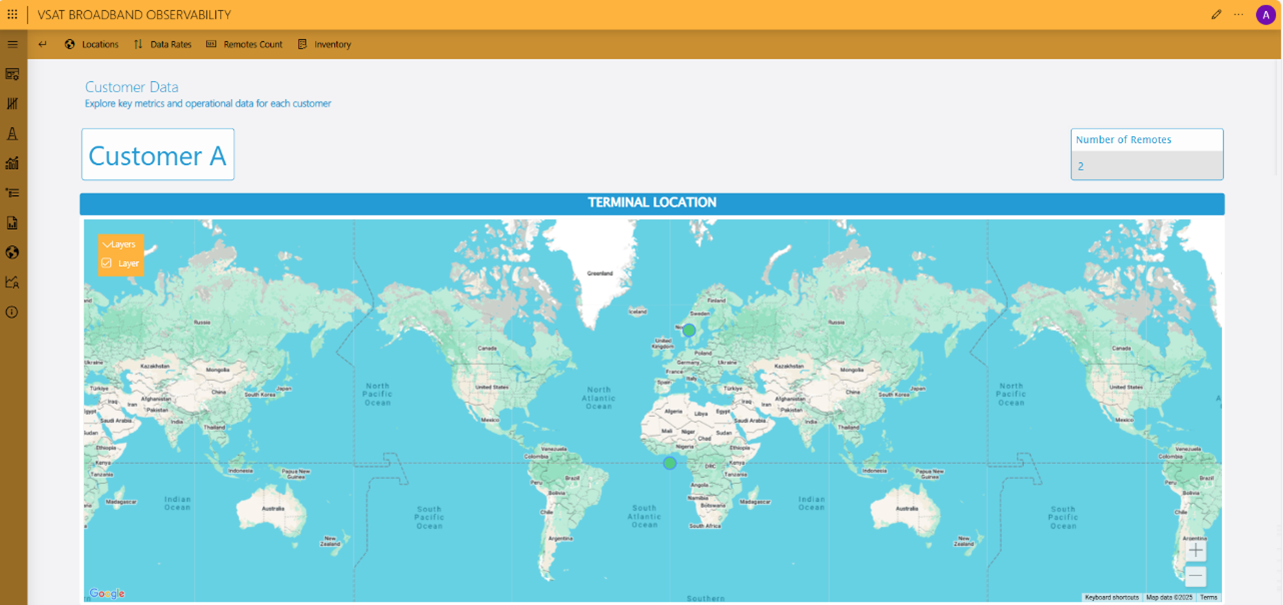 For each customer, the dashboard displays a summary of remote data, location data on a map, traffic data, remote count, and an inventory breakdown by terminal model and firmware.
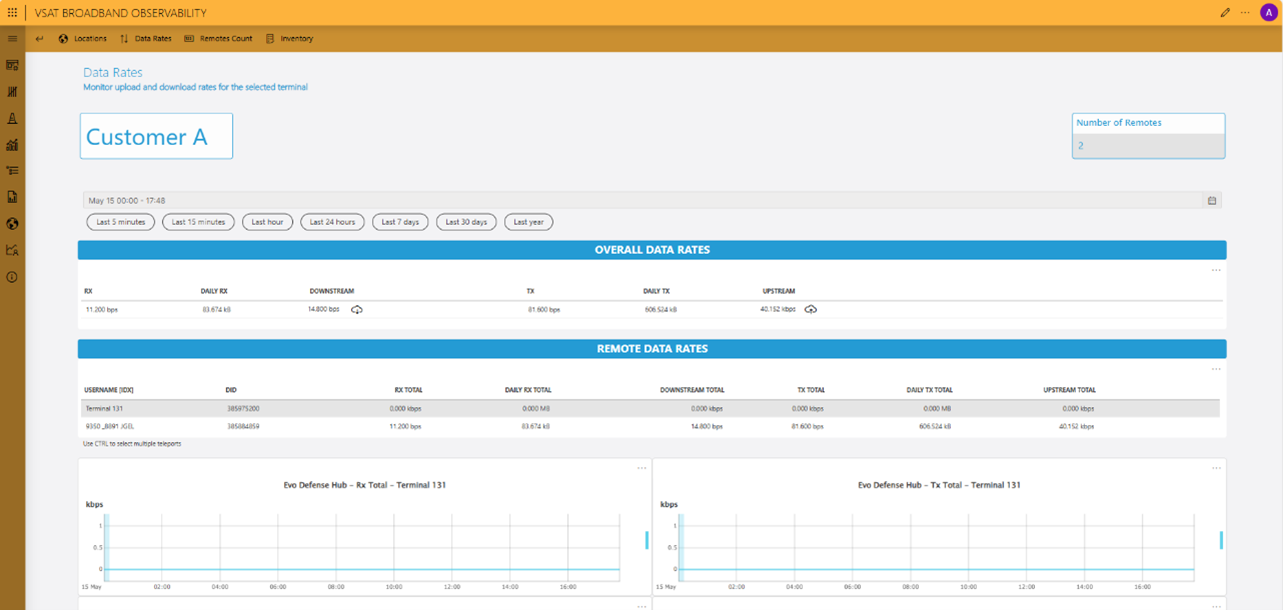 This offers a valuable snapshot of a customer’s terminals and their operational state.
1 thought on “The VSAT Broadband Observability solution”
Leave a Reply
You must be logged in to post a comment.
Excellent usecase Srikanth!