solution Use Case
The Single Support Dashboard (SSD): one platform for alarm monitoring, support incident handling, and task management
The Single Support dashboard (SSD) was developed as a unified platform tailored for the Sky Transmission Support team to centralize real-time alarm visibility and streamline access to Spark boards across various monitoring environments.
By leveraging the low-code capabilities of DataMiner and its microservices-based architecture, the solution consolidates live alerts from 5 DataMiner clusters, 17 Grafana dashboards, and Spark incident and task management into a single pane of glass. This allows the support team to monitor, triage, and respond to incidents without switching between disparate systems.
The architecture ensures ease of deployment and scalability, while no-code configuration design empowers support teams to independently manage alarm filters, cluster integration, and alert views—without any development effort. This strategy enables a rapid response to dynamic operational needs and supports automation in alarm filtering, masking/unmasking, and incident tracking.
Ultimately, the SSD reinforces control, consistency, and efficiency in complex broadcast and media operations.
Key Features
- Unified monitoring interface: Consolidates alarms from five DataMiner clusters, 17 Grafana dashboards, and Spark boards into a single, centralized dashboard.
- Real-time alarm visibility: Continuously tracks live alarms with real-time severity-based categorization for faster incident response.
- Low-code, no-code architecture: Developed entirely using DataMiner’s Low-Code Apps module, DOM, and saved alarm filters in DataMiner Cube, allowing support teams to manage and configure the application without coding knowledge.
- Customizable alarm filters: Users can select and apply cluster-specific alarm filters, dynamically adjusting what is shown on the dashboard.
- Alarm masking and ownership: Provides functionality to temporarily mask alarms or take ownership directly from the dashboard, reducing noise and enabling clear responsibility tracking.
- Integrated navigation: Cluster names in the dashboard act as deep links, enabling direct access to specific DataMiner clusters, Grafana dashboards or Spark boards for detailed investigation.
- Settings management panel: Dedicated configuration page to easily add or modify clusters, API credentials, and monitoring filters.
- Spark board integration: Automatically retrieves and displays Spark incidents and tasks for complete visibility across monitoring and support systems.
- Seamless filter creation in DataMiner: Filters created and saved in DataMiner (marked as public) are immediately available for selection within the SSD Settings page.
USE CASE DETAILS
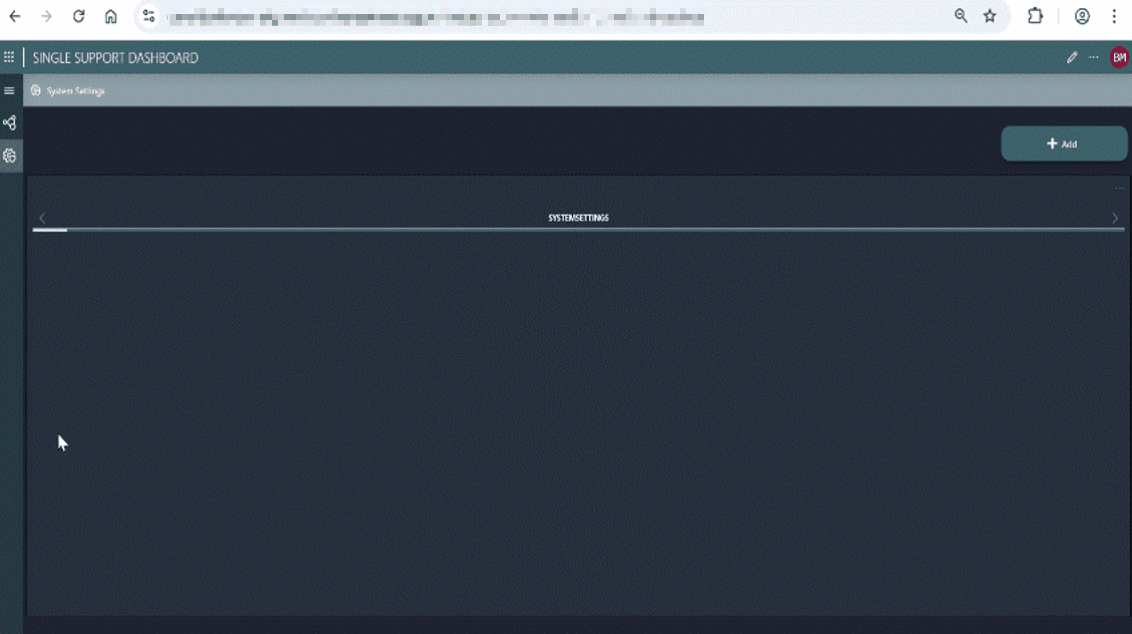
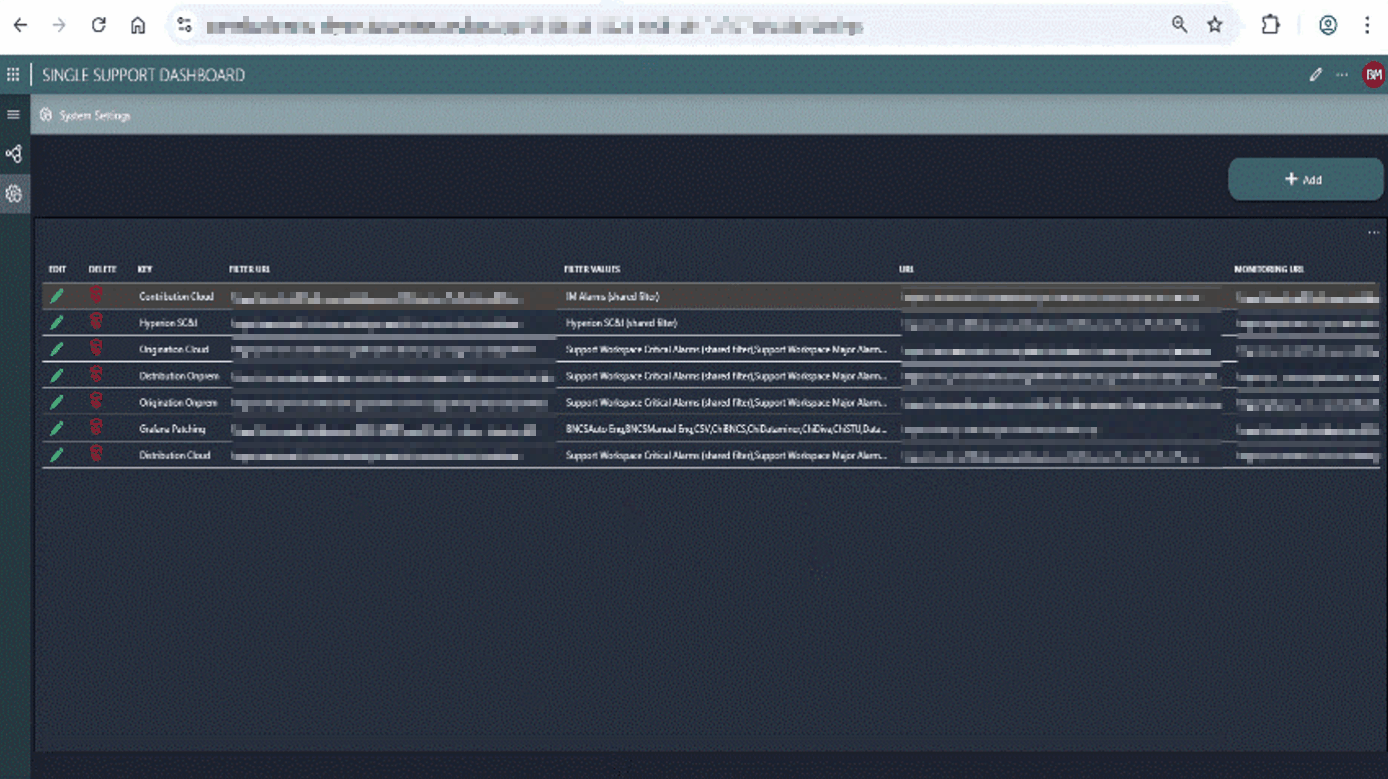 The Settings page allows teams to configure which clusters and specific alarm types are visible on the dashboard.
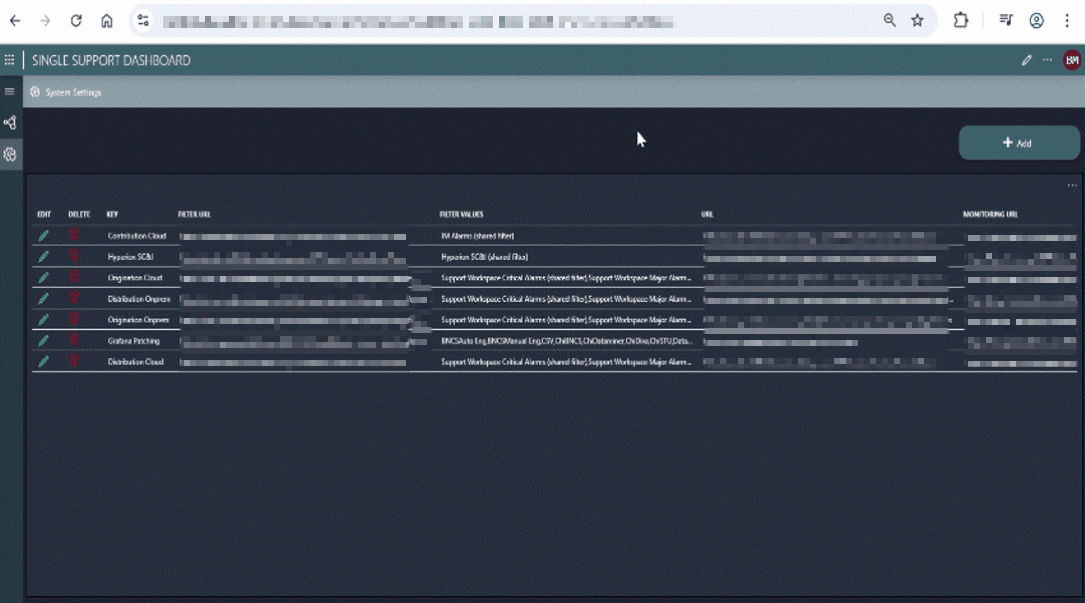 Operators can add clusters by inputting credentials and API tokens, retrieve available alarm filters, and select the relevant ones for visualization. This promotes tailored monitoring for different operational priorities.
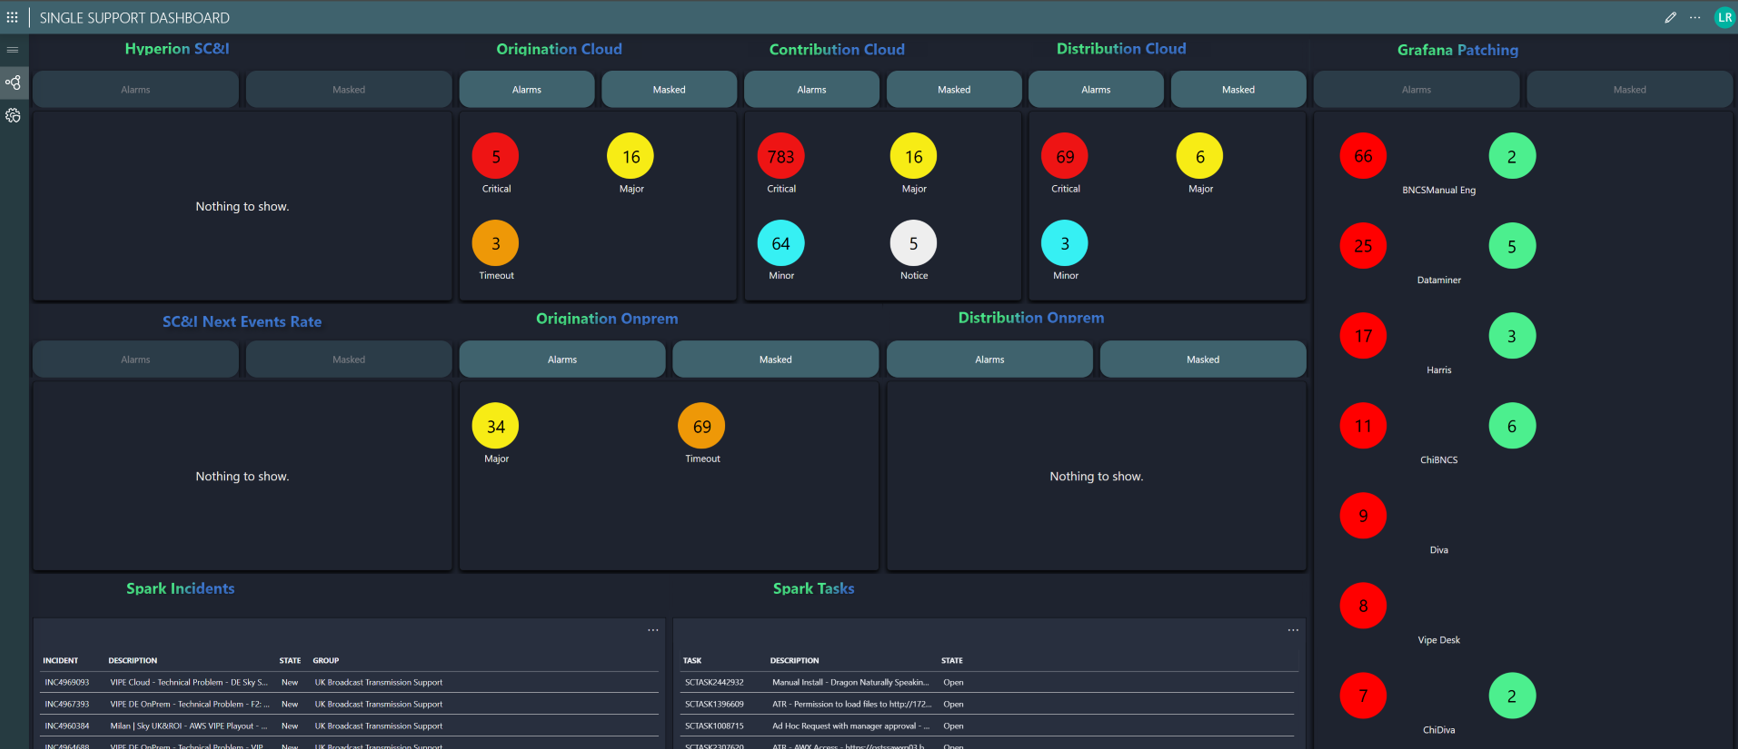
 The dashboard aggregates alarms from 5 DataMiner clusters, 17 Grafana dashboards, and Spark incidents/tasks. Alarms are categorized by severity, and clicking a severity count filters the list accordingly. Each cluster title links directly to the corresponding system (e.g. DataMiner or Grafana), allowing quick access for deeper investigation.
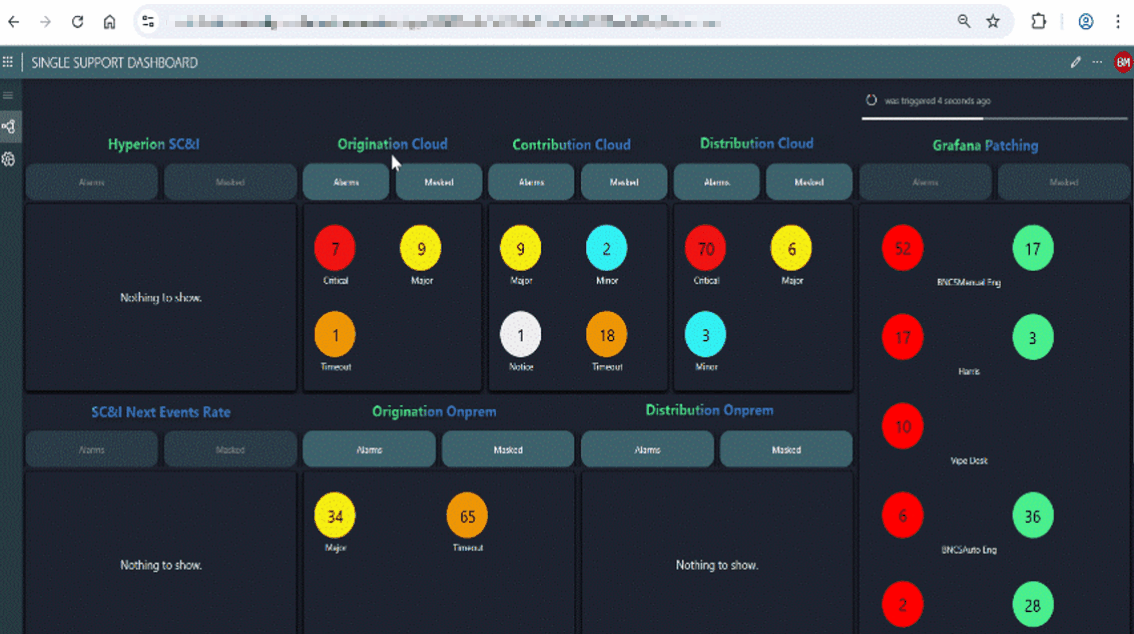 Operators can mask non-critical alarms directly from the dashboard interface and later unmask them when relevant. This helps reduce noise in live monitoring without losing track of important alerts.
 Users can create custom alarm filters directly in DataMiner and make them public. These filters will then appear on the SSD Settings page, allowing seamless integration into the dashboard display.