solution Use Case
Smart Lights Management with DataMiner CityOps
Smart, connected, and efficient city lighting with DataMiner CityOps
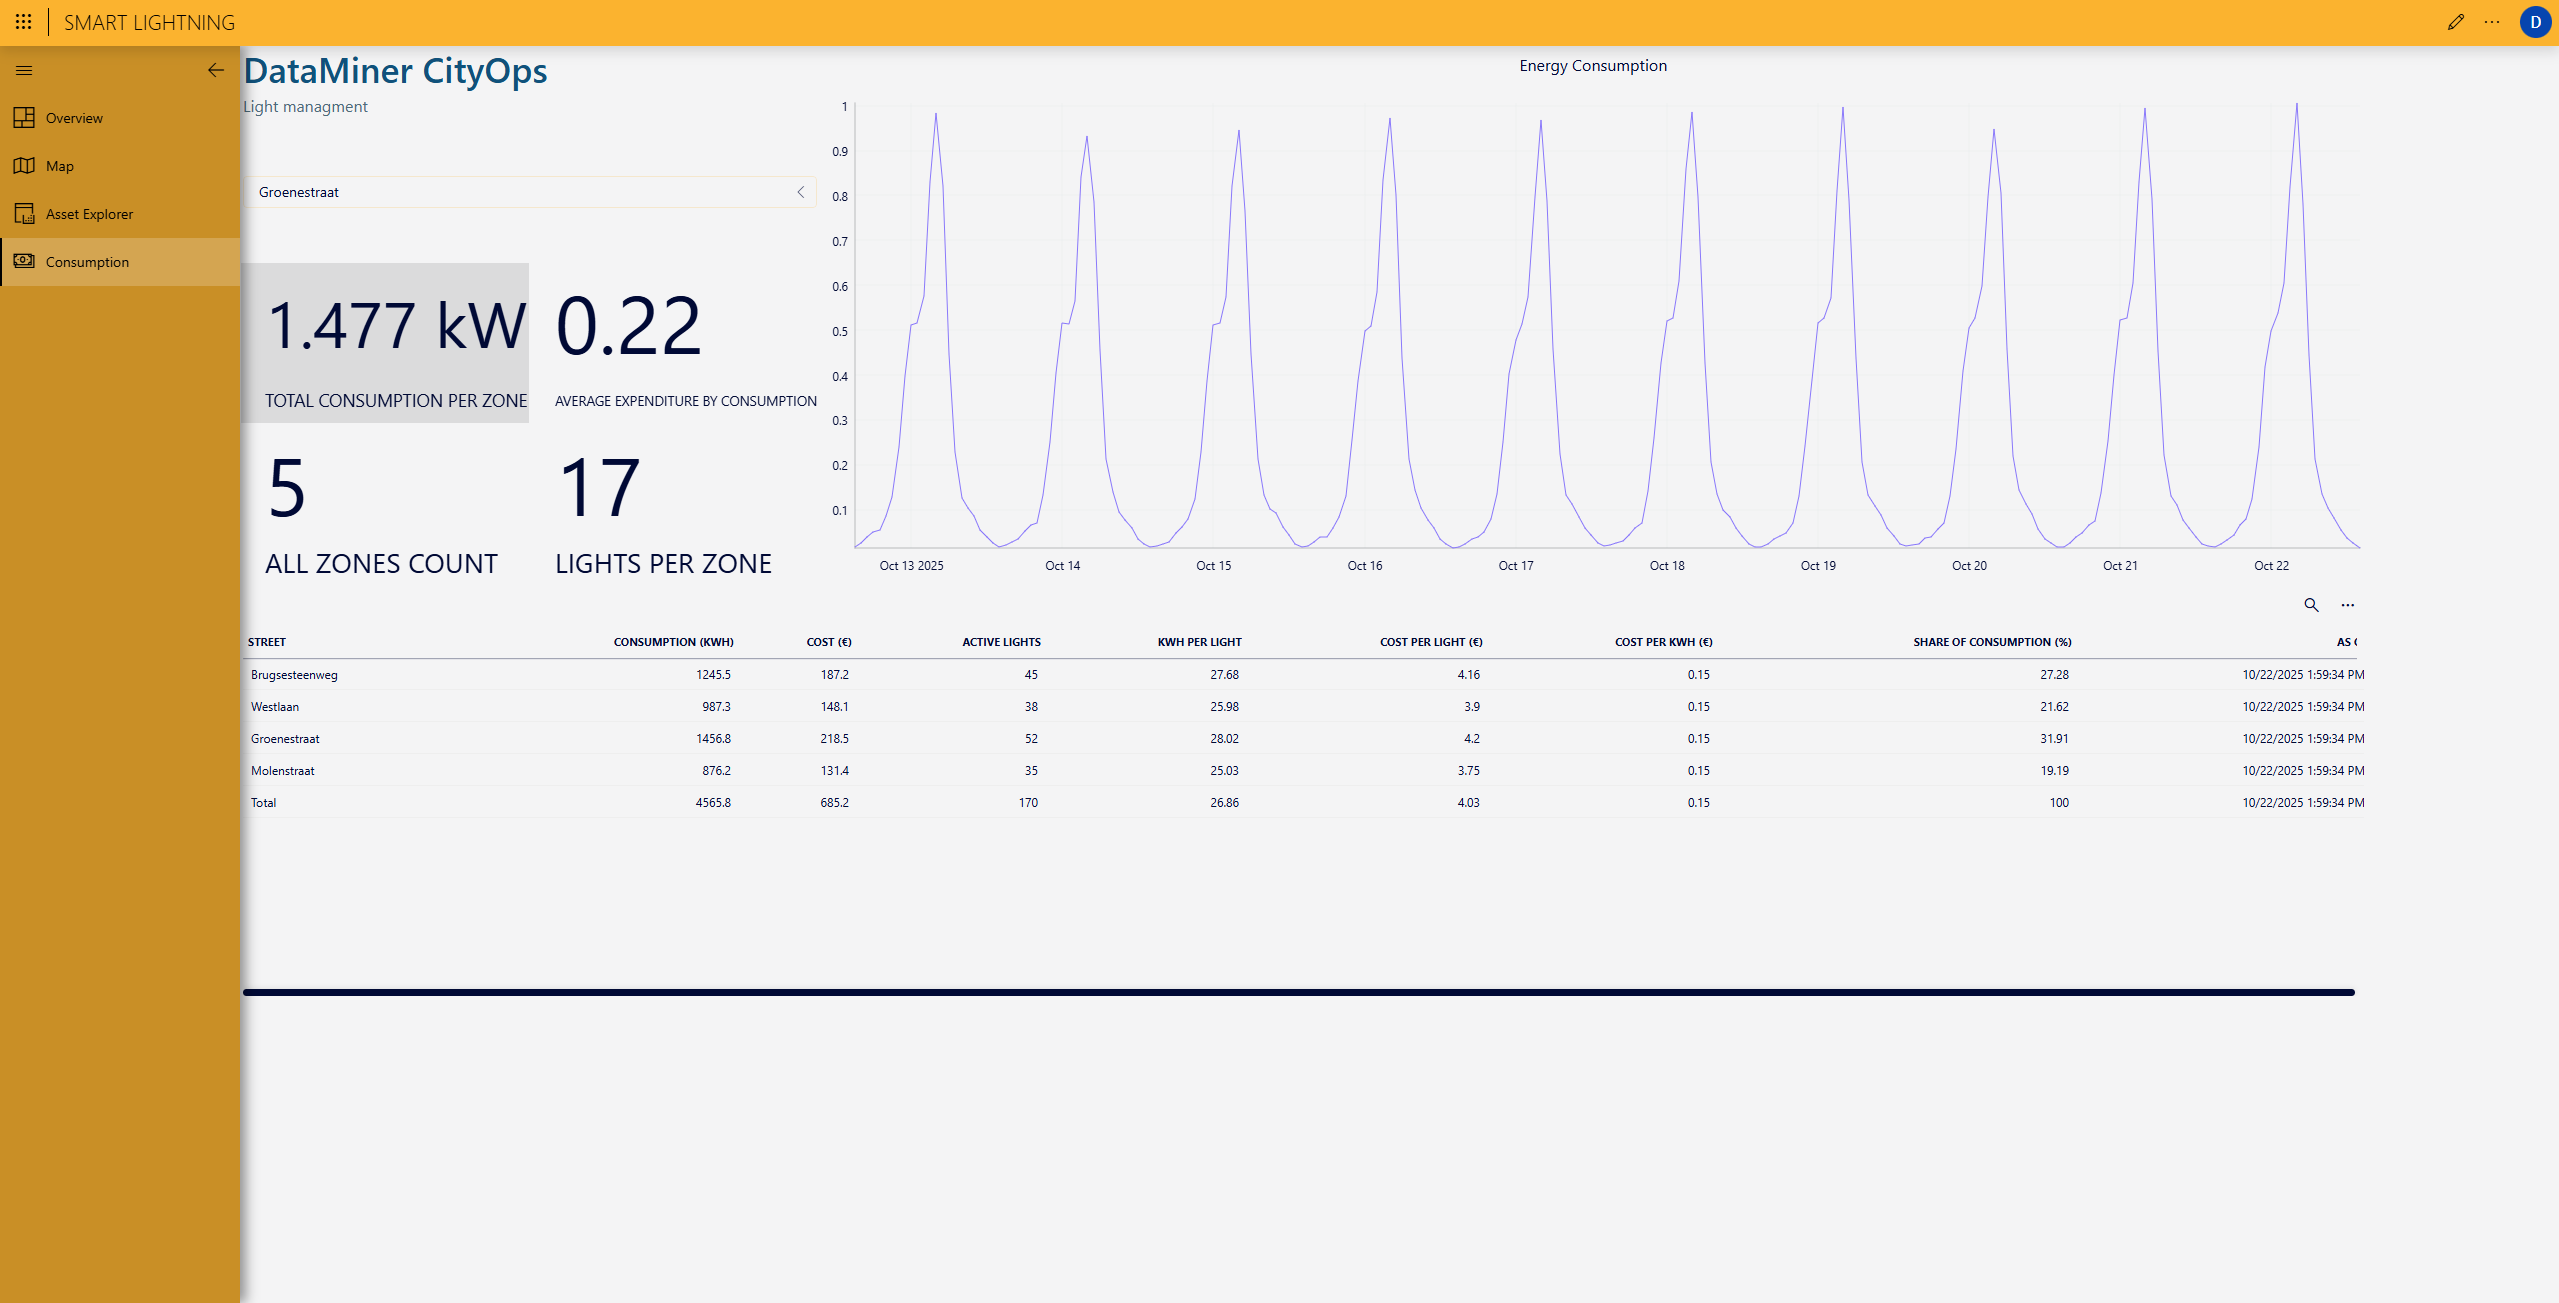
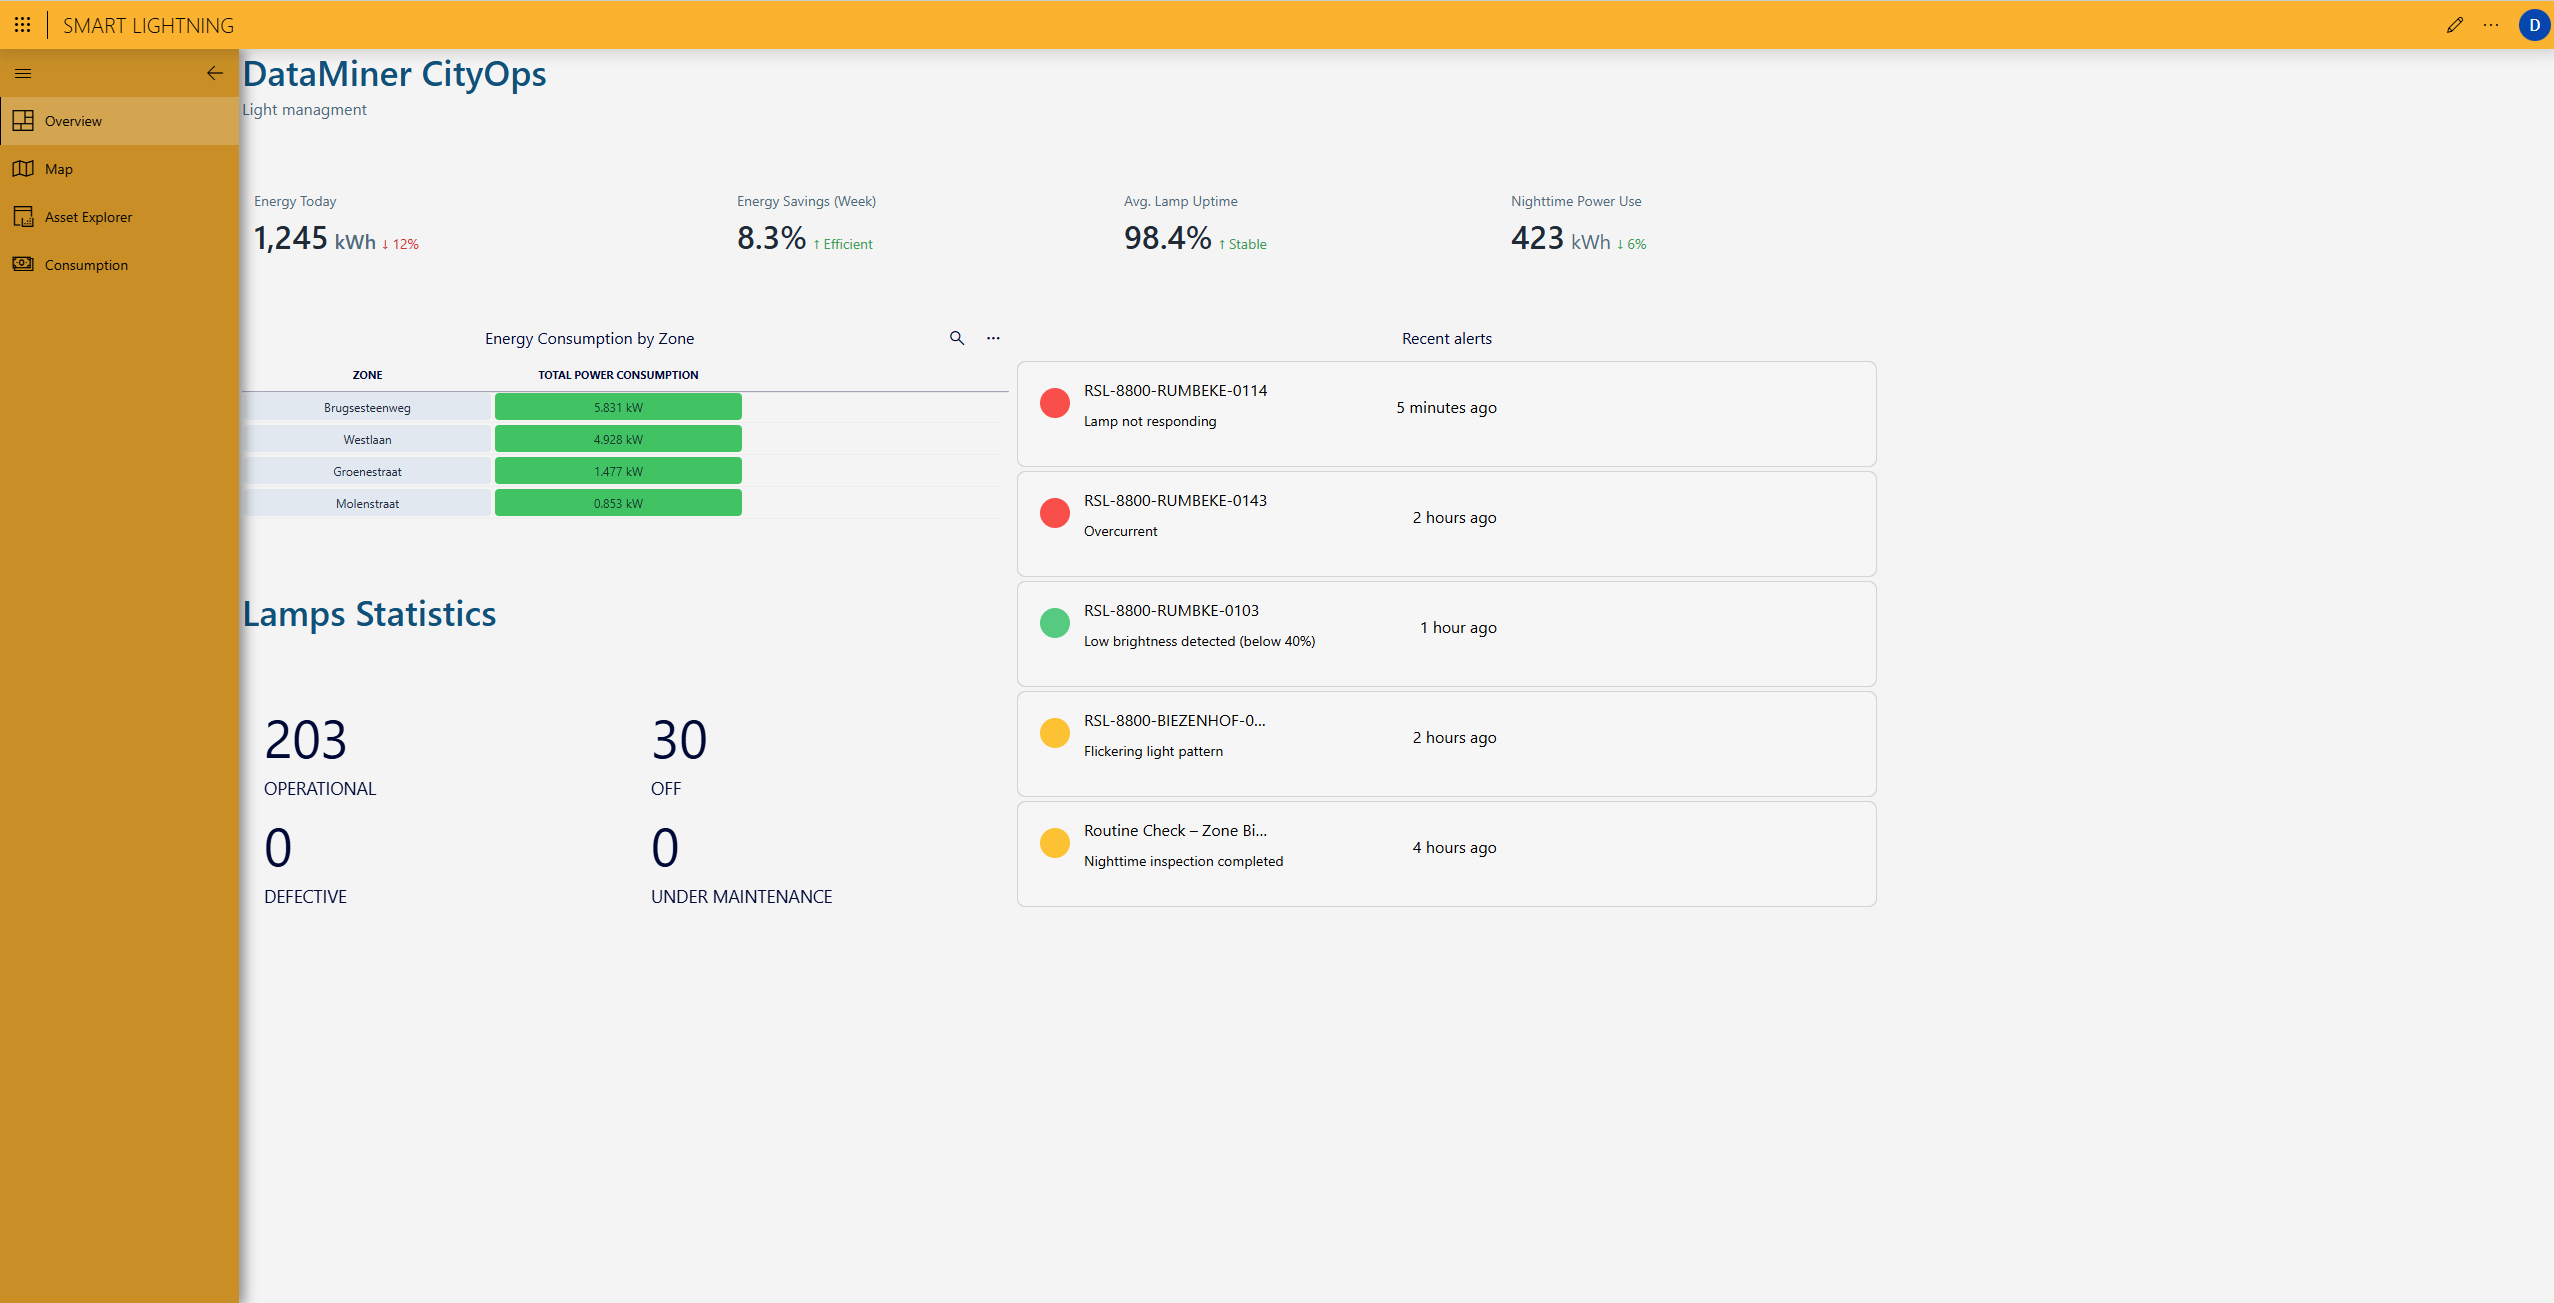
The Smart Lights Management module in DataMiner CityOps provides a unified real-time view of the city’s entire public lighting network. Key indicators such as daily energy use, weekly savings, average lamp uptime, and nighttime power consumption are tracked automatically. Energy consumption is grouped by zone to pinpoint inefficiencies. Alerts highlight anomalies like overcurrent, non-responsive lamps, or brightness drops, allowing immediate response. Lamp statistics show how many units are operational, turned off, or under maintenance, helping operators monitor performance and reliability across the fleet.
USE CASE DETAILS
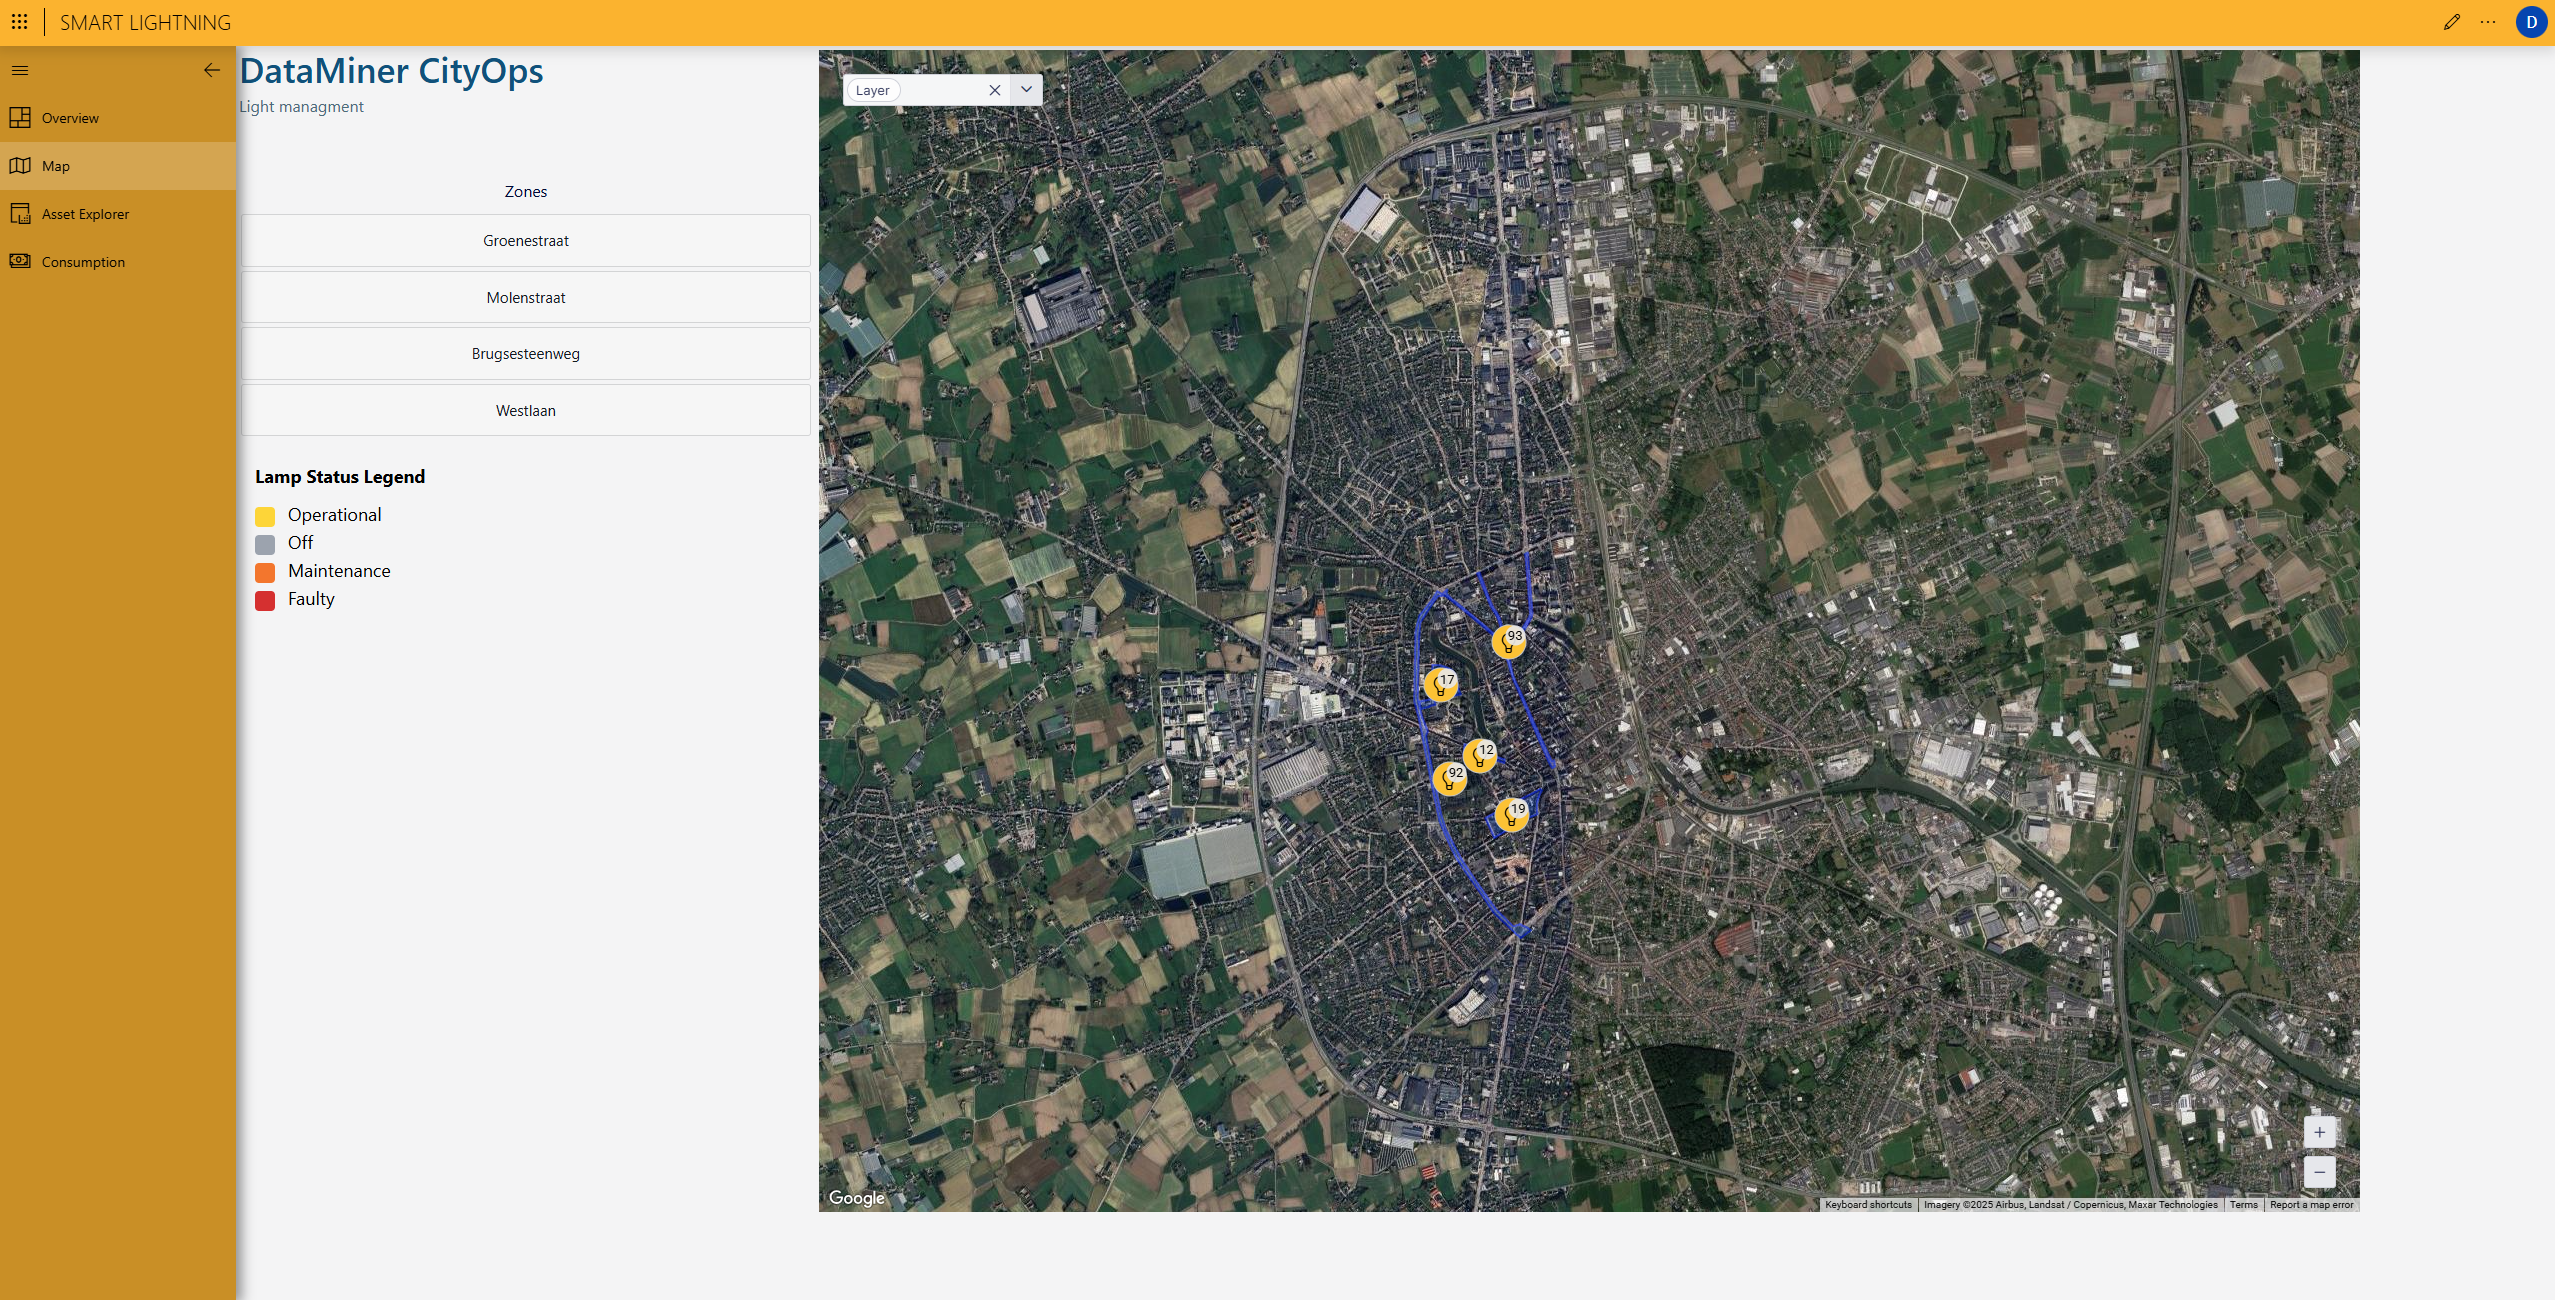
City map
A dynamic city map displays all streetlights with precise geolocation. Operators can view each zone’s boundaries, switch between map layers, and use a clear color legend to understand the operational status of every light. This spatial view supports rapid identification of outages, assists maintenance routing, and ensures that lighting performance aligns with safety and sustainability goals.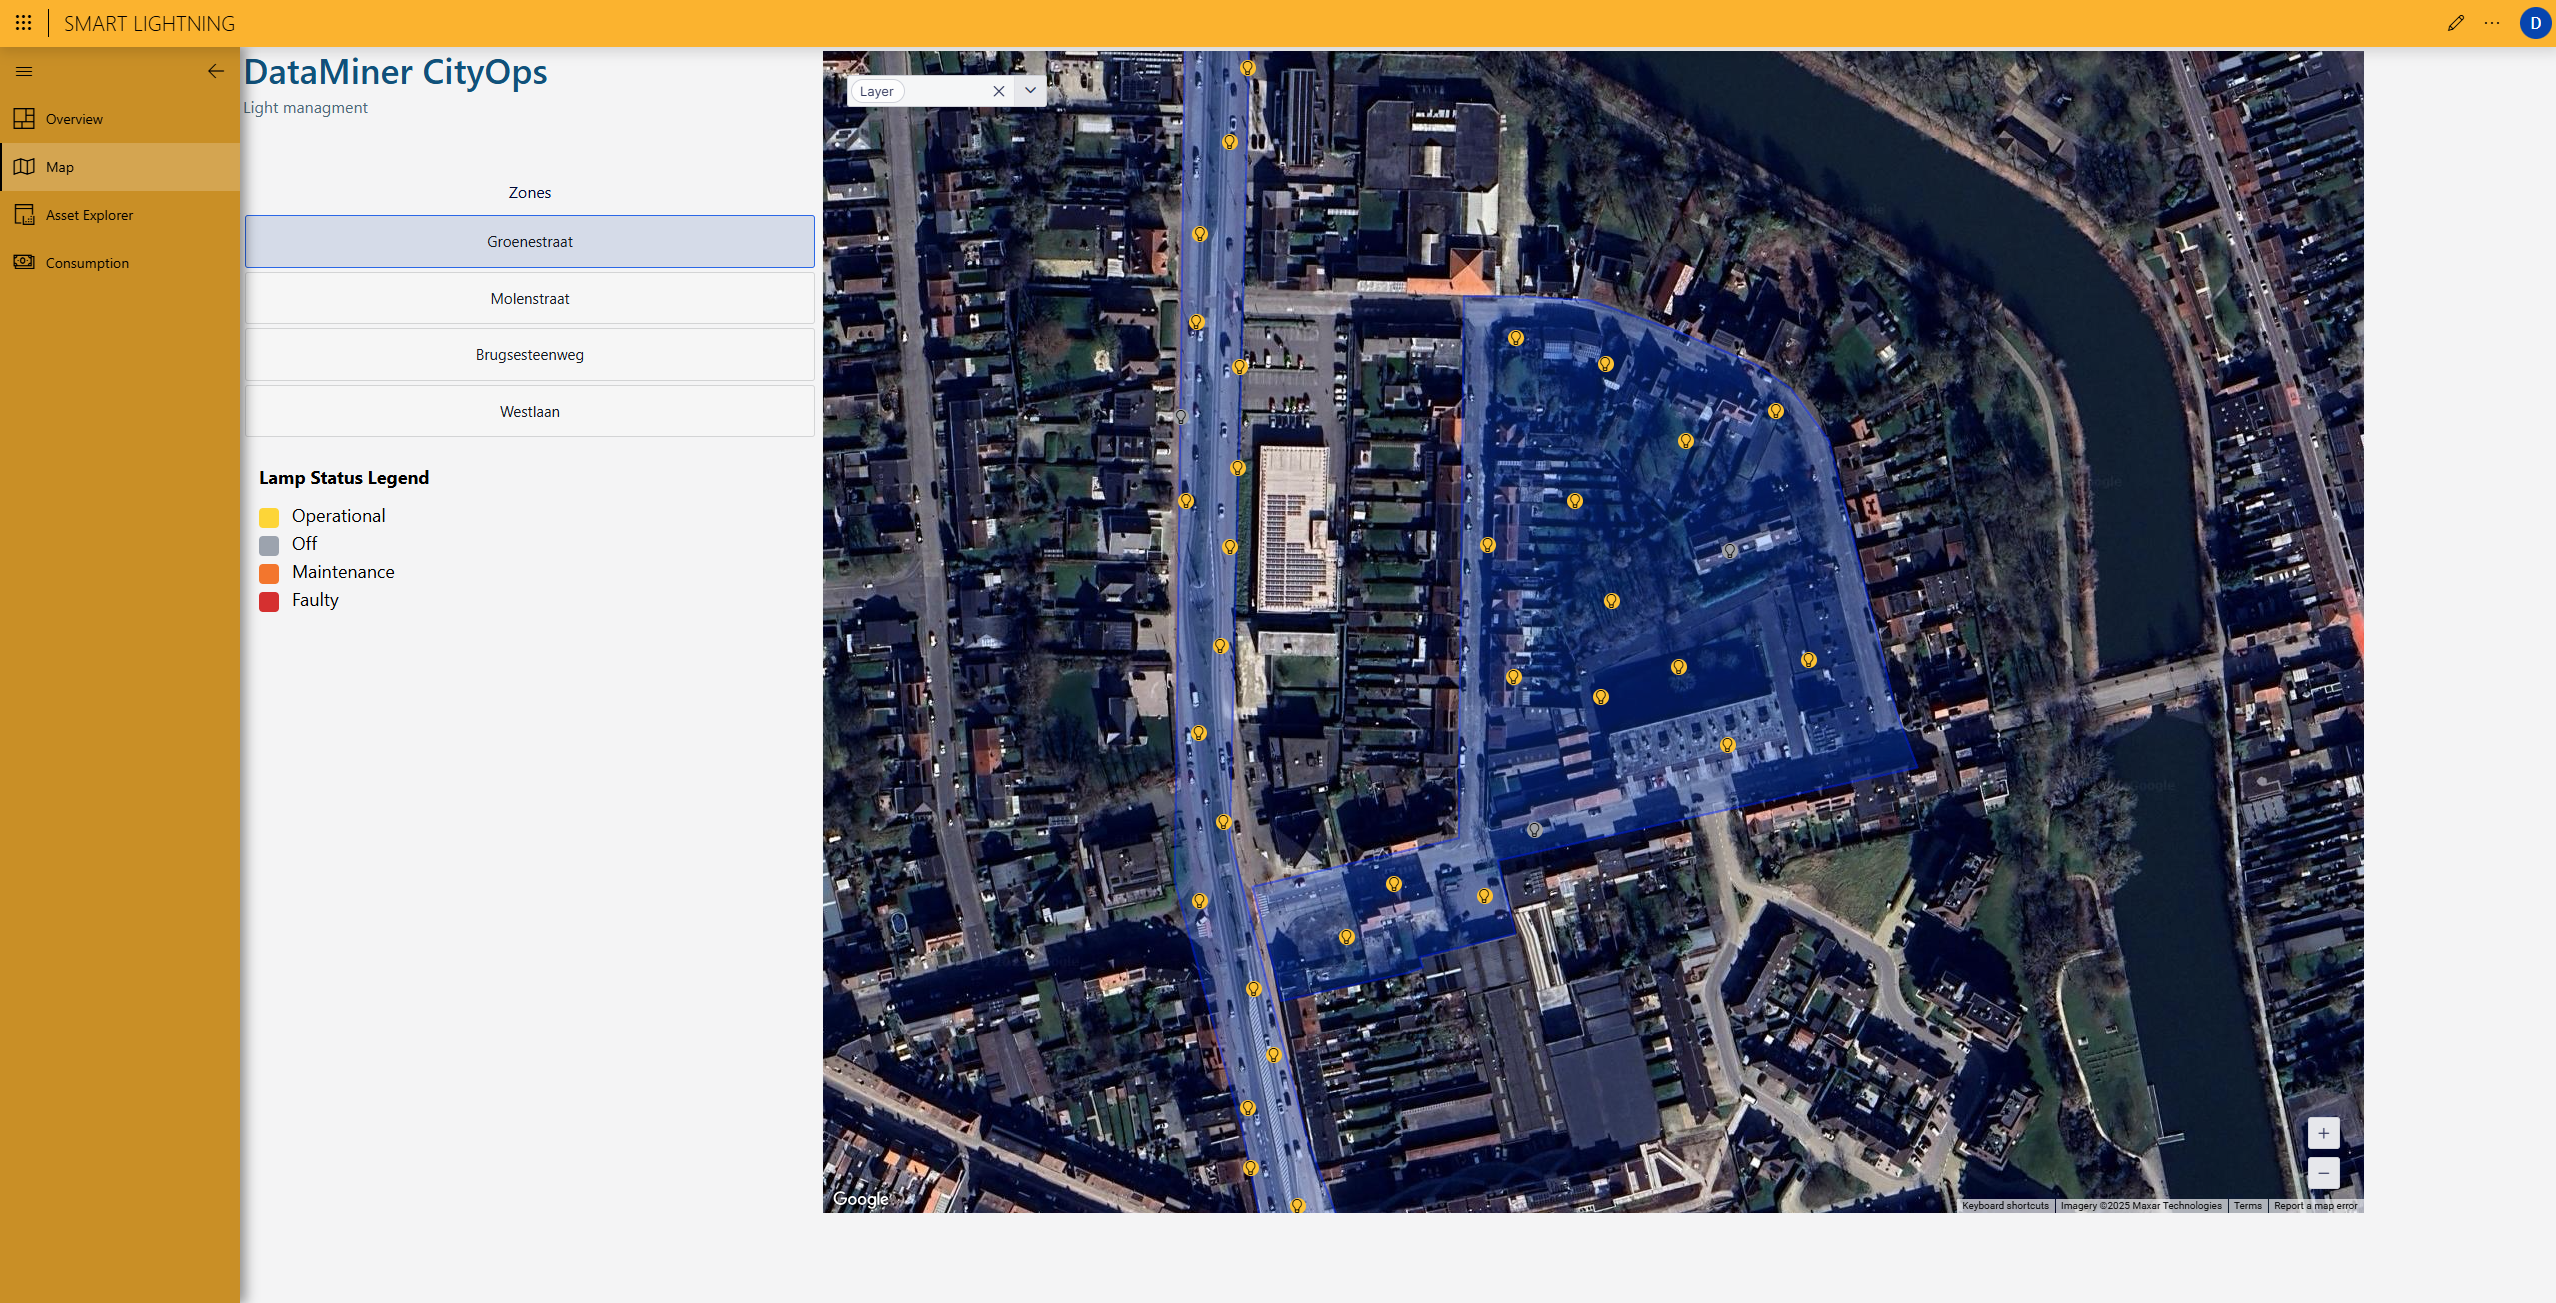
Zone drill-down
Focusing on a selected zone reveals the detailed polygon boundary and the distribution of lights along its streets. Each lamp’s live status is visible, helping planners assess coverage quality and energy efficiency at micro-level. This level of precision enables data-driven adjustments of dimming profiles, ensuring optimal illumination and lower energy costs.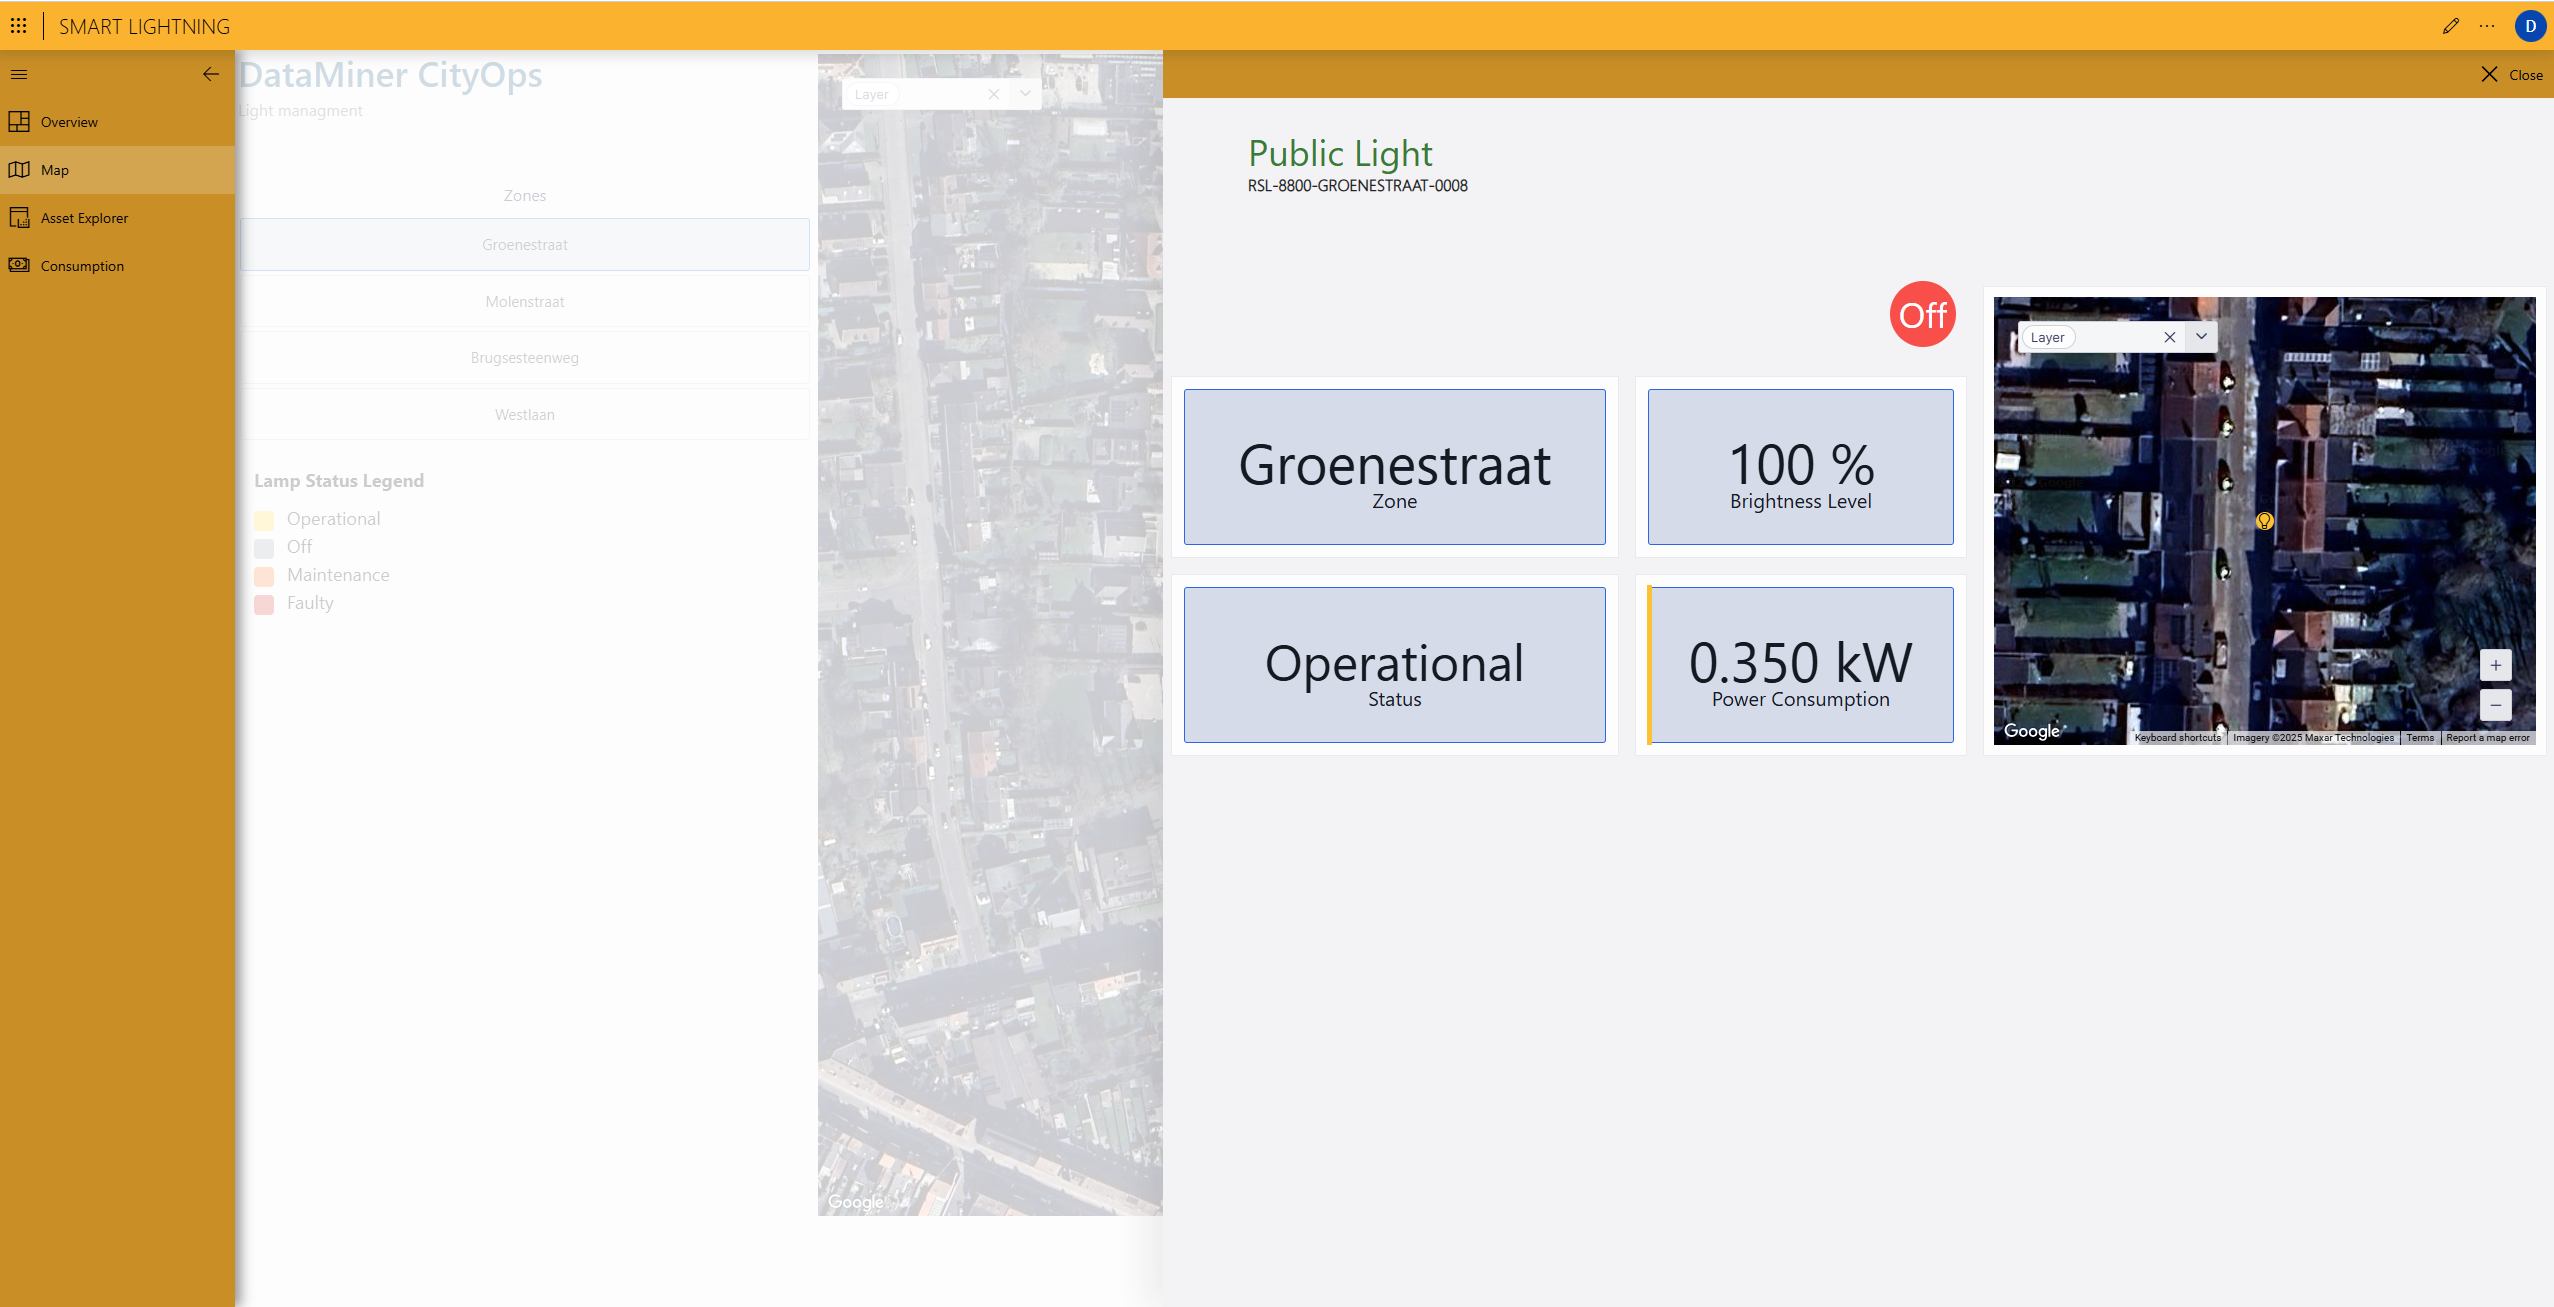
Lamp detail
Each lamp can be inspected individually. Operators can see the assigned zone, current brightness level, operational state, and real-time power draw. The embedded satellite view helps maintenance teams locate the light quickly for repair or inspection. This accelerates response time and ensures the right technician reaches the correct site without delay.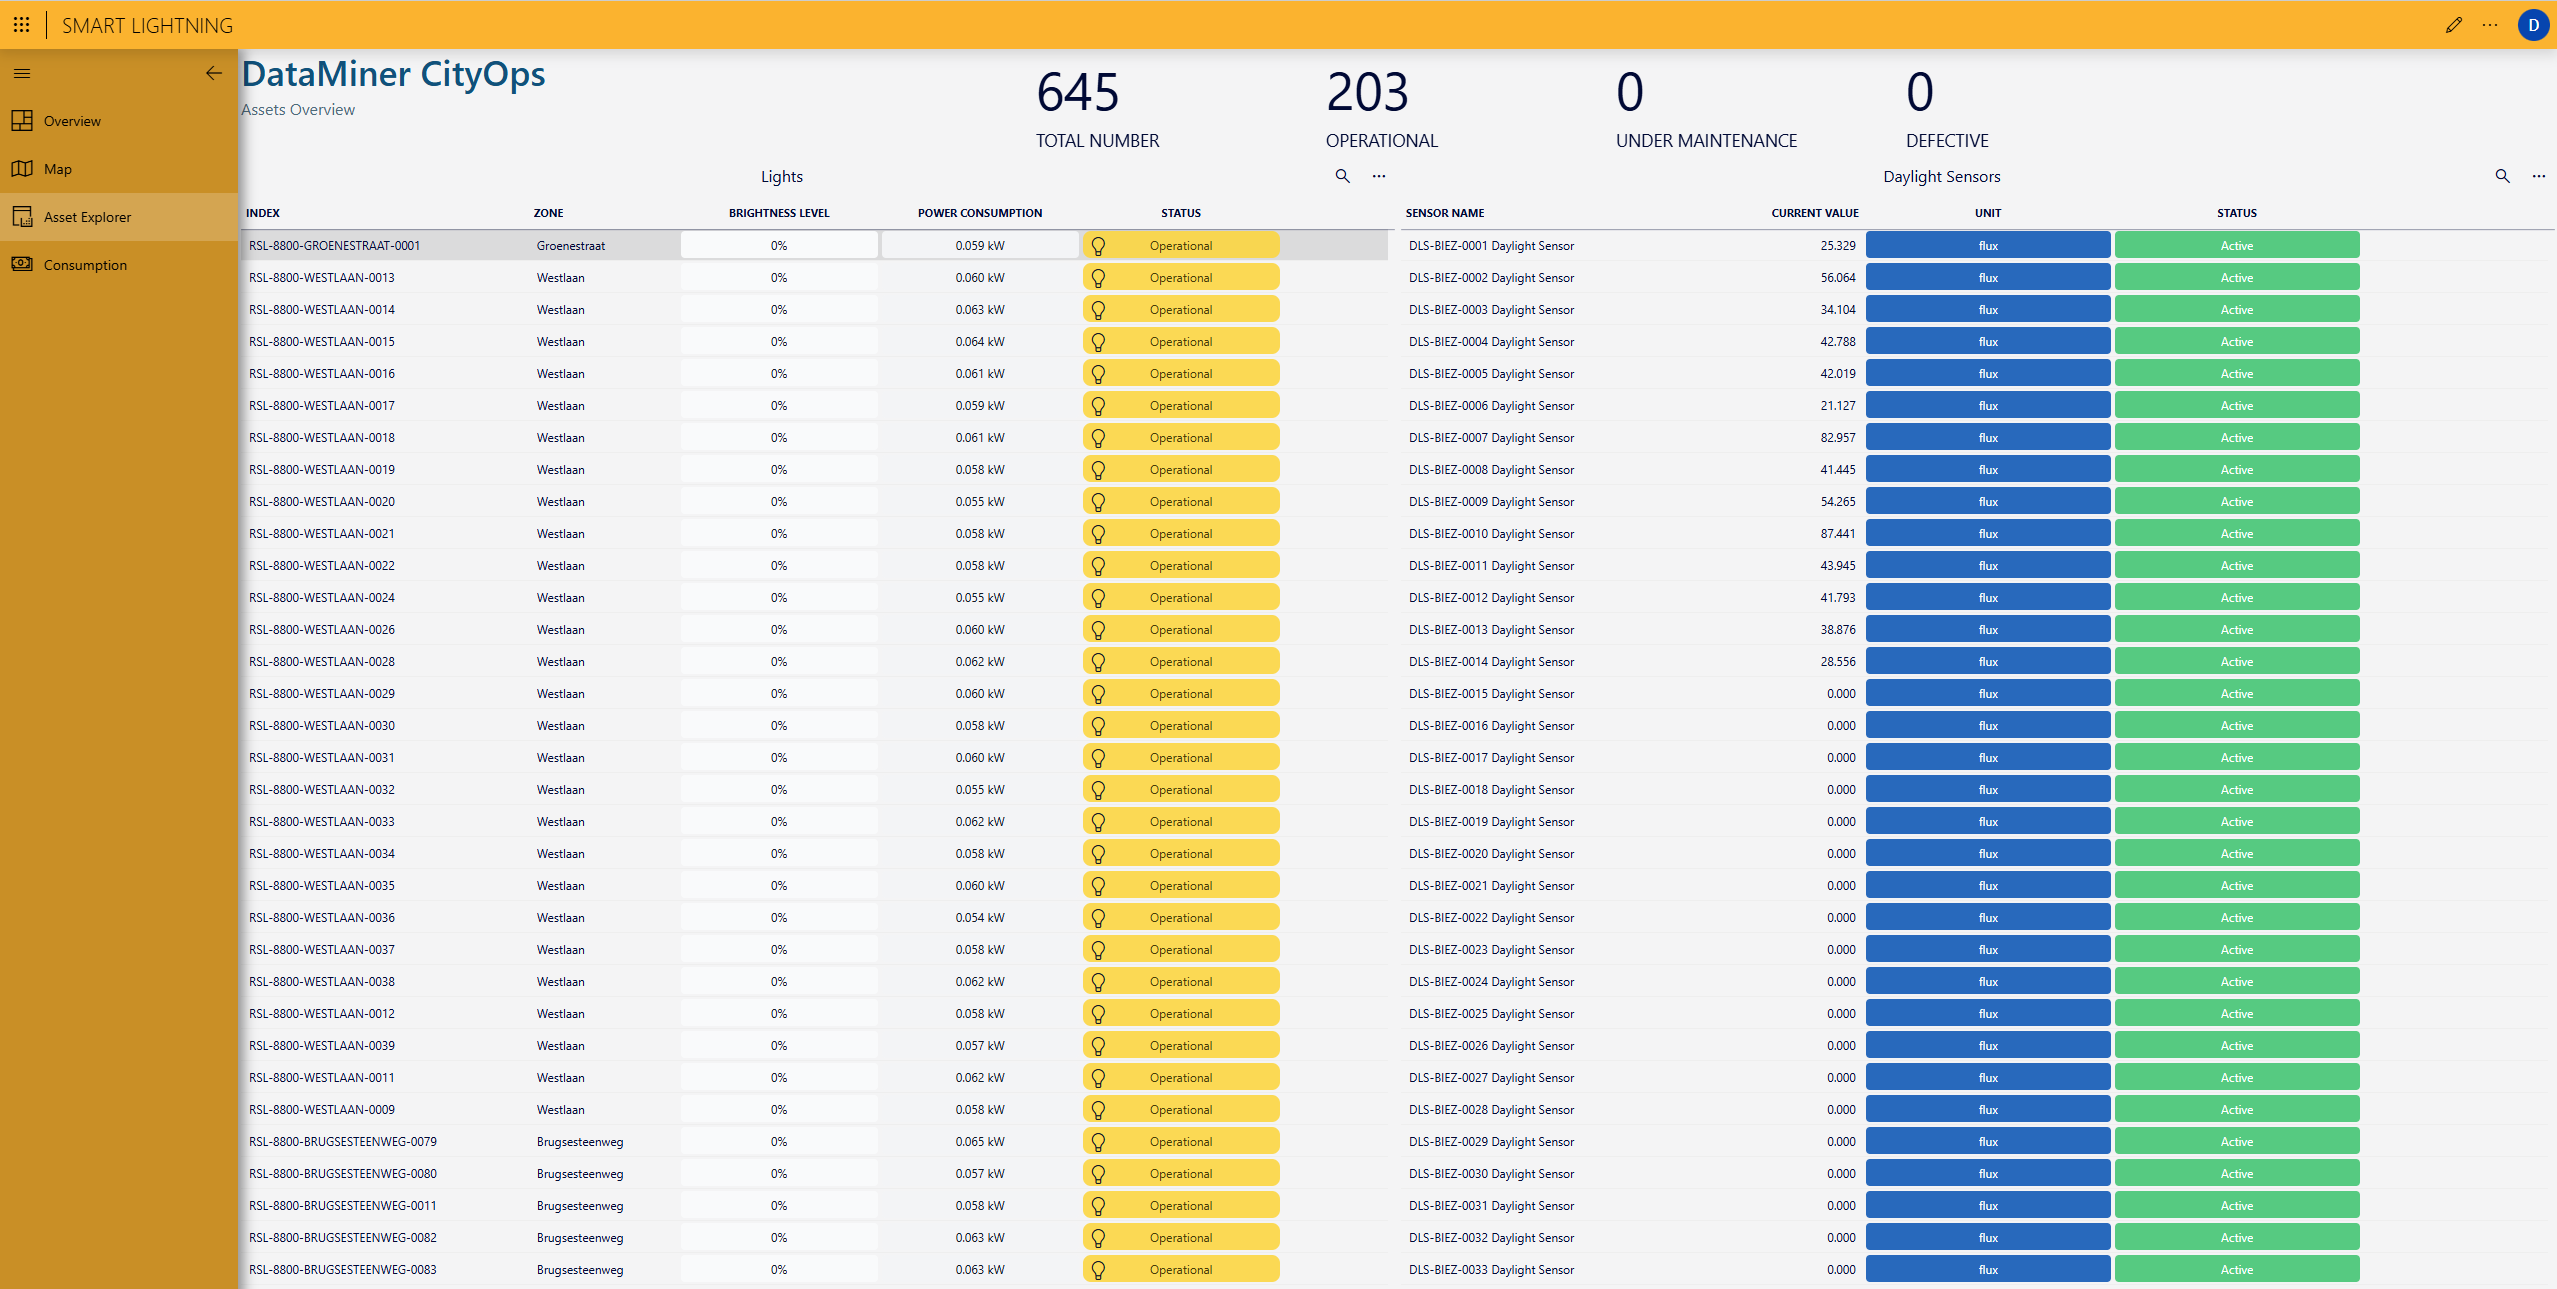
Asset Explorer
On the Asset Explorer page, all assets are organized in an interactive explorer that combines streetlights and related daylight sensors. The table lists power consumption, brightness, and live sensor readings, offering a complete asset inventory. Fleet totals at the top display how many lights are active, turned off, or under maintenance. This supports lifecycle tracking, warranty management, and planning of proactive replacements.