solution Use Case
Simplifying service orchestration: DataMiner integrates Nimbra Vision
In the evolving landscape of media and network infrastructure, the ability to orchestrate services across diverse technologies is no longer a luxury, it's a necessity. Traditionally, device-centric products have focused on managing their own configurations, leaving gaps in visibility and control across the broader ecosystem. This is where DataMiner has stepped in, offering a holistic view that empowers users to define and manage end-to-end services across their infrastructure.
DataMiner offers powerful orchestration capabilities that not only enable seamless integration with each device’s unique features, but also allow existing management tools to be leveraged when they already provide the required functionality. That's why Skyline Communications and Net Insight have partnered to develop the Nimbra Vision DataMiner integration. This collaboration bridges the gap between device-specific functionality and holistic network management.
What is Nimbra Vision?
Nimbra Vision is Net Insight’s management platform for Nimbra MSR networks, designed to simplify operations for demanding services. With features like provisioning, scheduling, and autorouting, it offers a service-centric approach to managing multi-service networks.
Key features of the DataMiner Nimbra Vision solution
The integration of Nimbra Vision into the DataMiner ecosystem enhances DataMiner’s role as a central orchestration platform, enabling it to leverage Nimbra Vision’s native intelligence while maintaining a comprehensive view of the entire infrastructure, including products from other vendors. The DataMiner Nimbra Vision solution enables:
- End-to-end service orchestration across heterogeneous environments
- Single-pane-of-glass monitoring of all Nimbra MSR circuits
- Automated routing and scheduling of network paths
- Simplified ad hoc service creation with intuitive XY routing panels
Why it matters?
For teams leveraging Nimbra products, the DataMiner Nimbra Vision solution enhances how networks are managed and monitored. Rather than replacing existing Nimbra tools, it amplifies their capabilities, bridging the gap between device-specific control and seamless cross-platform orchestration. Together, DataMiner and Nimbra Vision empower operators with a smarter, more agile approach to managing complex media and transport networks.
Whether you are running live events, overseeing broadcast infrastructure, or delivering mission-critical media services, this integration ensures your network is not only connected, but intelligently orchestrated from end to end.
Explore the use case details below to preview the app, and deploy the solution in just one click from the DataMiner Catalog.
USE CASE DETAILS
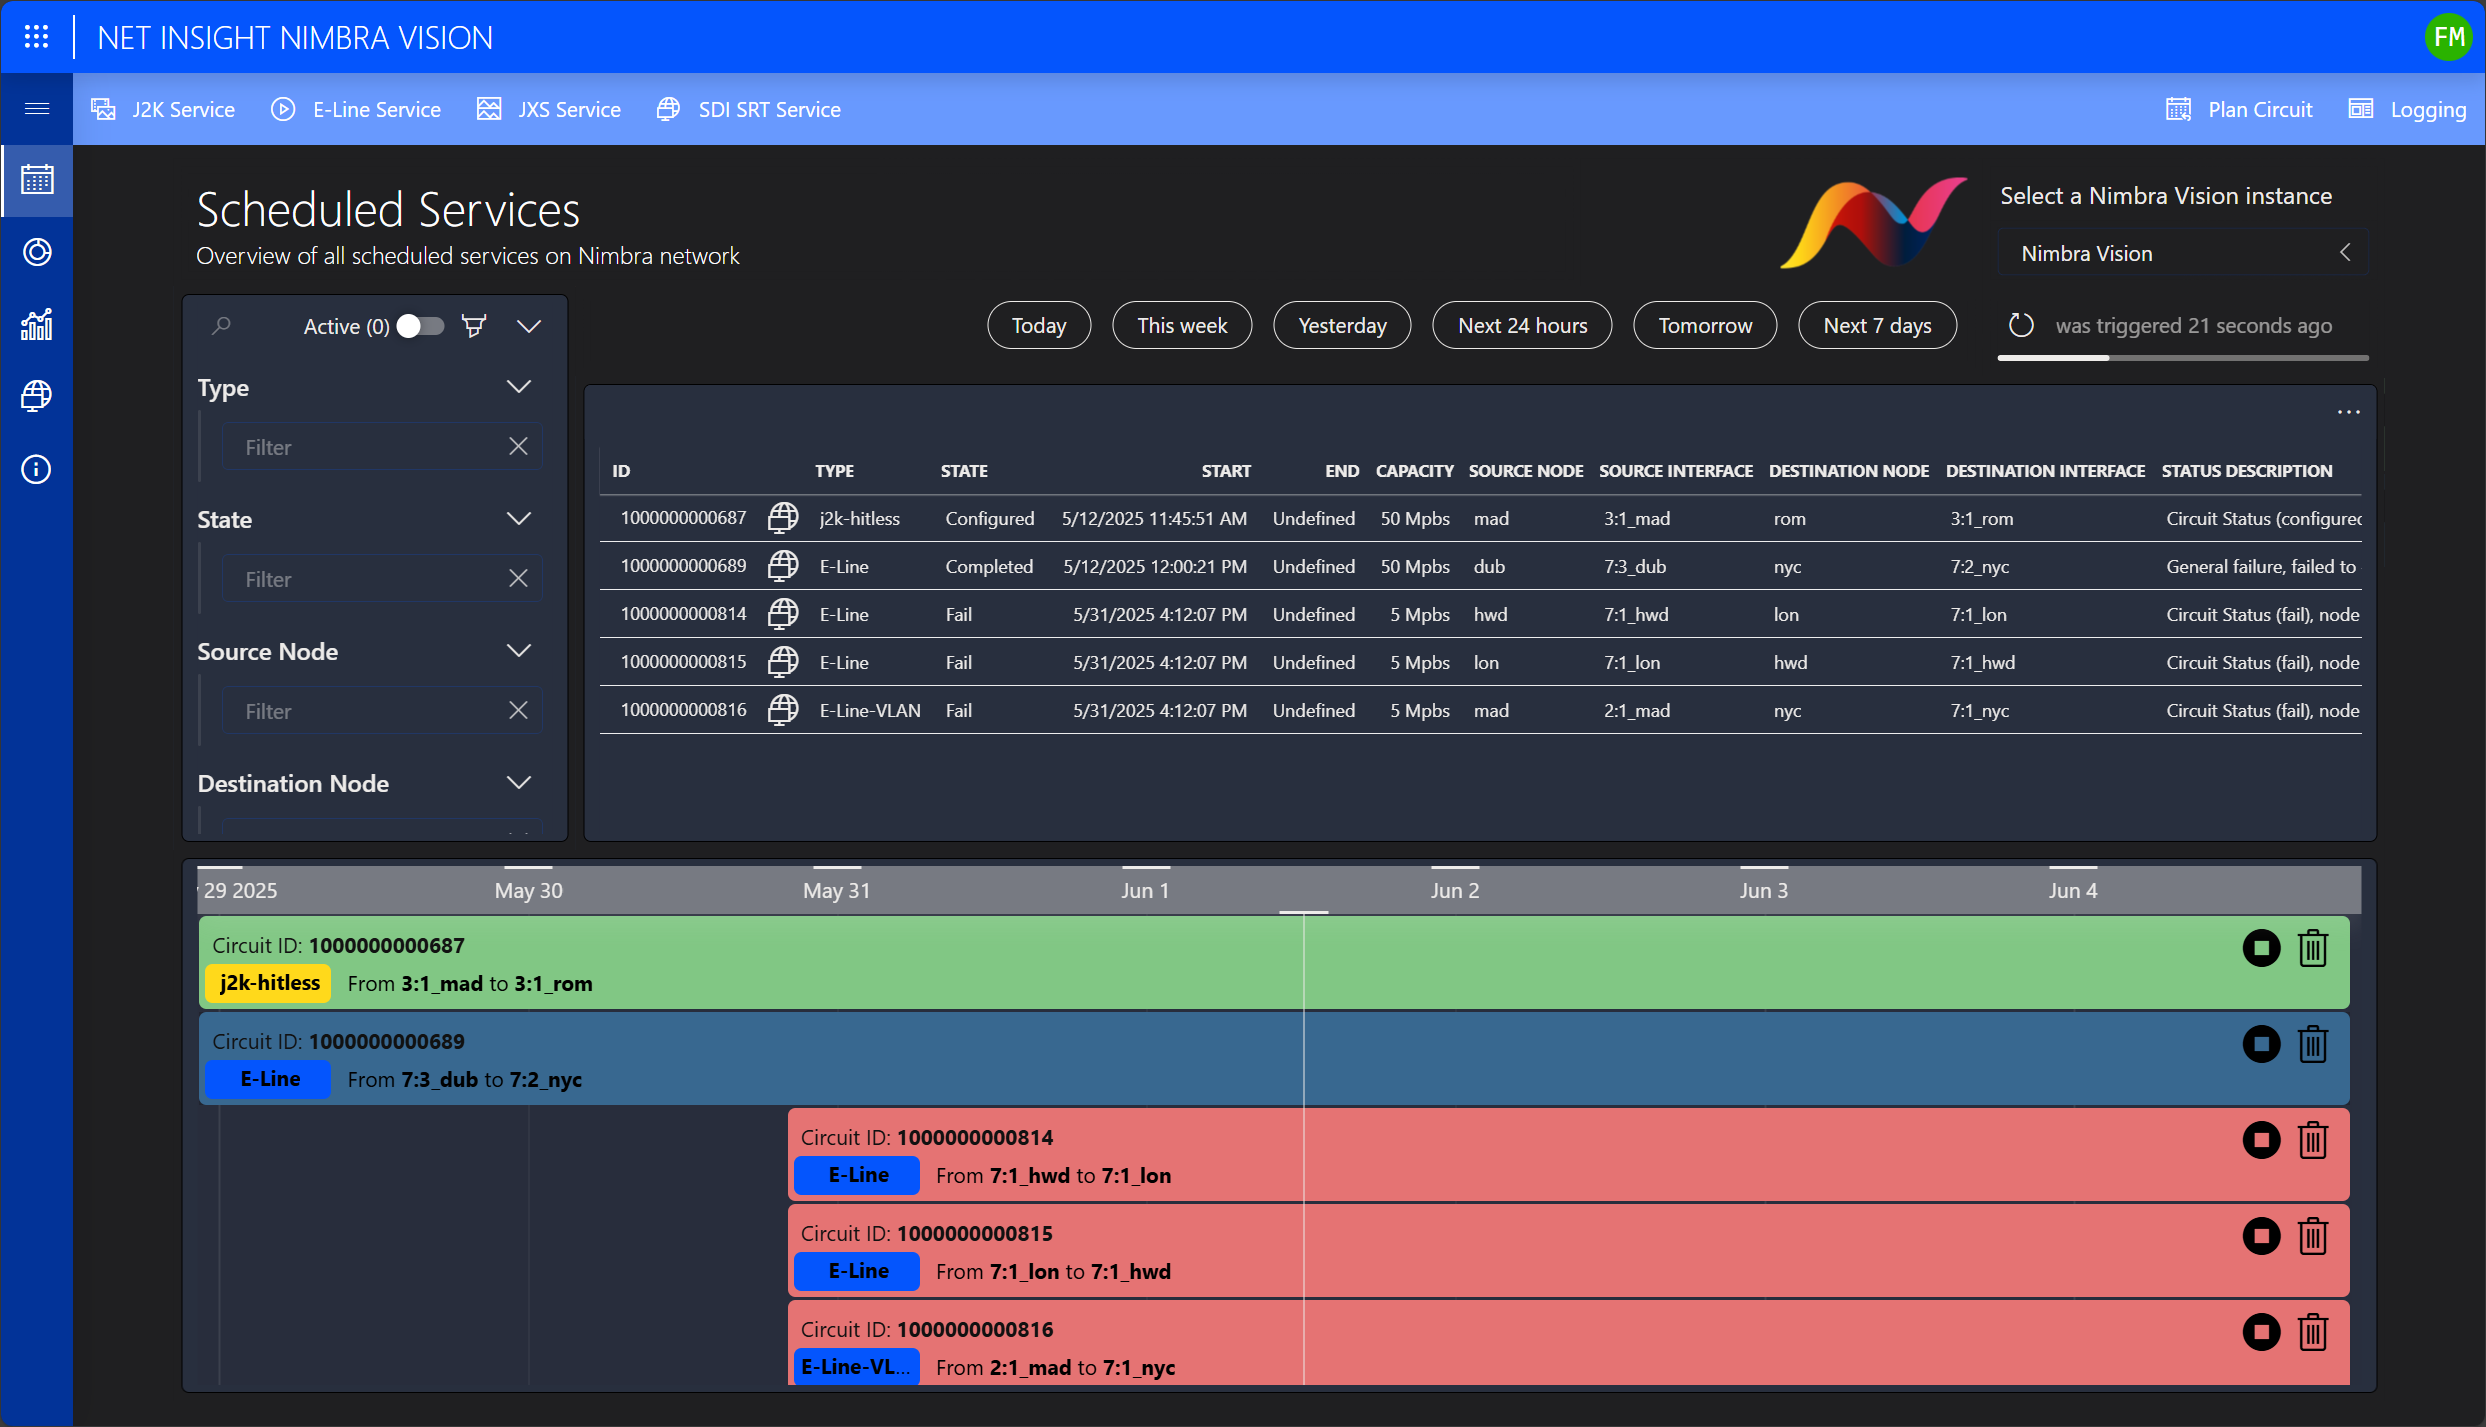 Gain complete visibility into all active and future Nimbra MSR circuits with intuitive filtering options, whether by service type (e.g. J2K, J2K Hitless, E-Line), or by source and destination nodes. Setting up a new ad hoc circuit is remarkably simple: select the service type, use the DataMiner XY routing panel to choose your source and destination nodes, and assign the appropriate interfaces to configure a service with a predefined bitrate.
However, real-time setup can run into limitations, such as insufficient bandwidth or unavailable resources. With DataMiner, you can also schedule your events in advance, ensuring that all required connections are established at the right time and in the correct format.
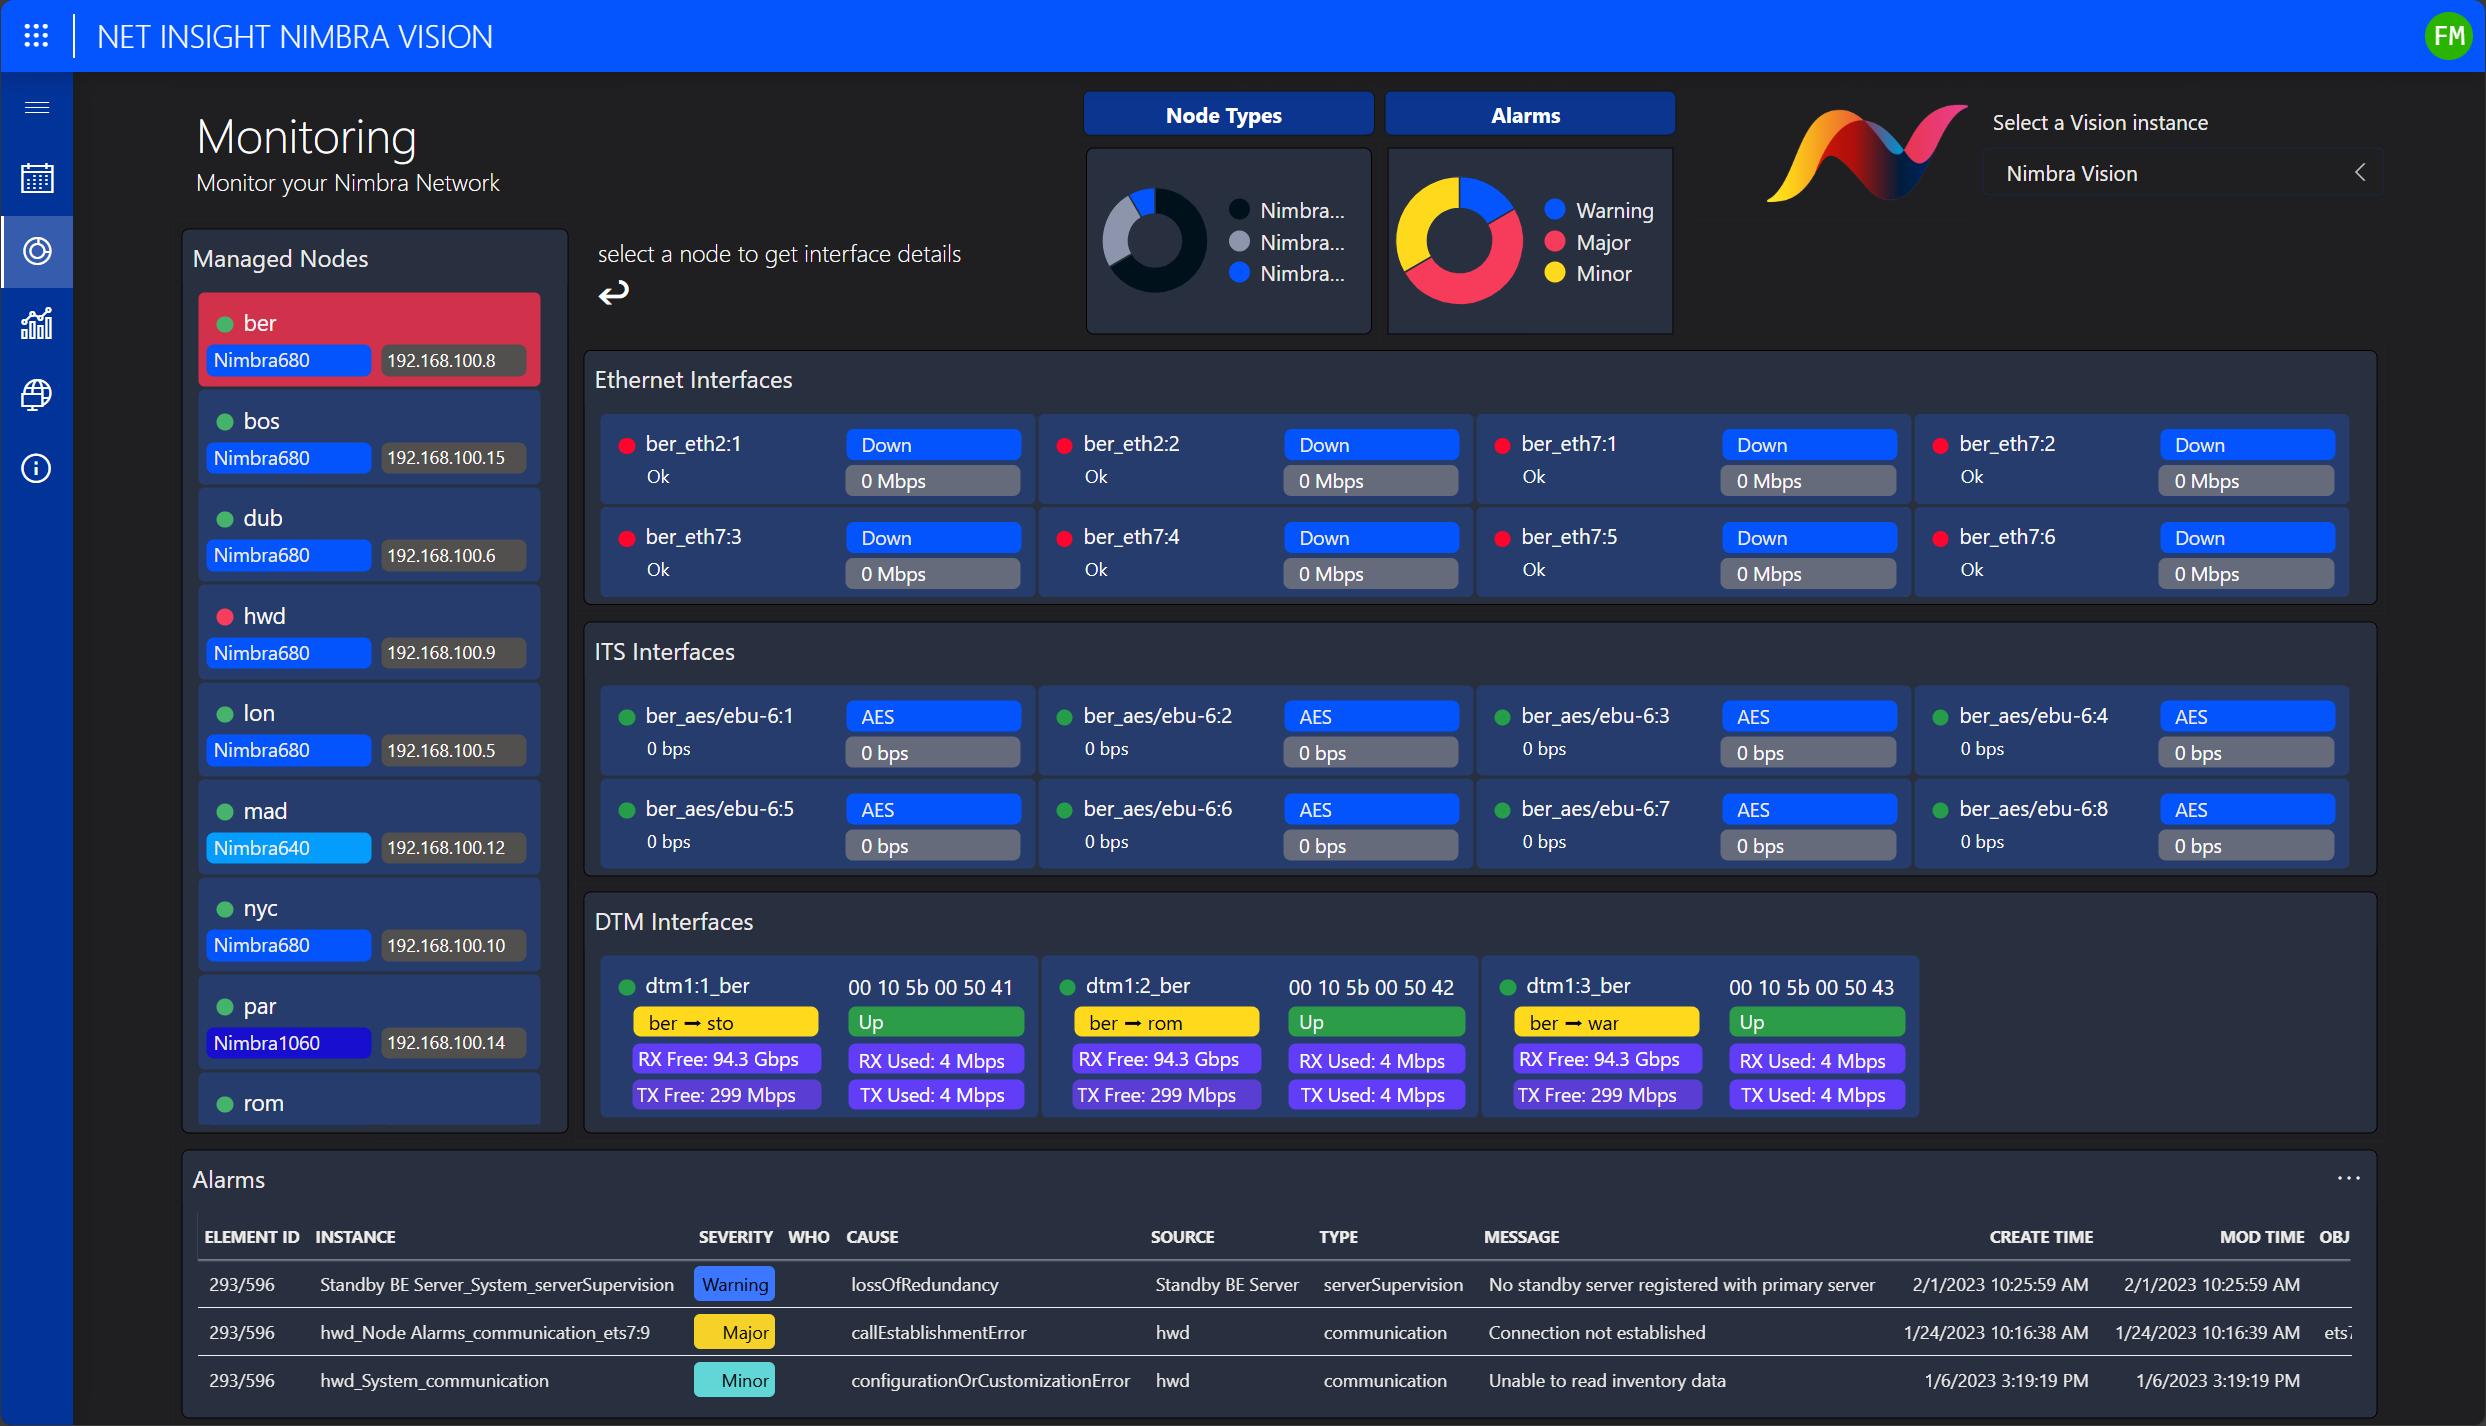 You also get an overview of all Nimbra nodes orchestrated by Nimbra Vision, which allows you to easily monitor both the overall node status and individual interfaces. Real-time insights into RX and TX capacity provide a detailed understanding of the resource usage.
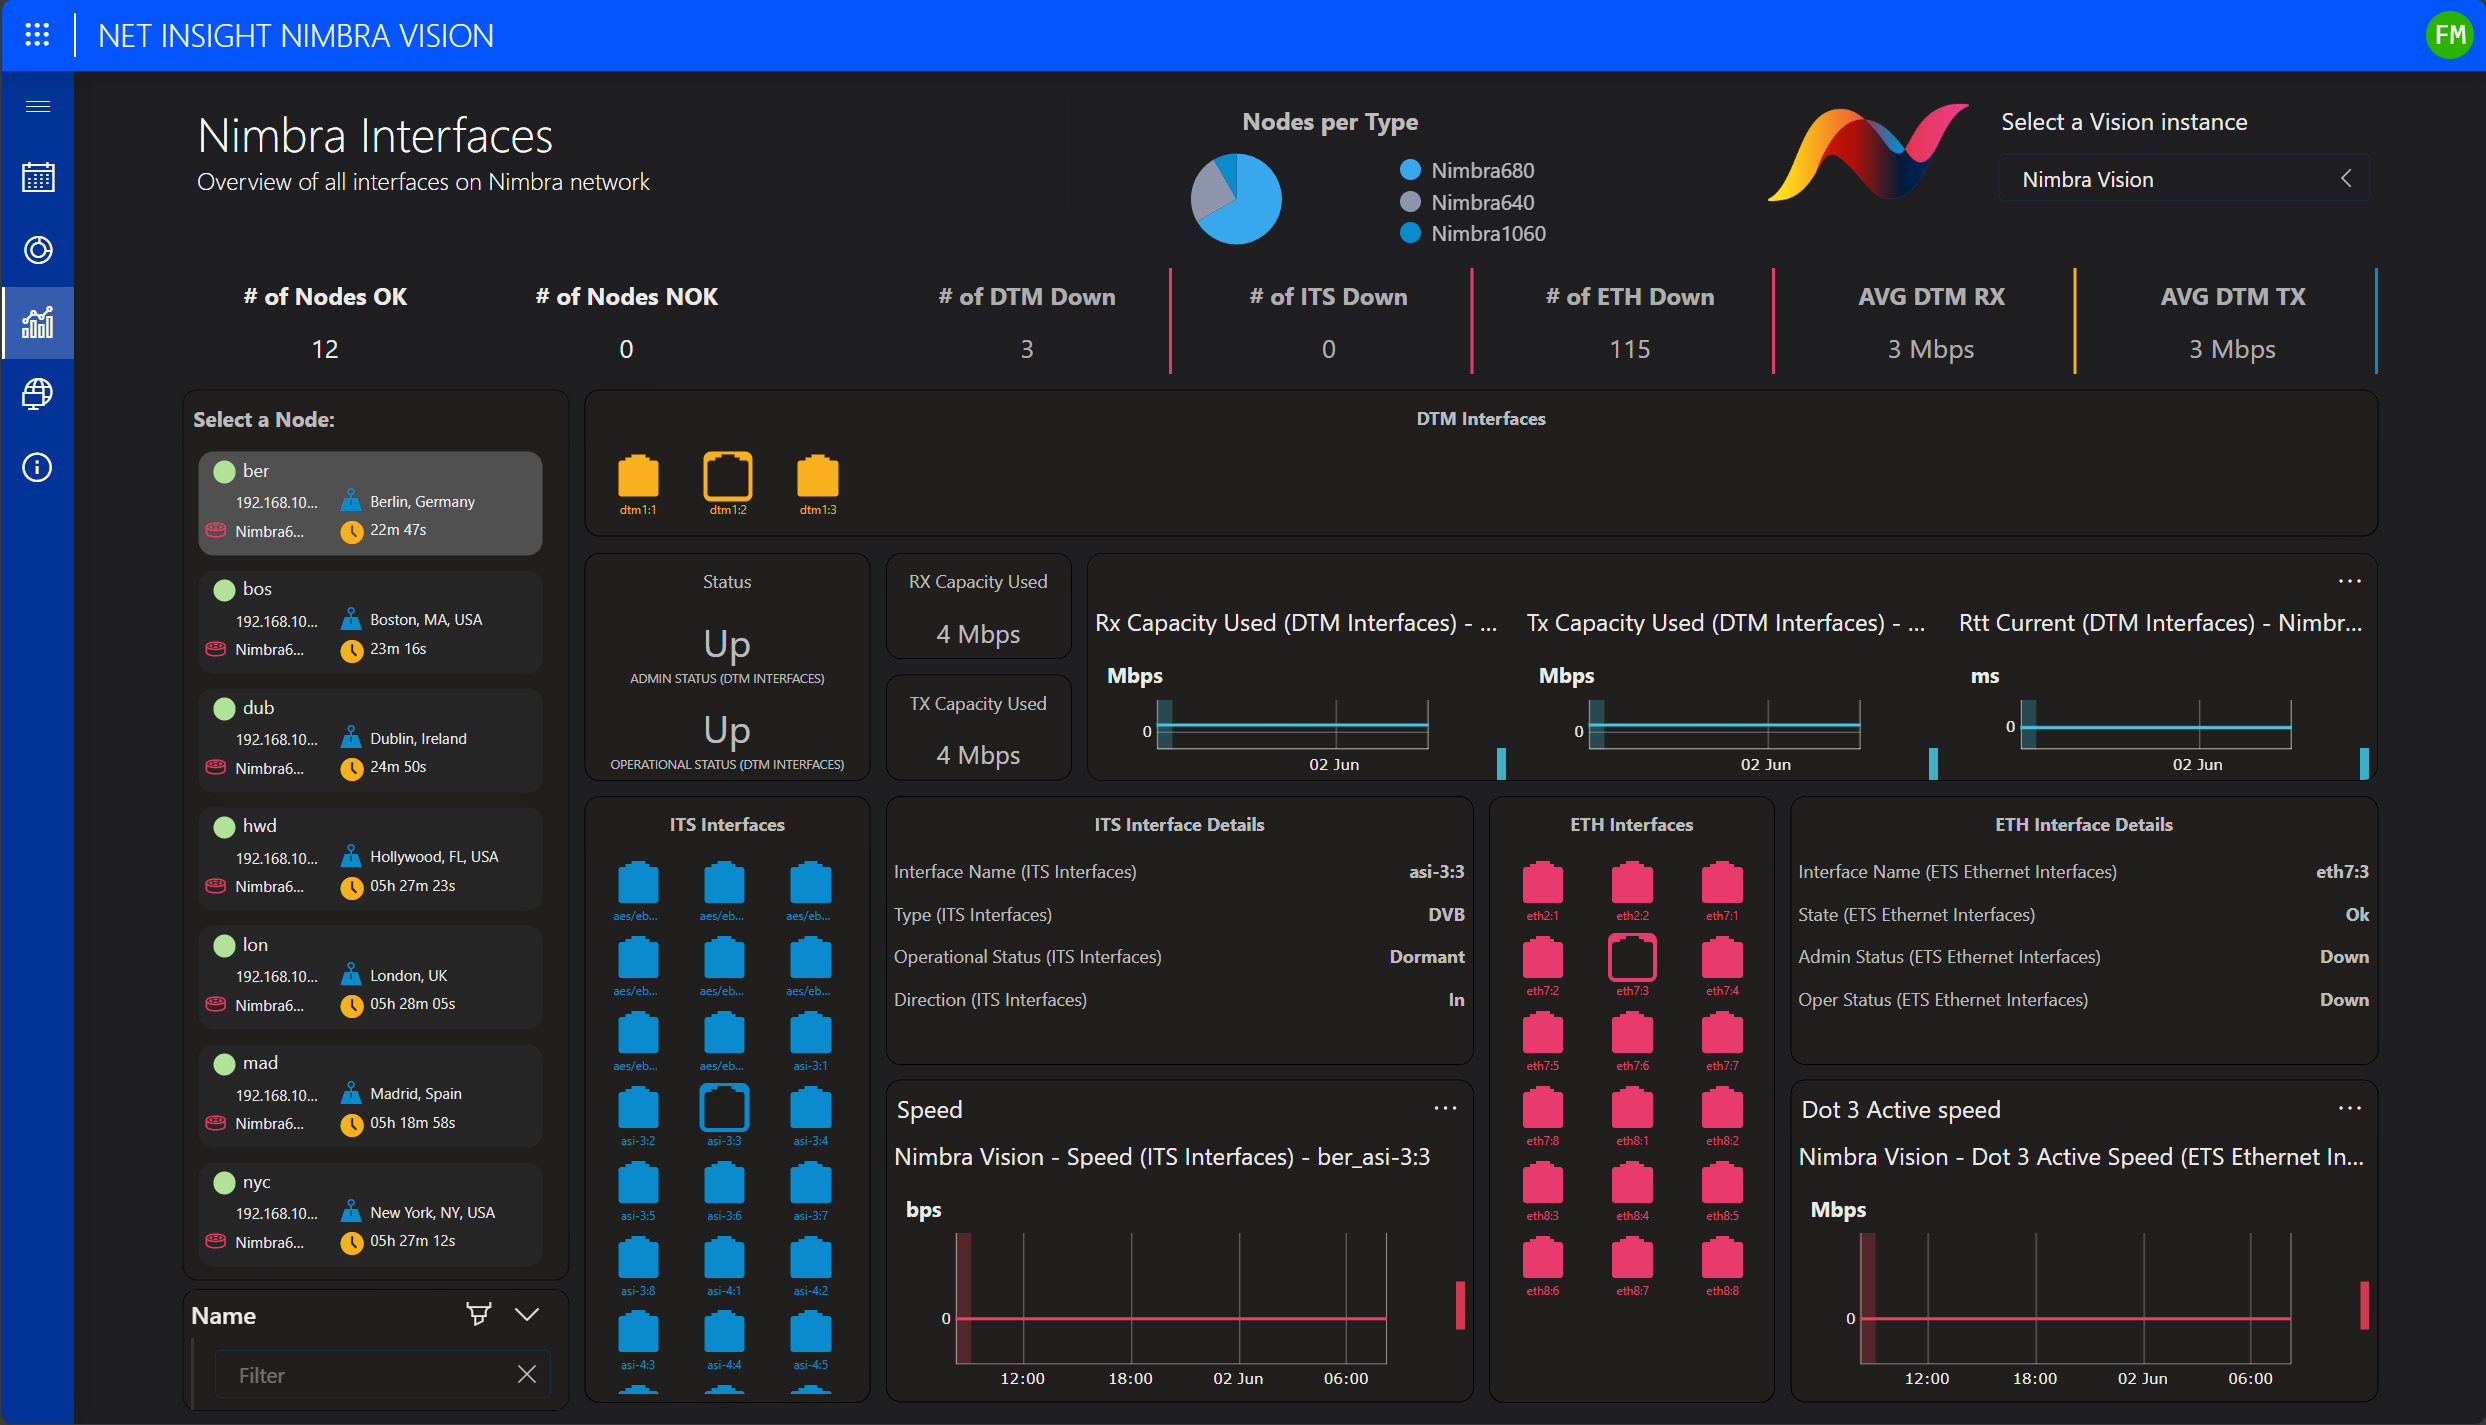 You can effortlessly monitor each node’s individual interfaces, gaining real-time visibility on RX and TX activity and capacity. This granular insight delivers a clear understanding of network and resource usage, enabling faster diagnostics and smarter decision-making.
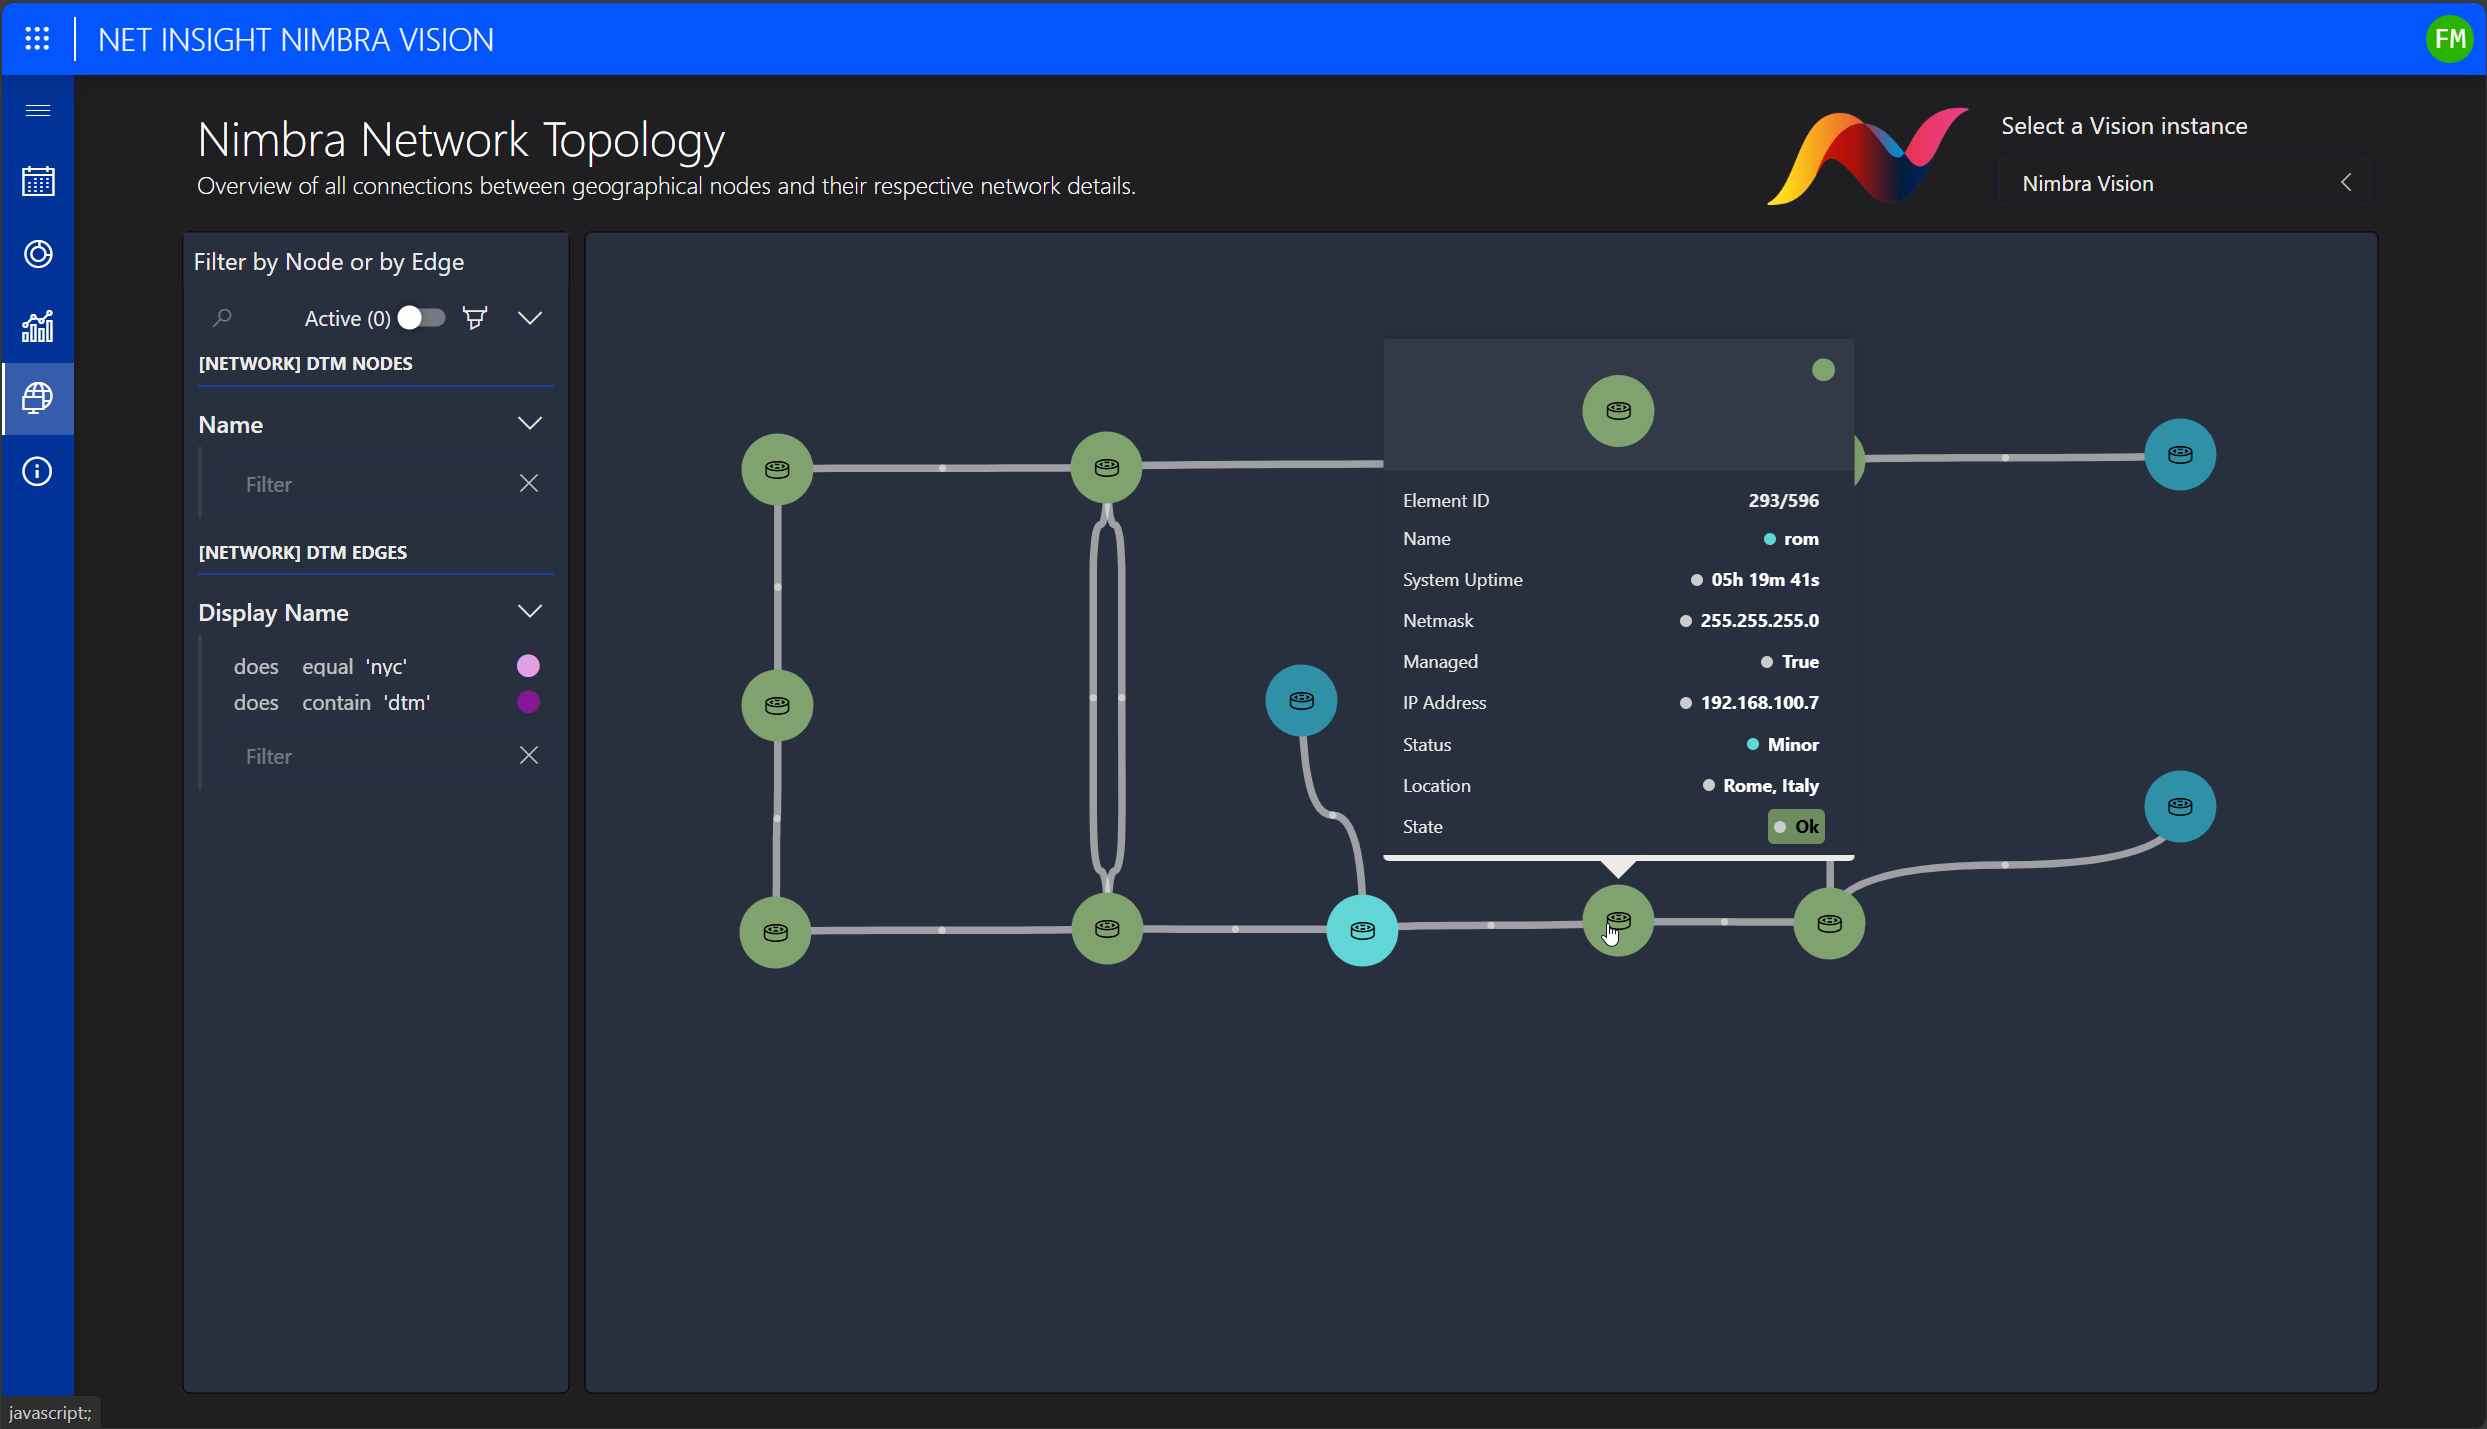 DataMiner integrates with Nimbra Vision’s RESTful API, allowing it to retrieve and visualize the full network topology. You can customize the interface by color-coding nodes and trunks for clarity, and simply hover over any element to access real-time metrics, such as link status, capacity utilization, and overall health indicators for each node and trunk. This intuitive visualization empowers teams with instant insights into network performance and reliability.