example Use Case
Quality of Experience Monitoring – QoE / EPM
PON
OTT
DVB-C
FTTH
RabbitMQ
docsis
IPTV
5G
FWA
ABR
EPG
SI
Bridge Technologies
Agama
ADB
Splunk
AppearTV
Barrowa
Touchstream
AWS
This is an example of consolidated QoE reporting for a full suite of video services (live, catch up, start over, VOD) delivered using multiple delivery schemes (DVB-C, IPTV, OTT) and access technologies (coax, fiber and 5G) and consumed over set-top boxes, mobile devices, SmartTV or AppleTV.
USE CASE DETAILS
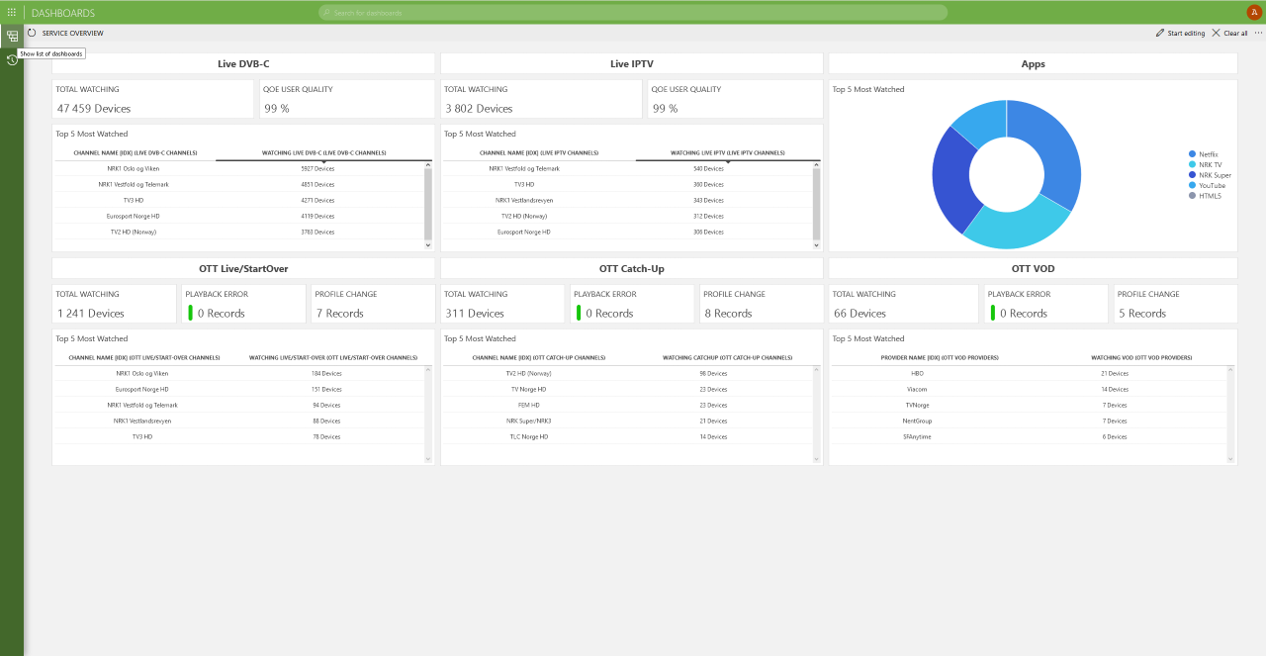
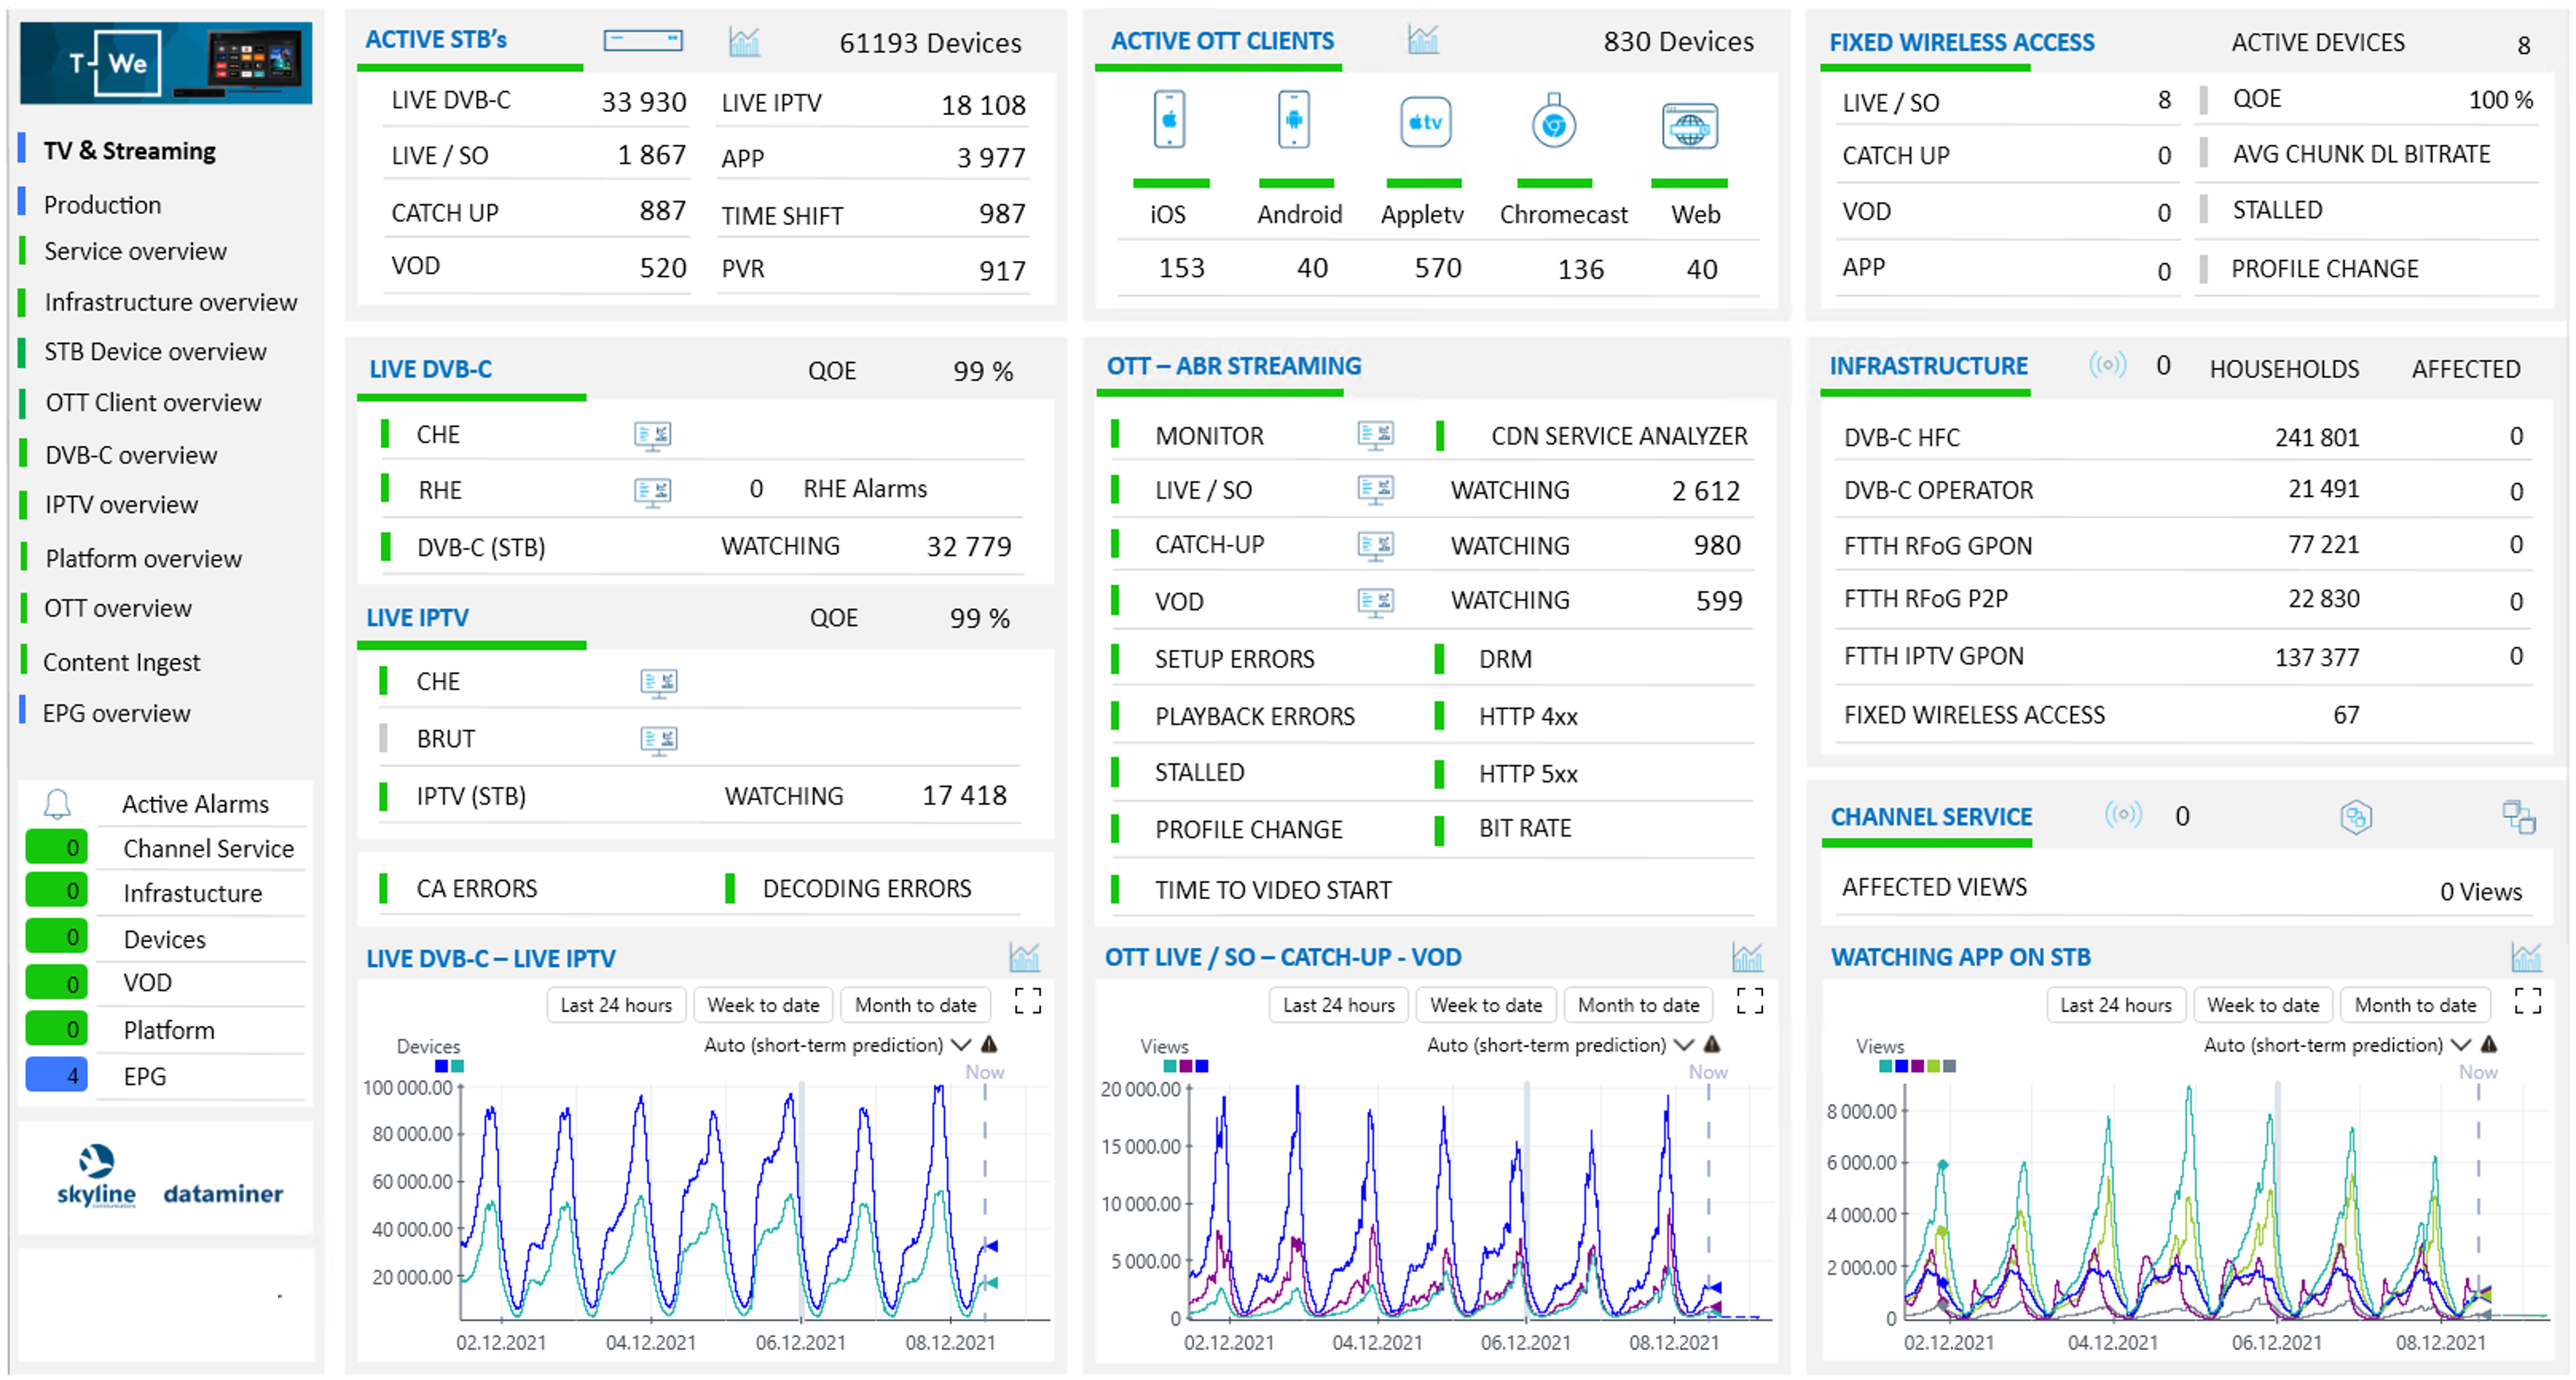 Consolidated visualization of session and QoE information for DVB-C, IPTV and OTT services.
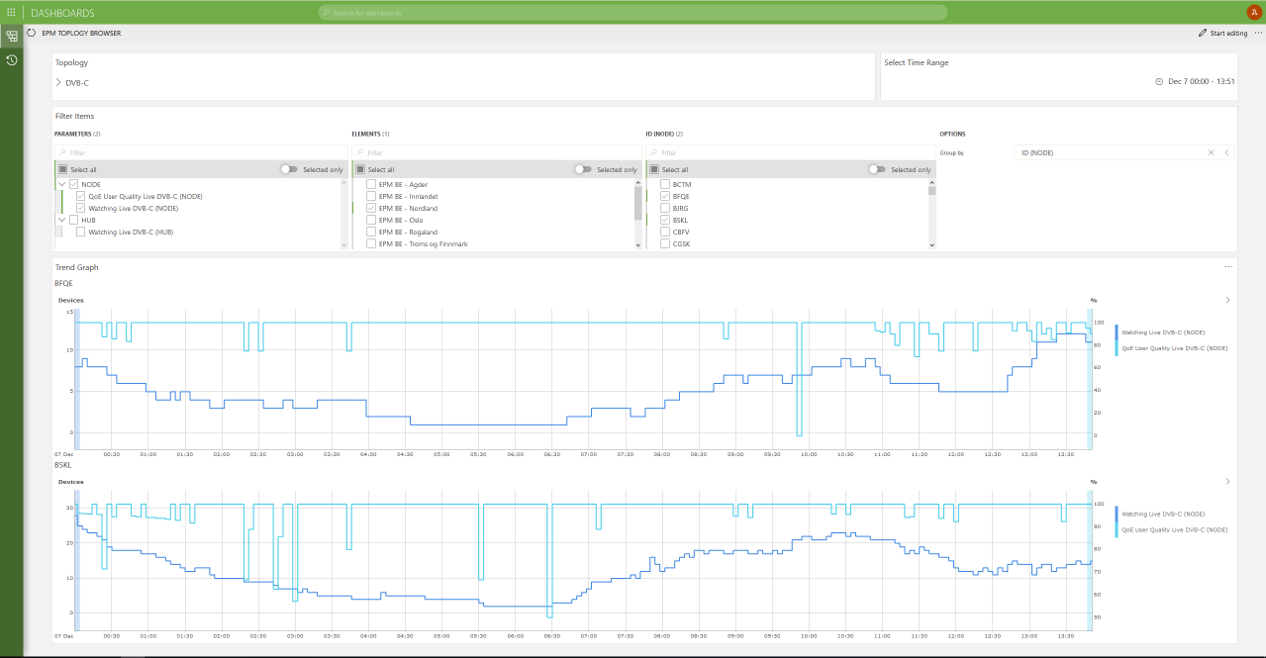
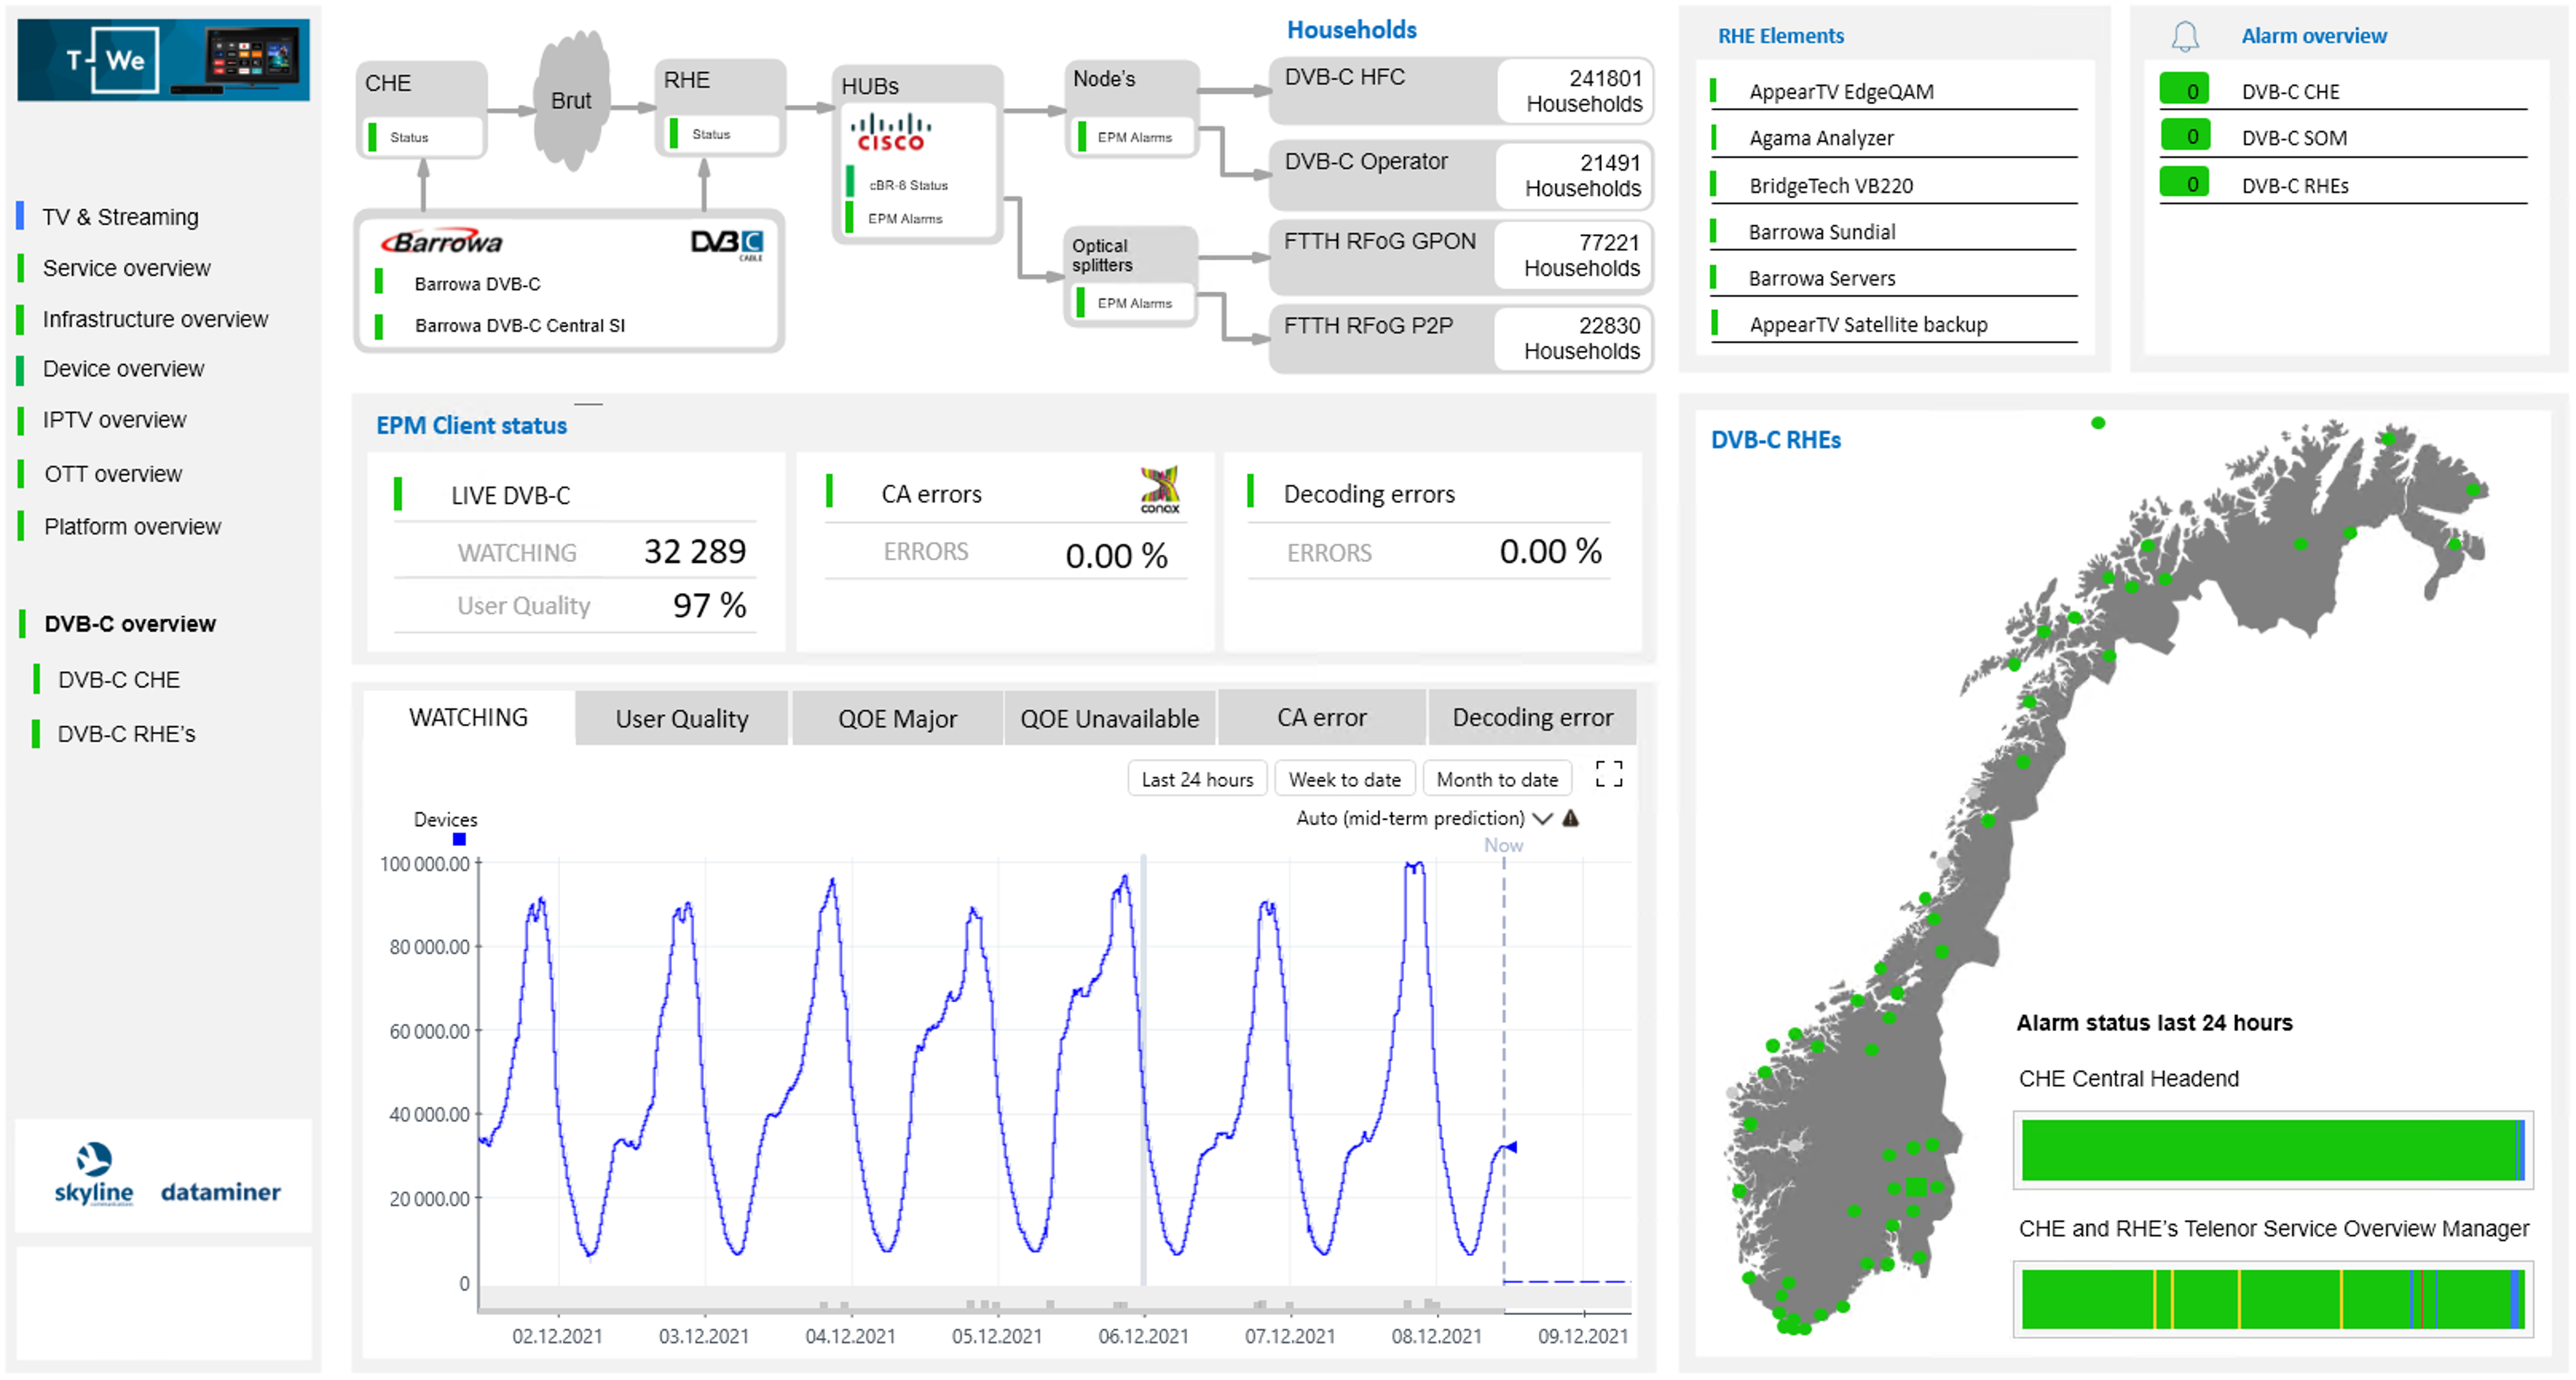 Visualization of session and QoE information for DVB-C service.
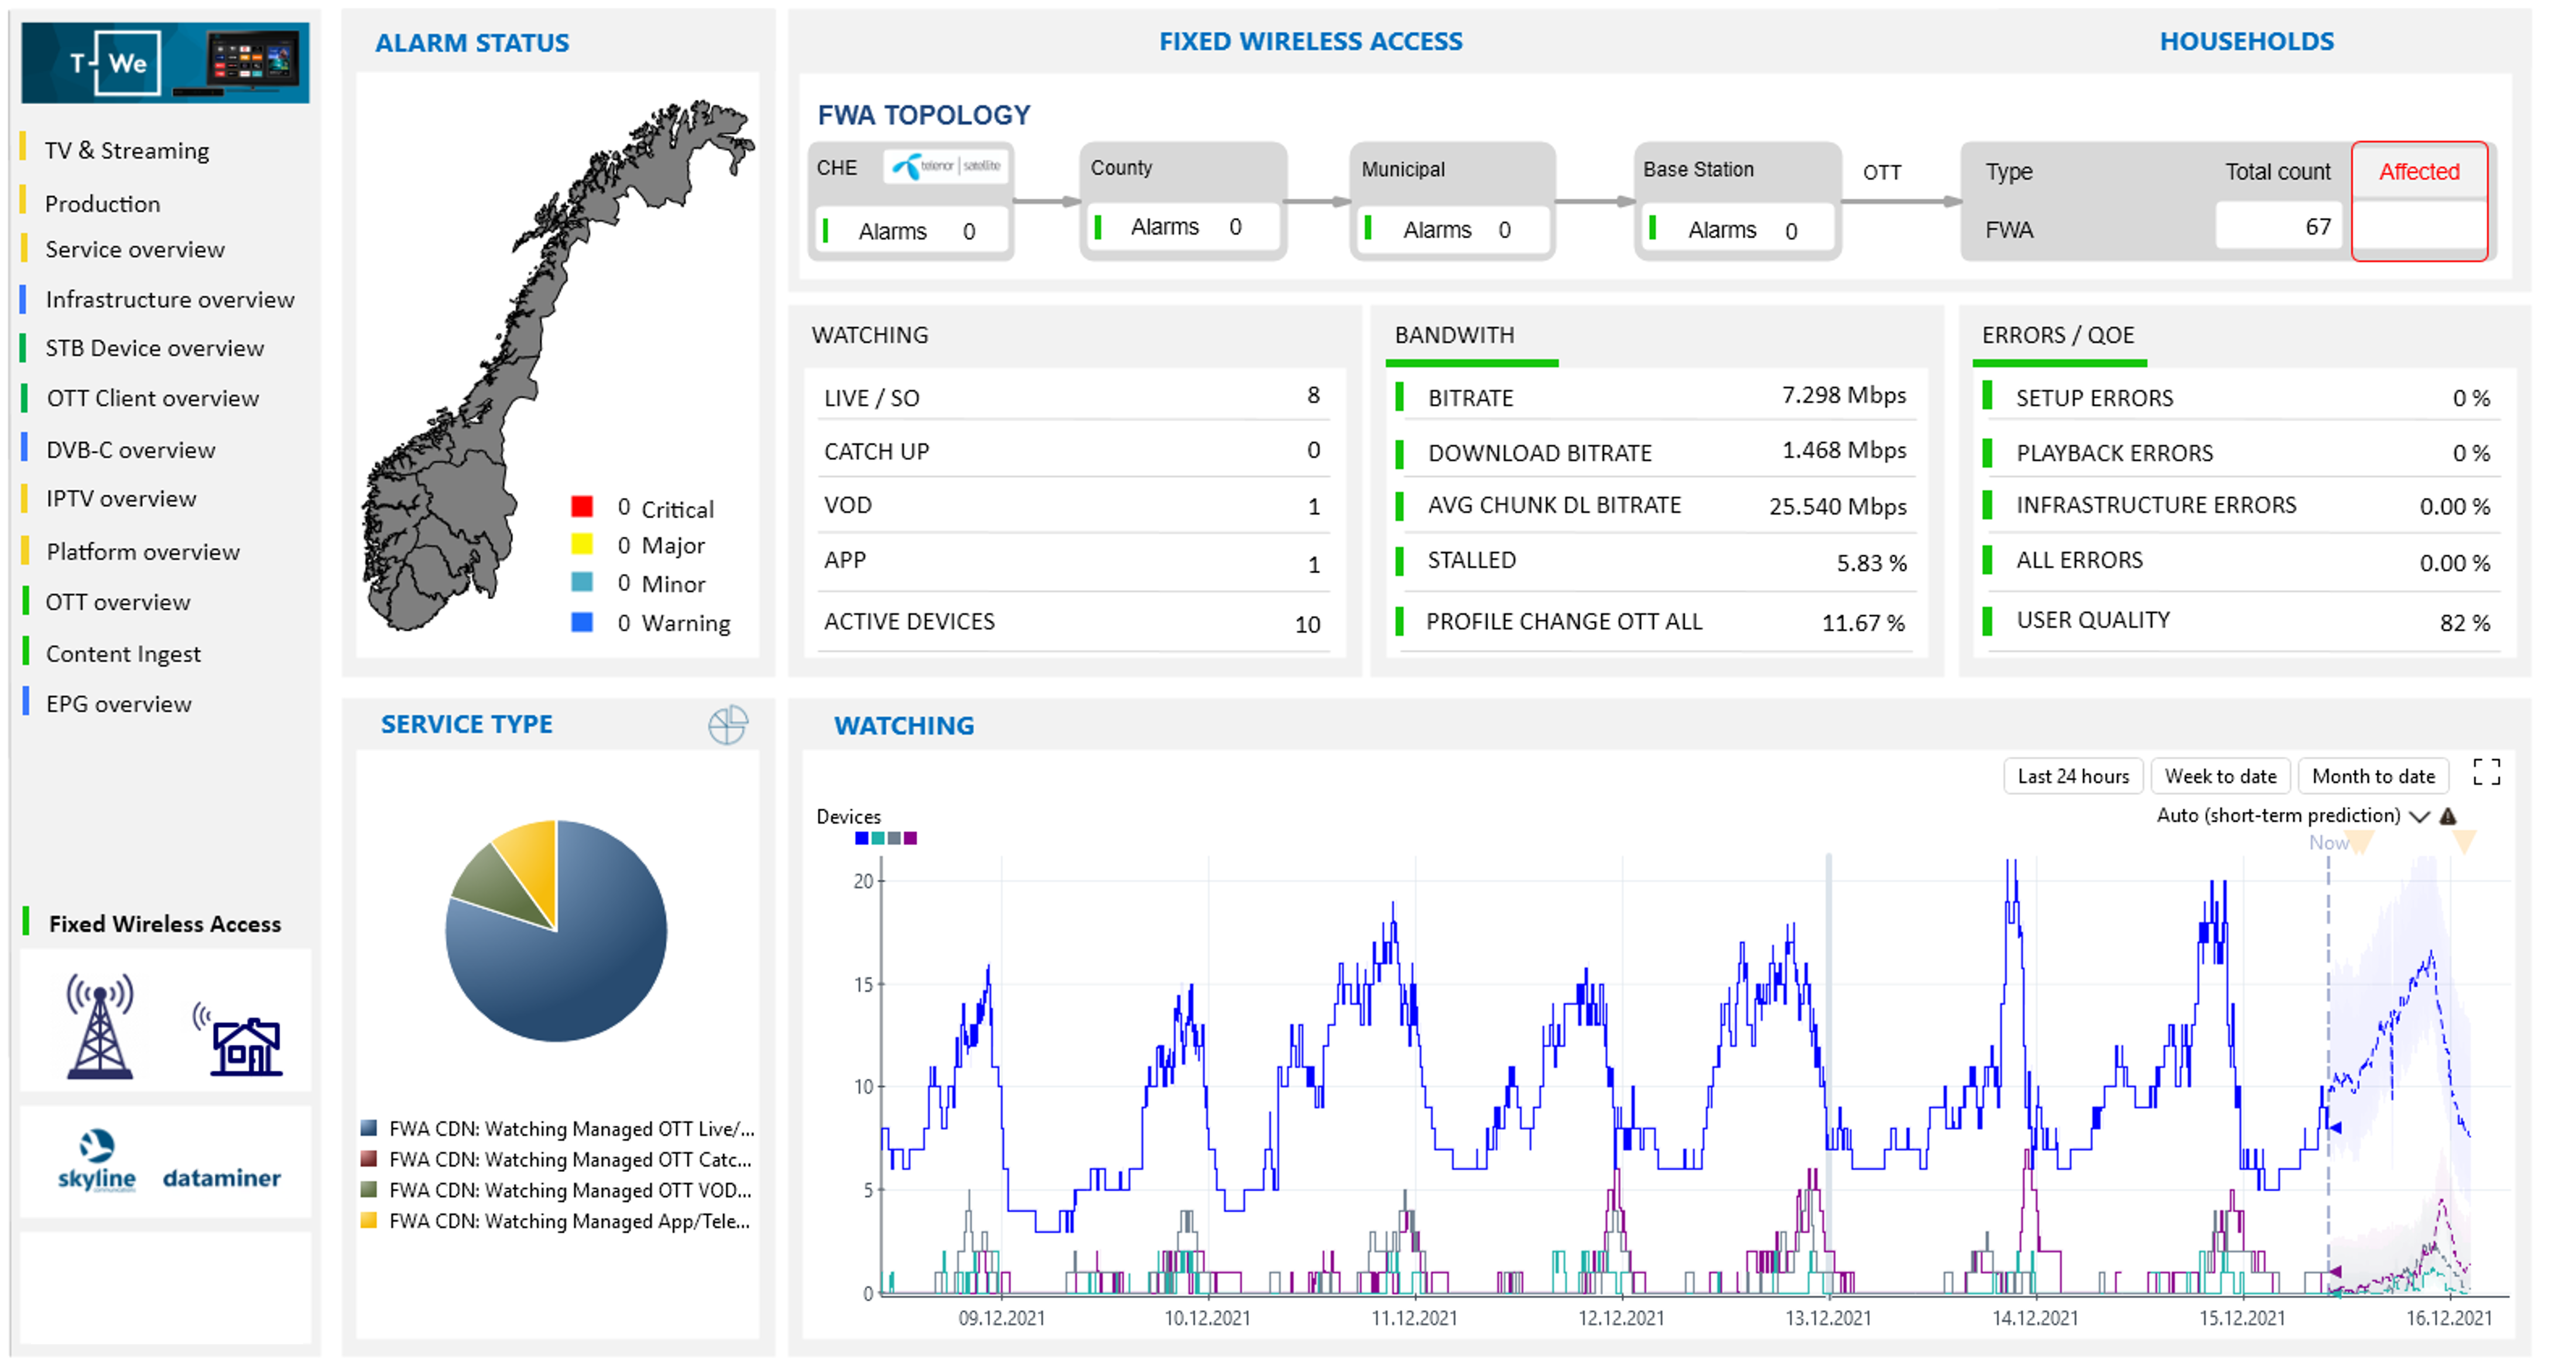 Visualization of session and QoE information for 5G FWA service
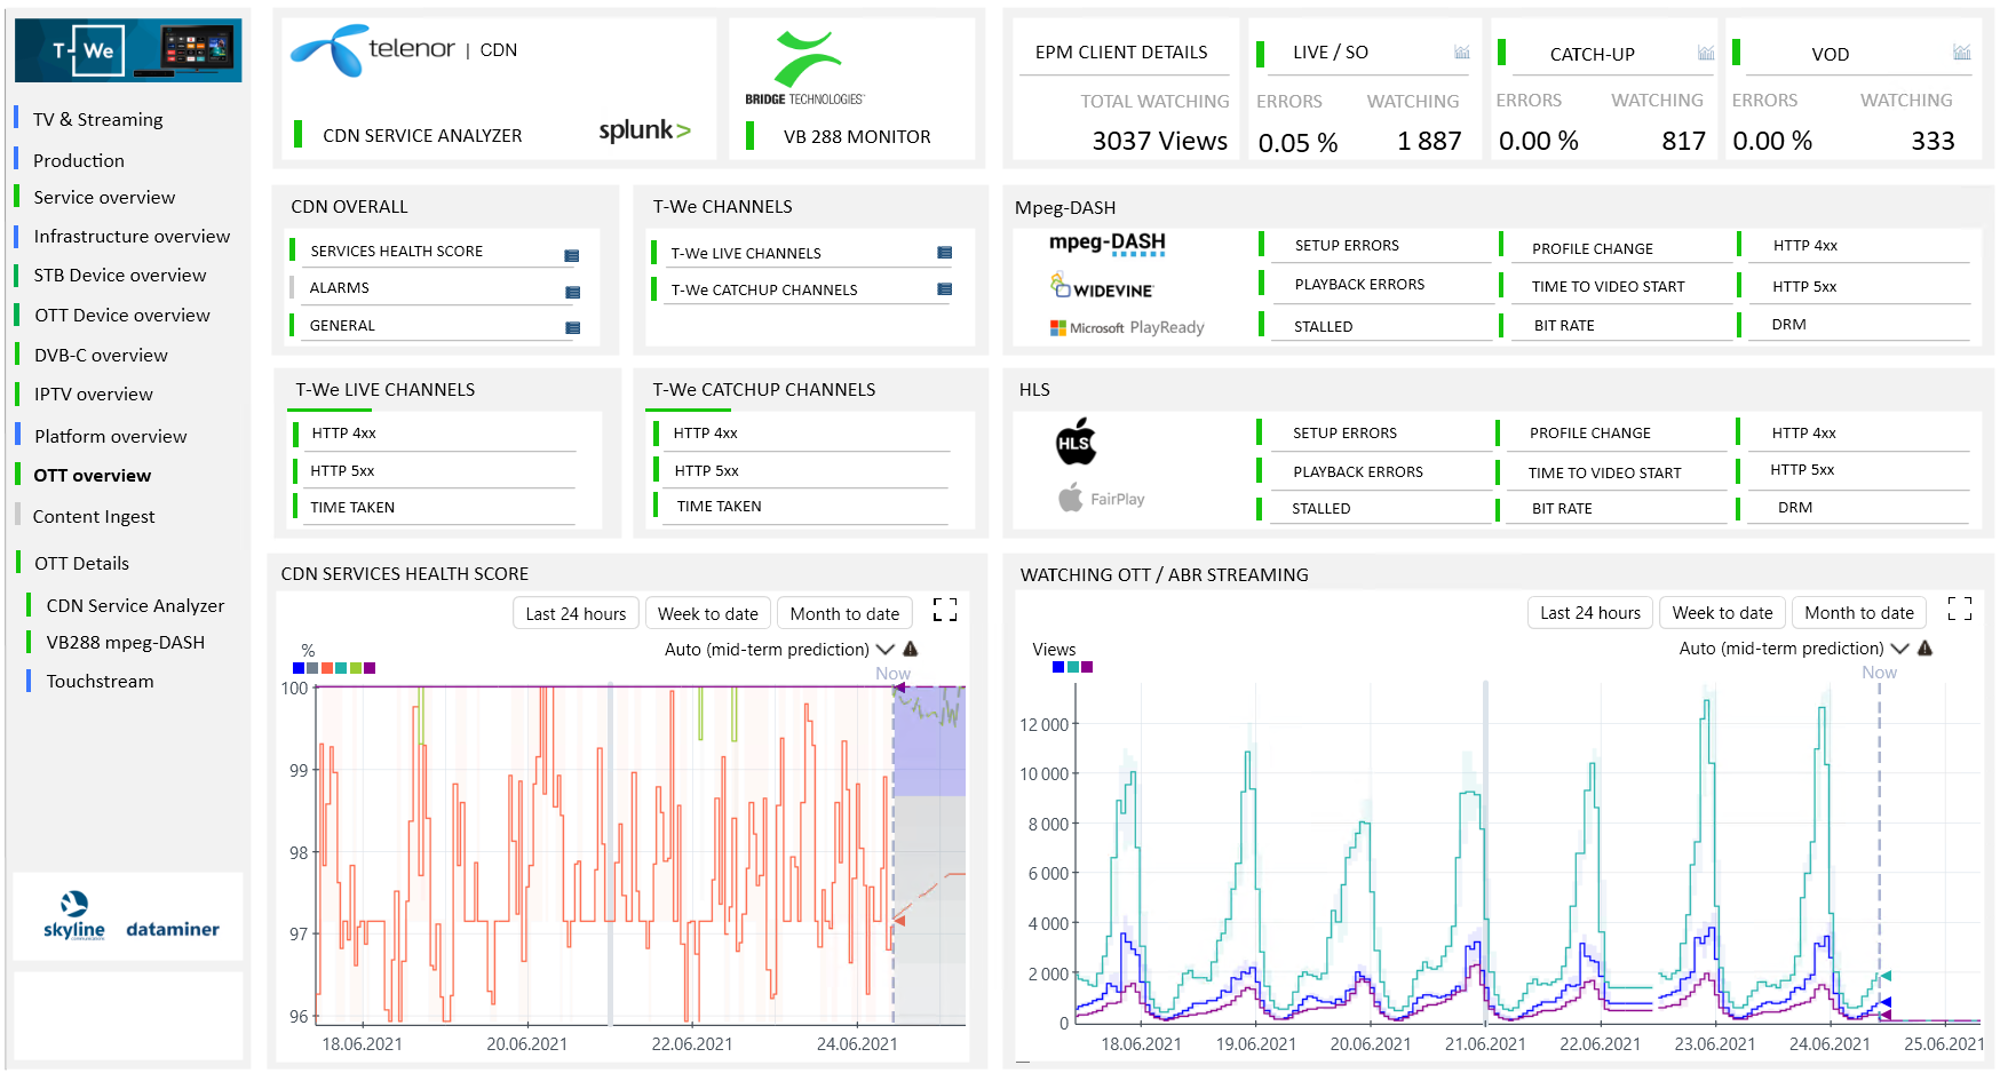 Visualization of session and QoE information for OTT service.
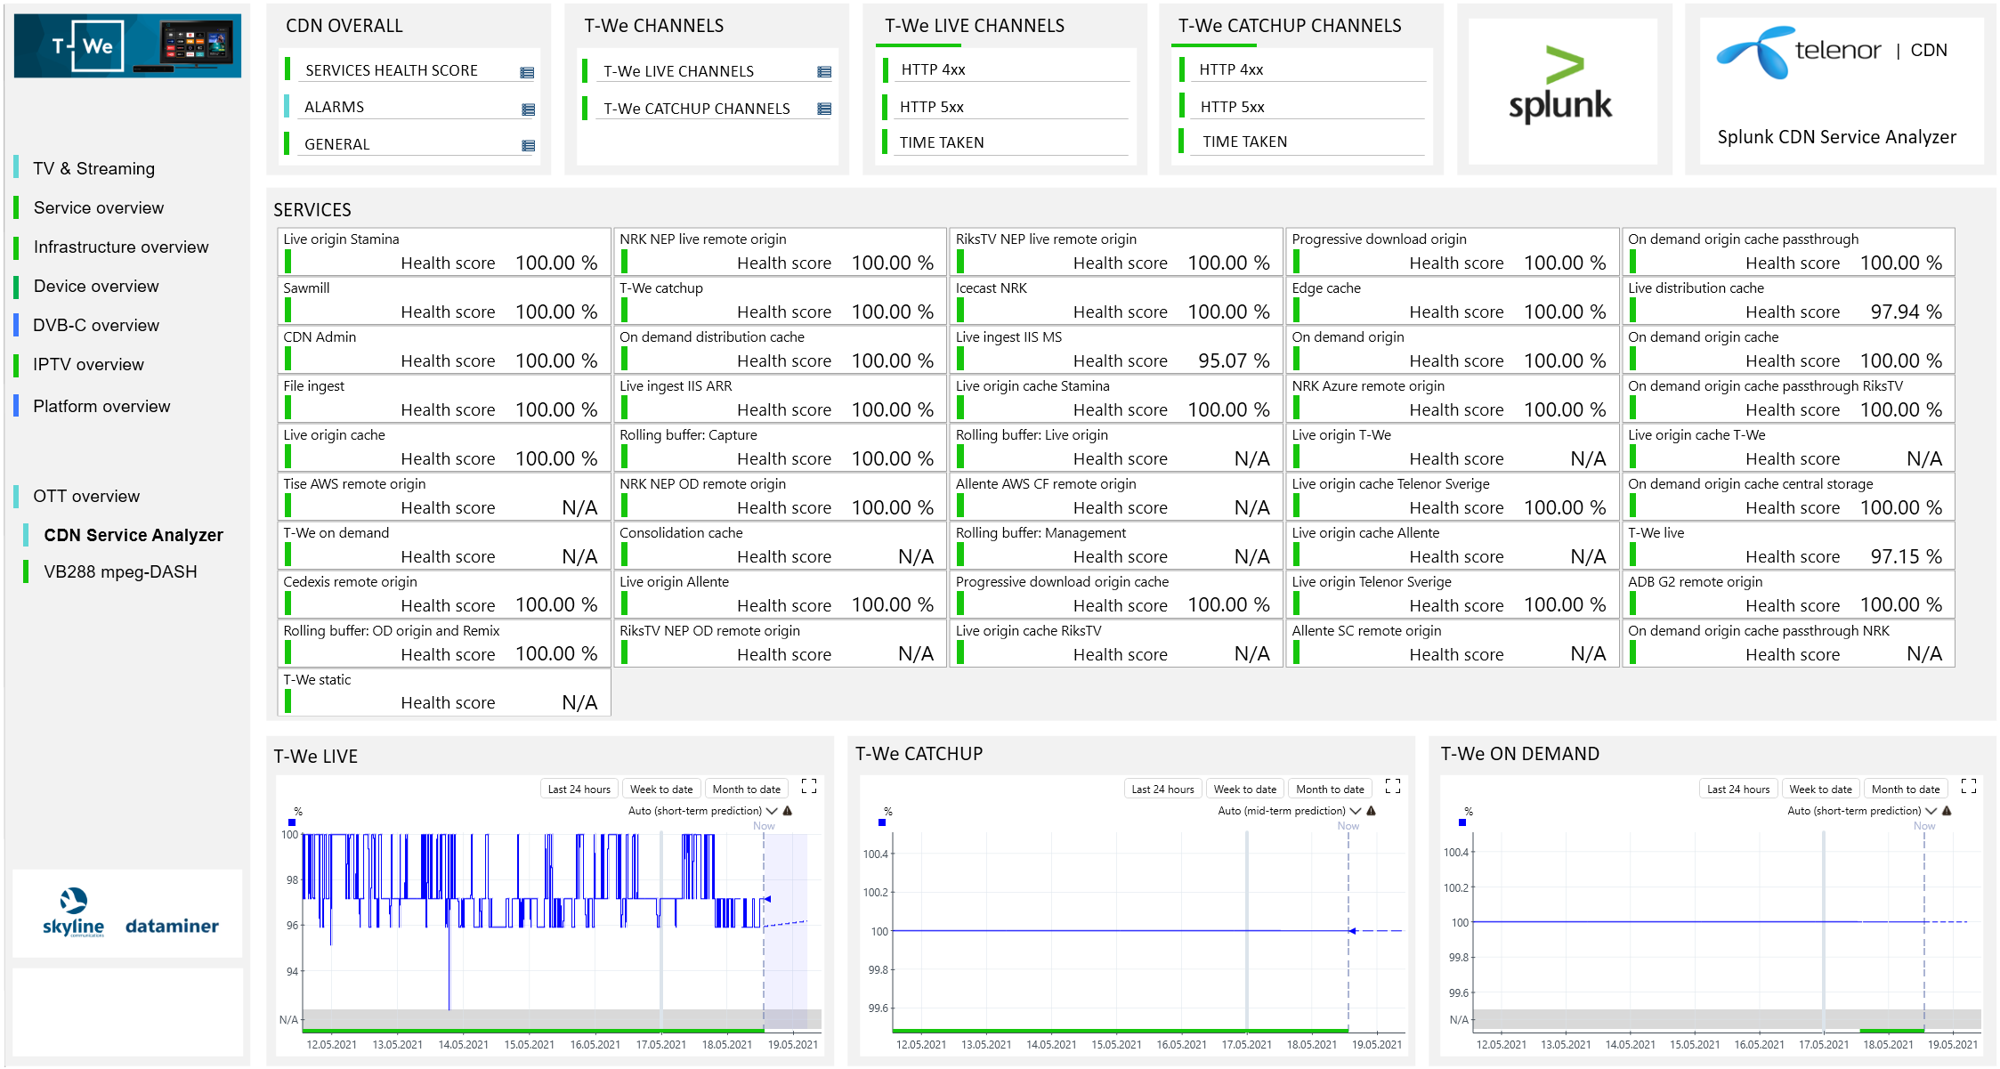 OTT CDN health status visualization.
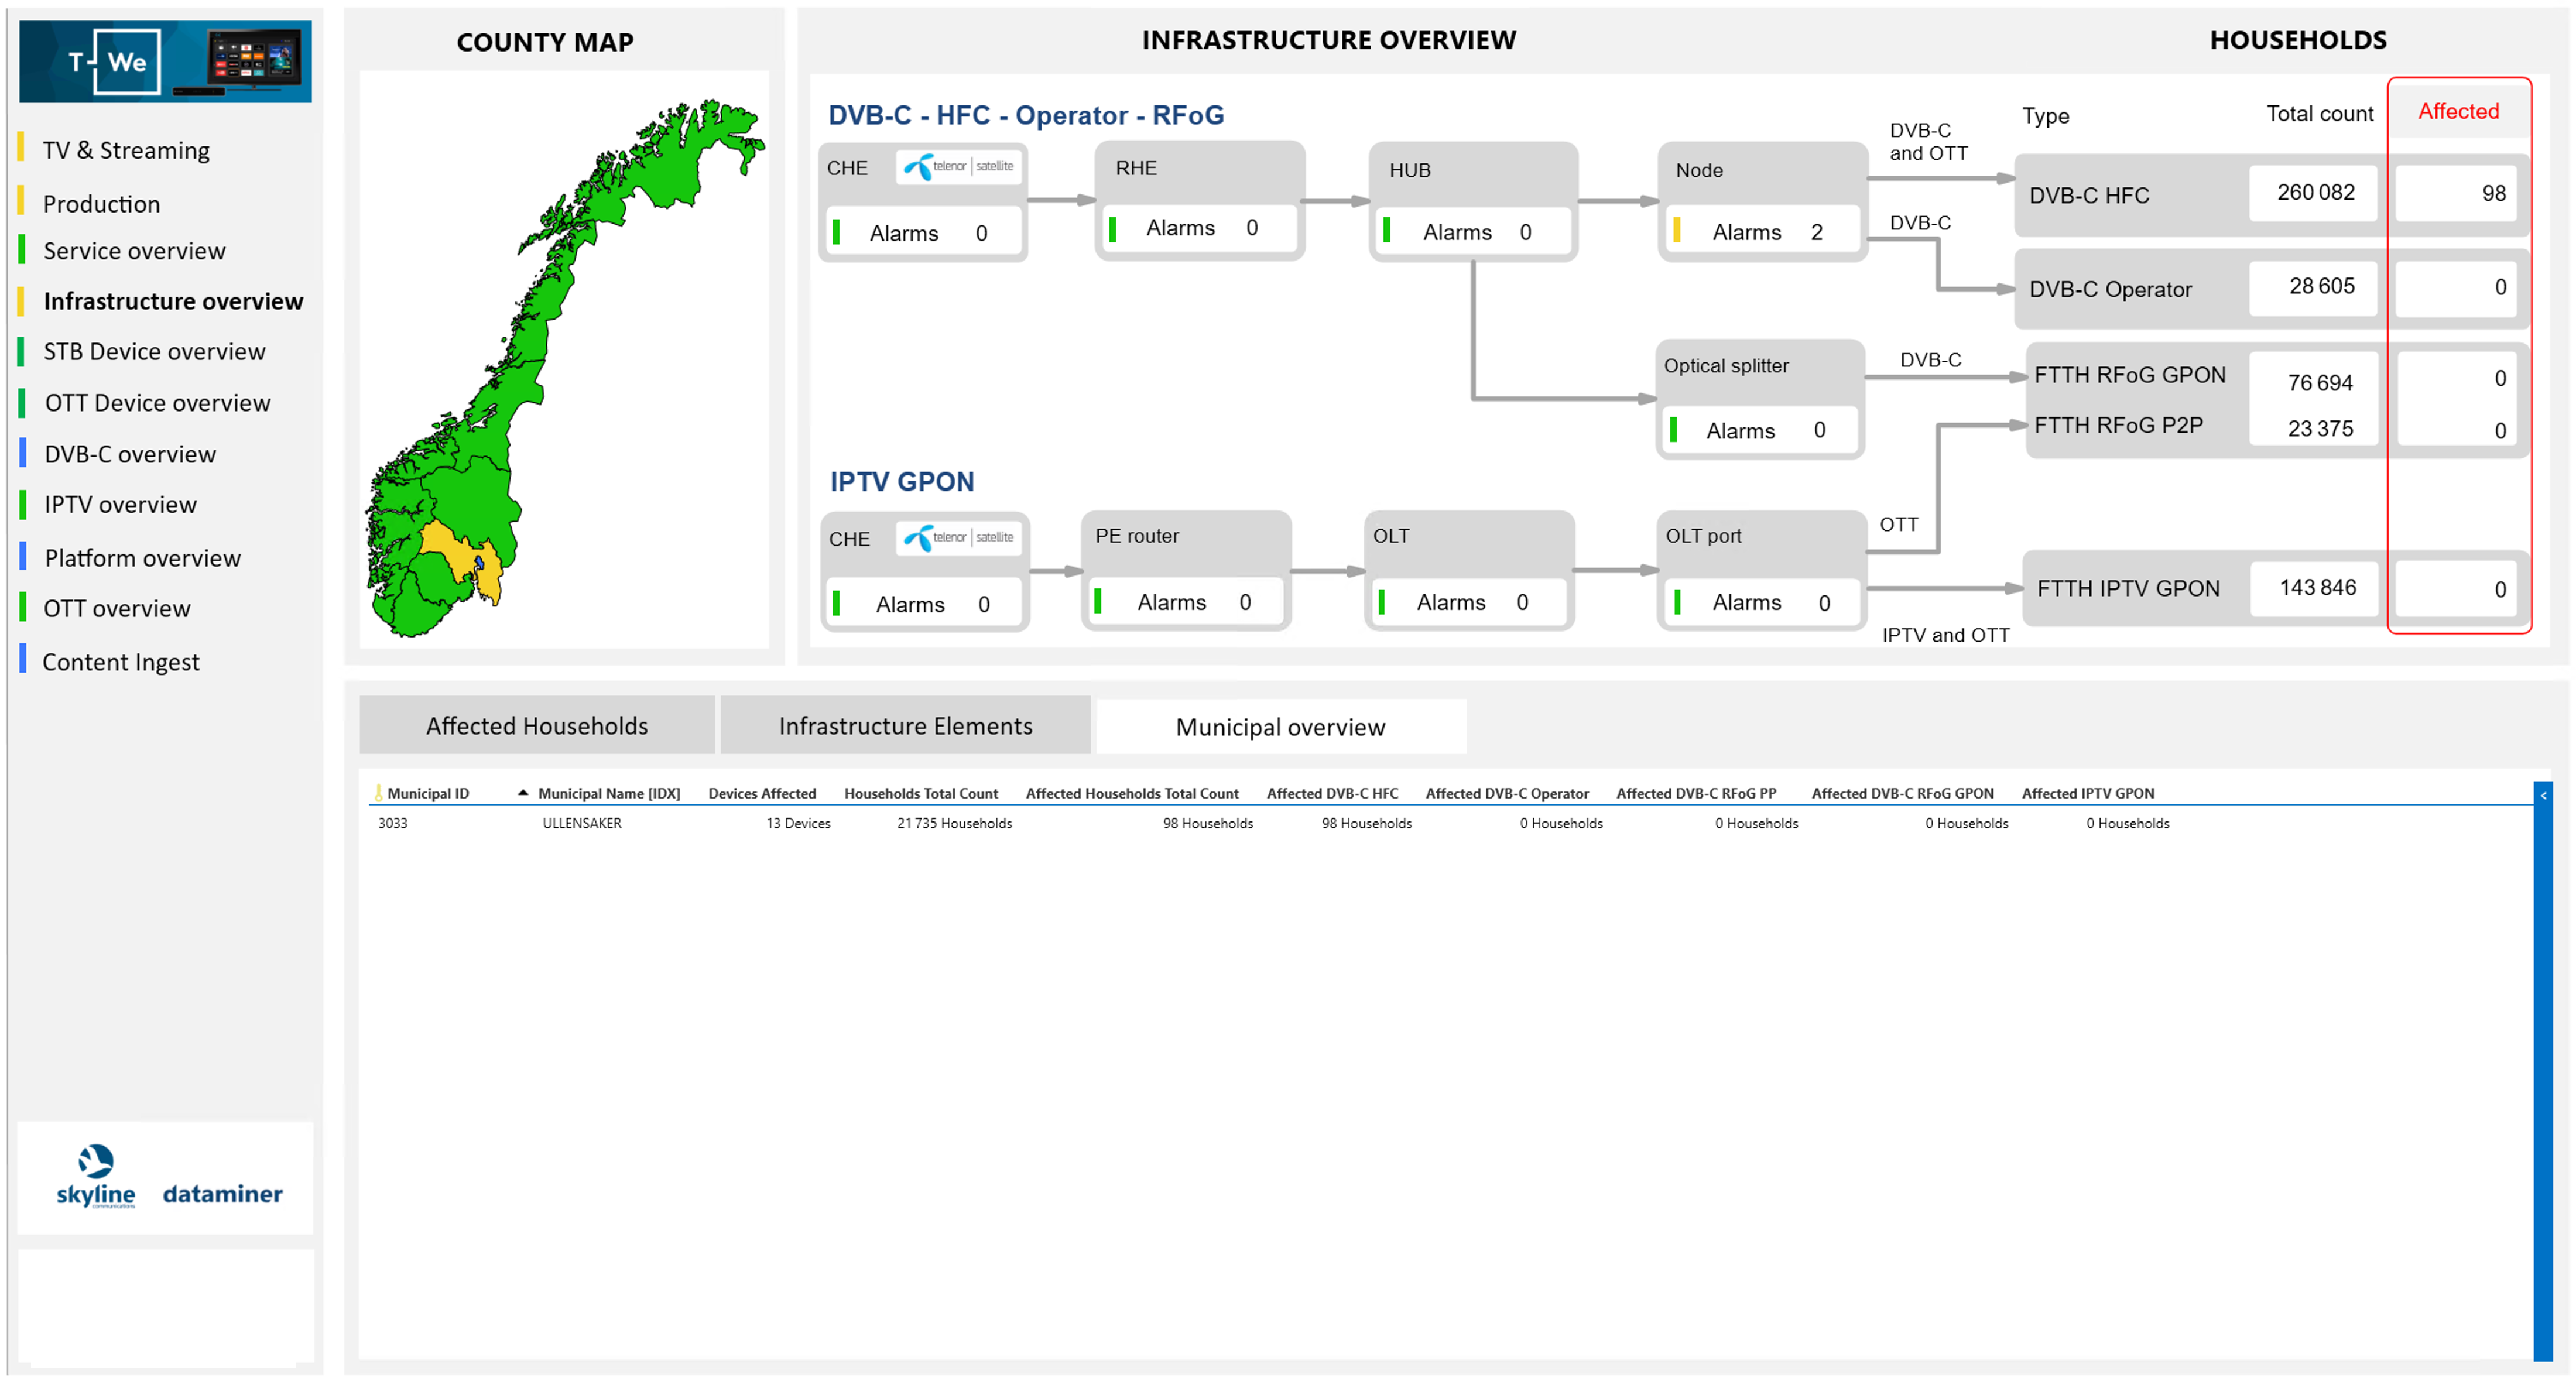 Overview of incident impact, e.g. municipality, subscriber count, etc.
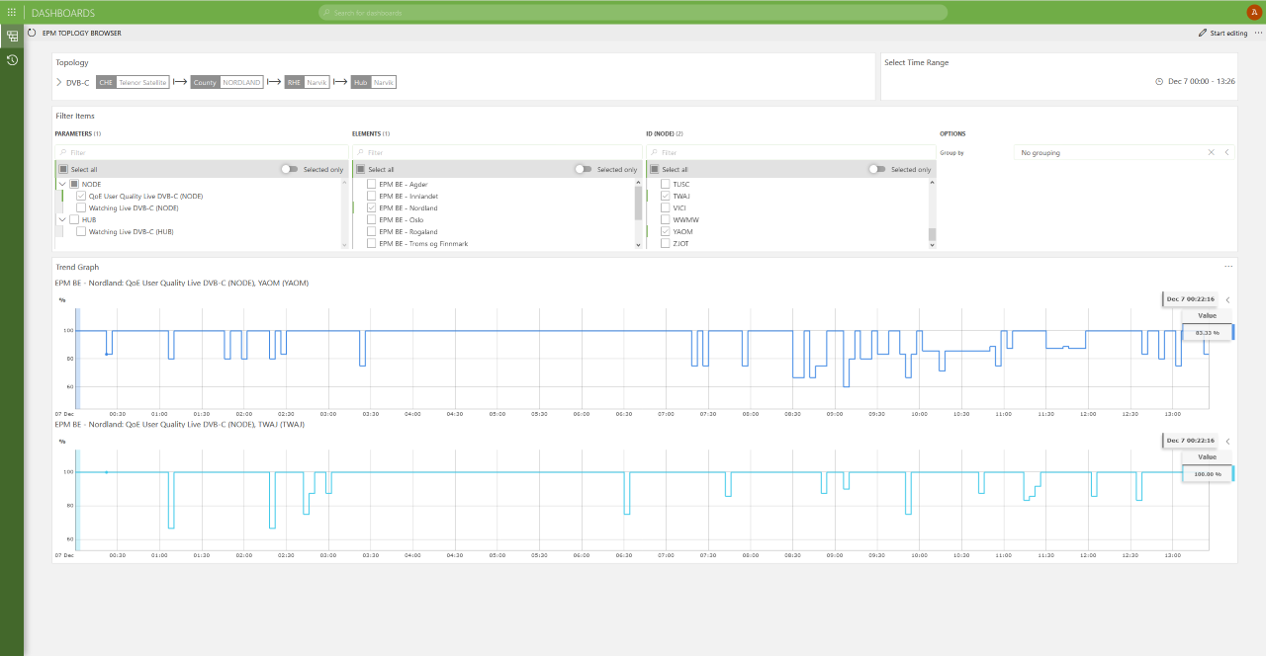 Comparison of QoE trend data for two different network segments.
 Combined comparison of session quantities and QoE data for two different network segments.
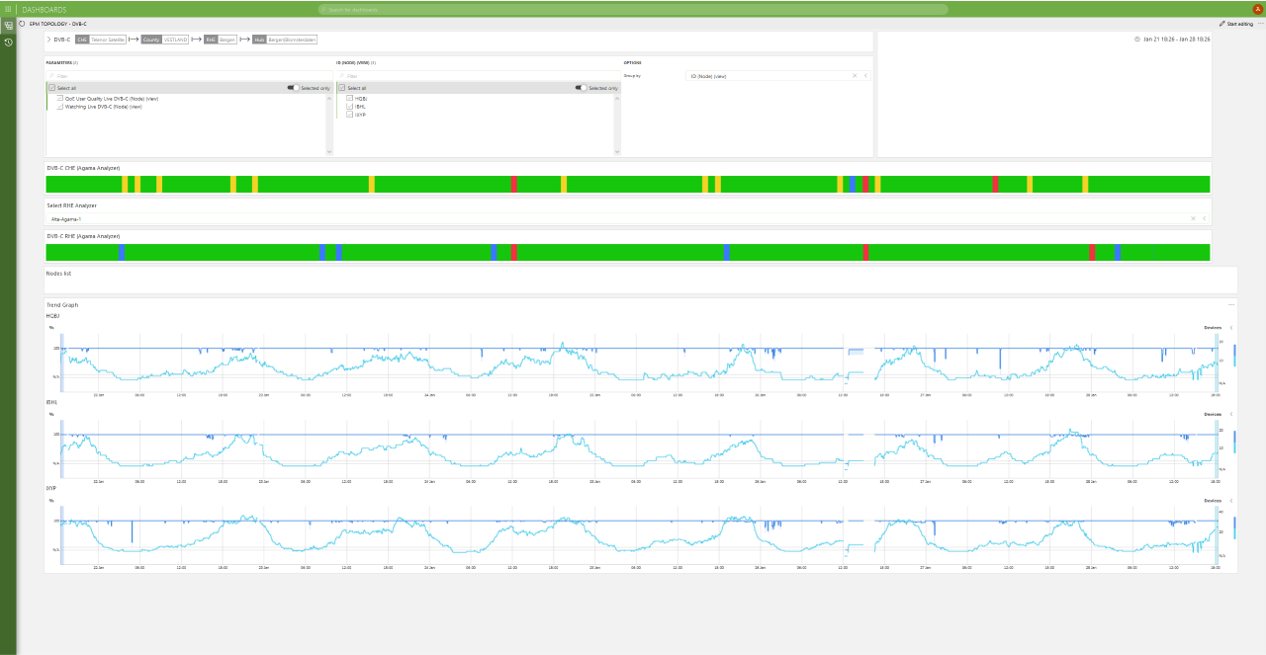 Consolidated overview of QoS at central and regional headend location and QoE in the various network segments served by these.
 Session and QoE information per channel.
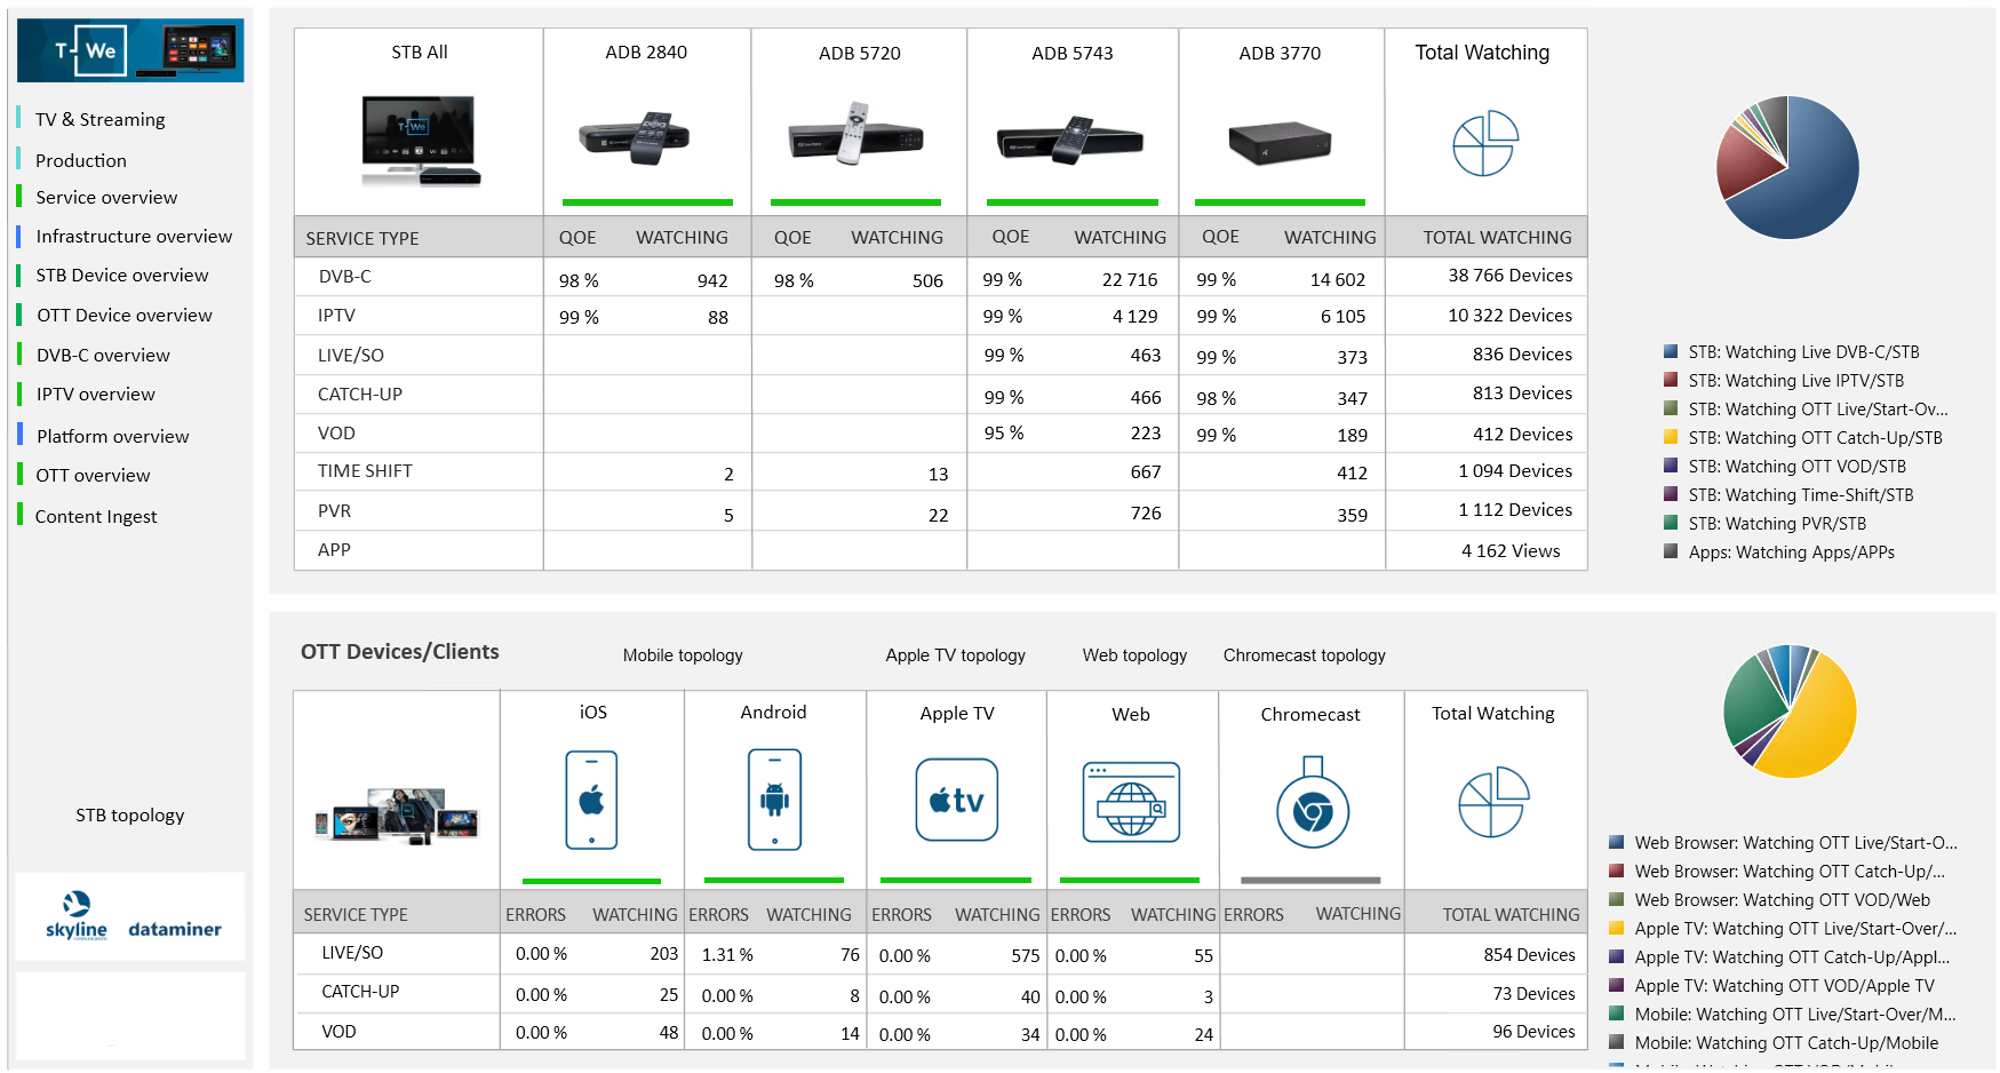 Overview of QoE per platform and type of service endpoint (managed STB or unmanaged).
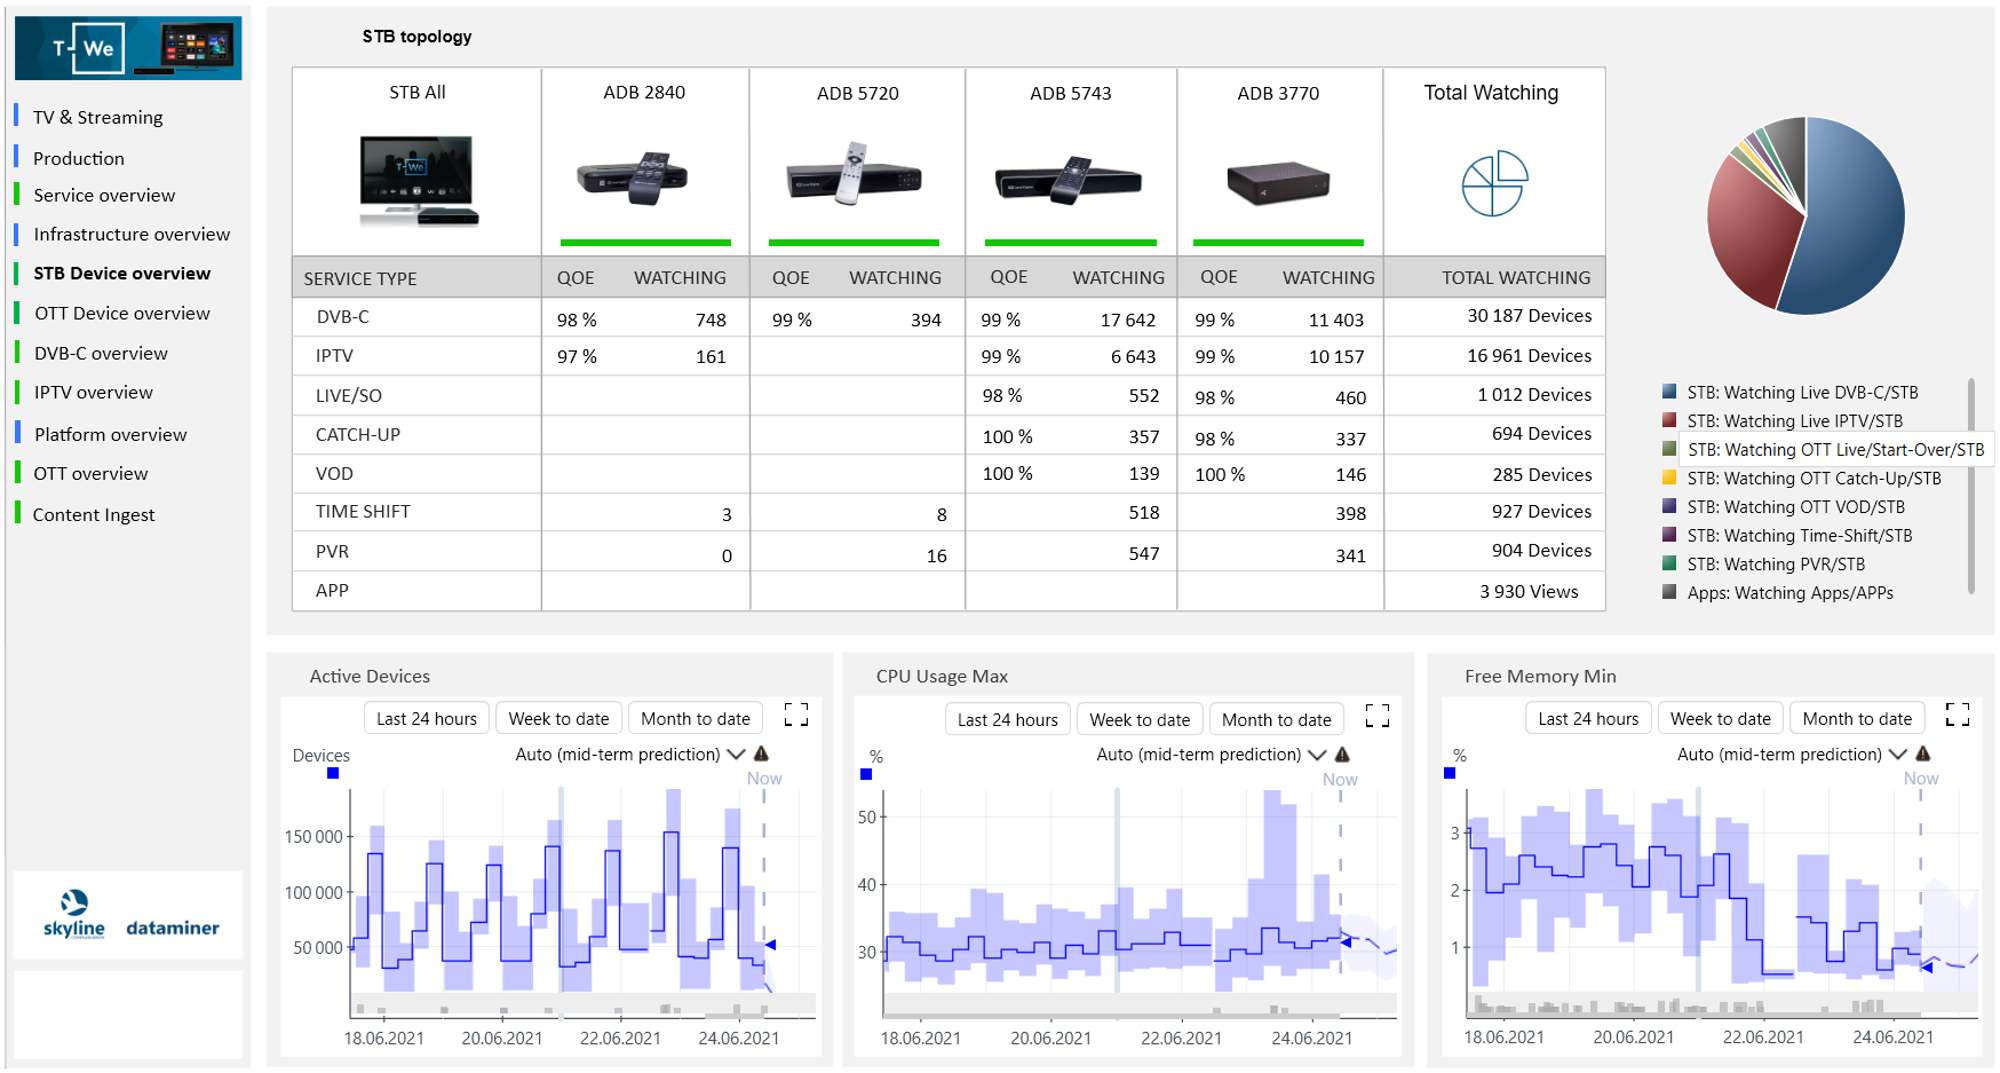 Overview of QoE per platform and type of managed service endpoint (STB).
 QoE summary overview of a specific type of STB (managed service endpoint).
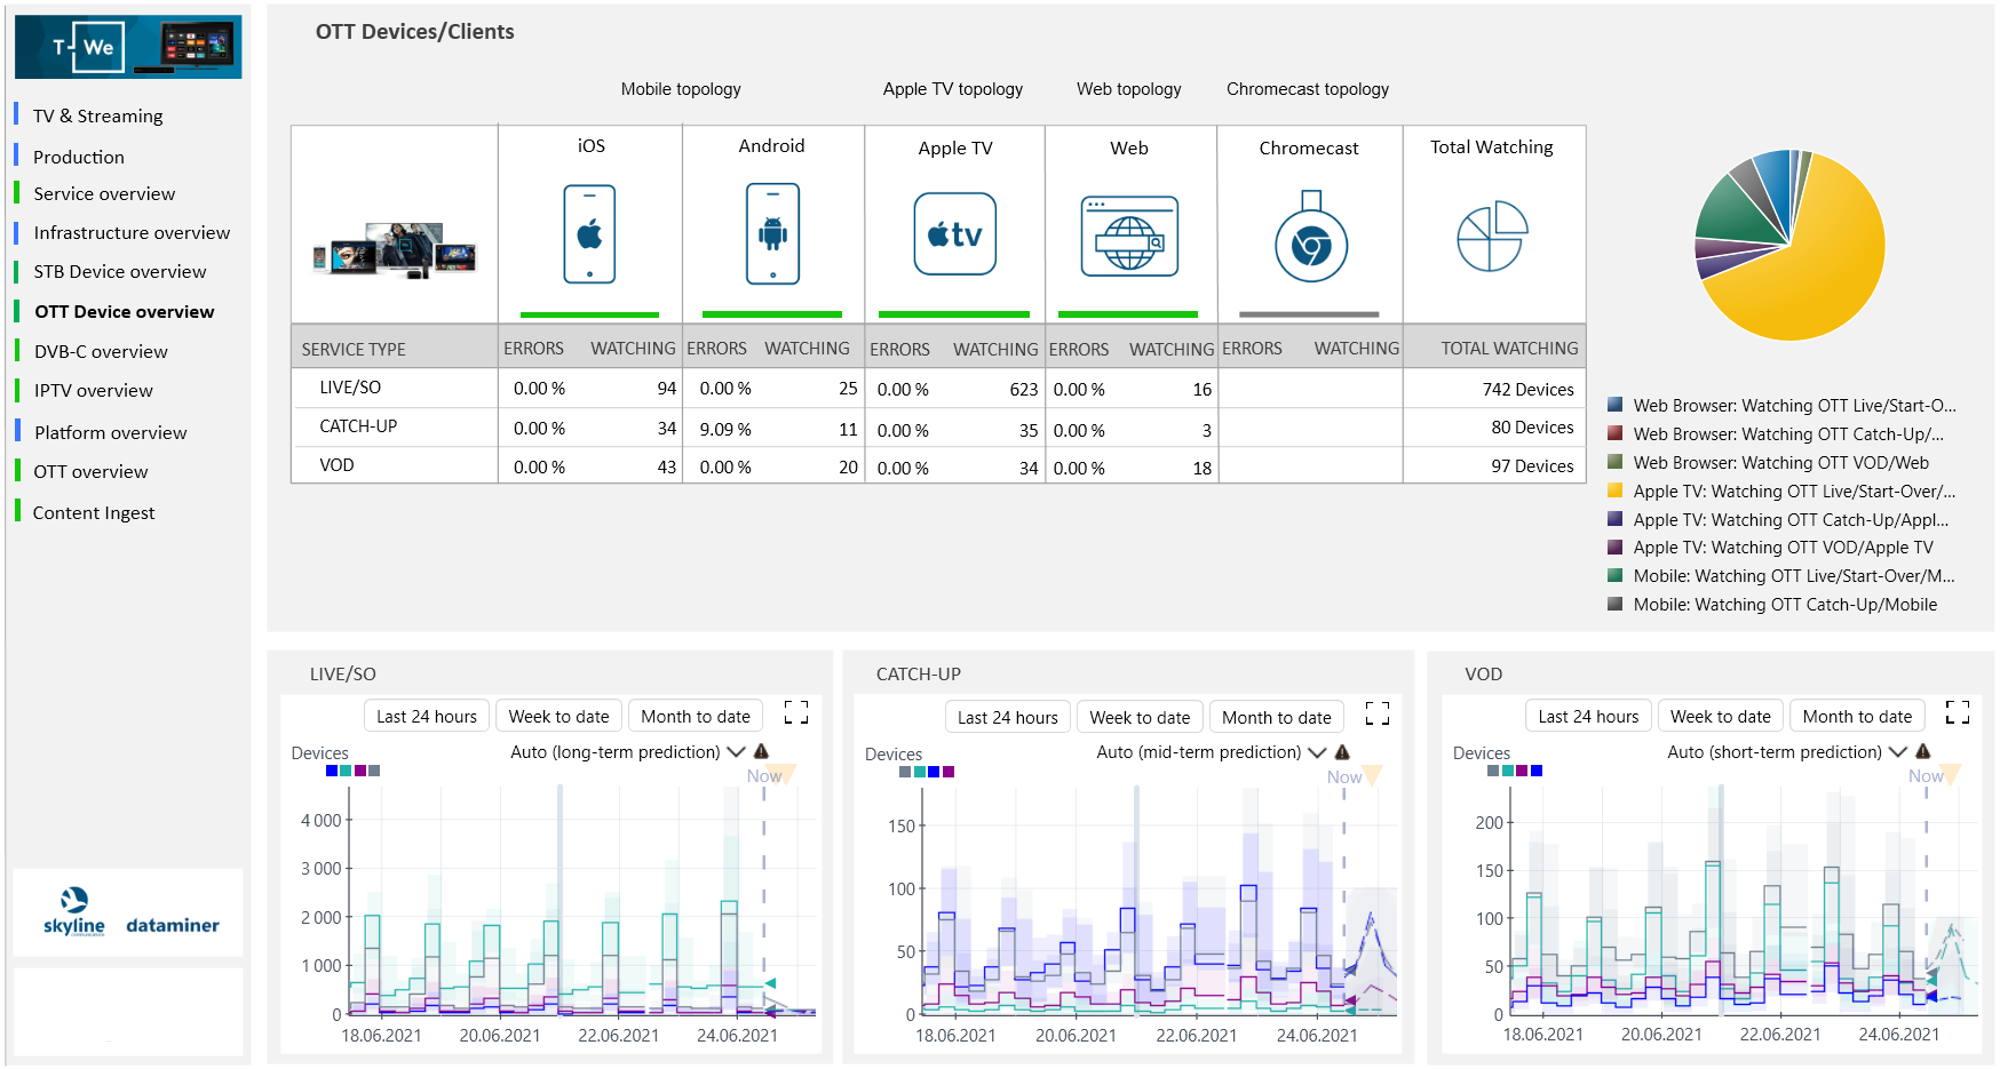 Overview of QoE per platform and type of unmanaged service endpoint.
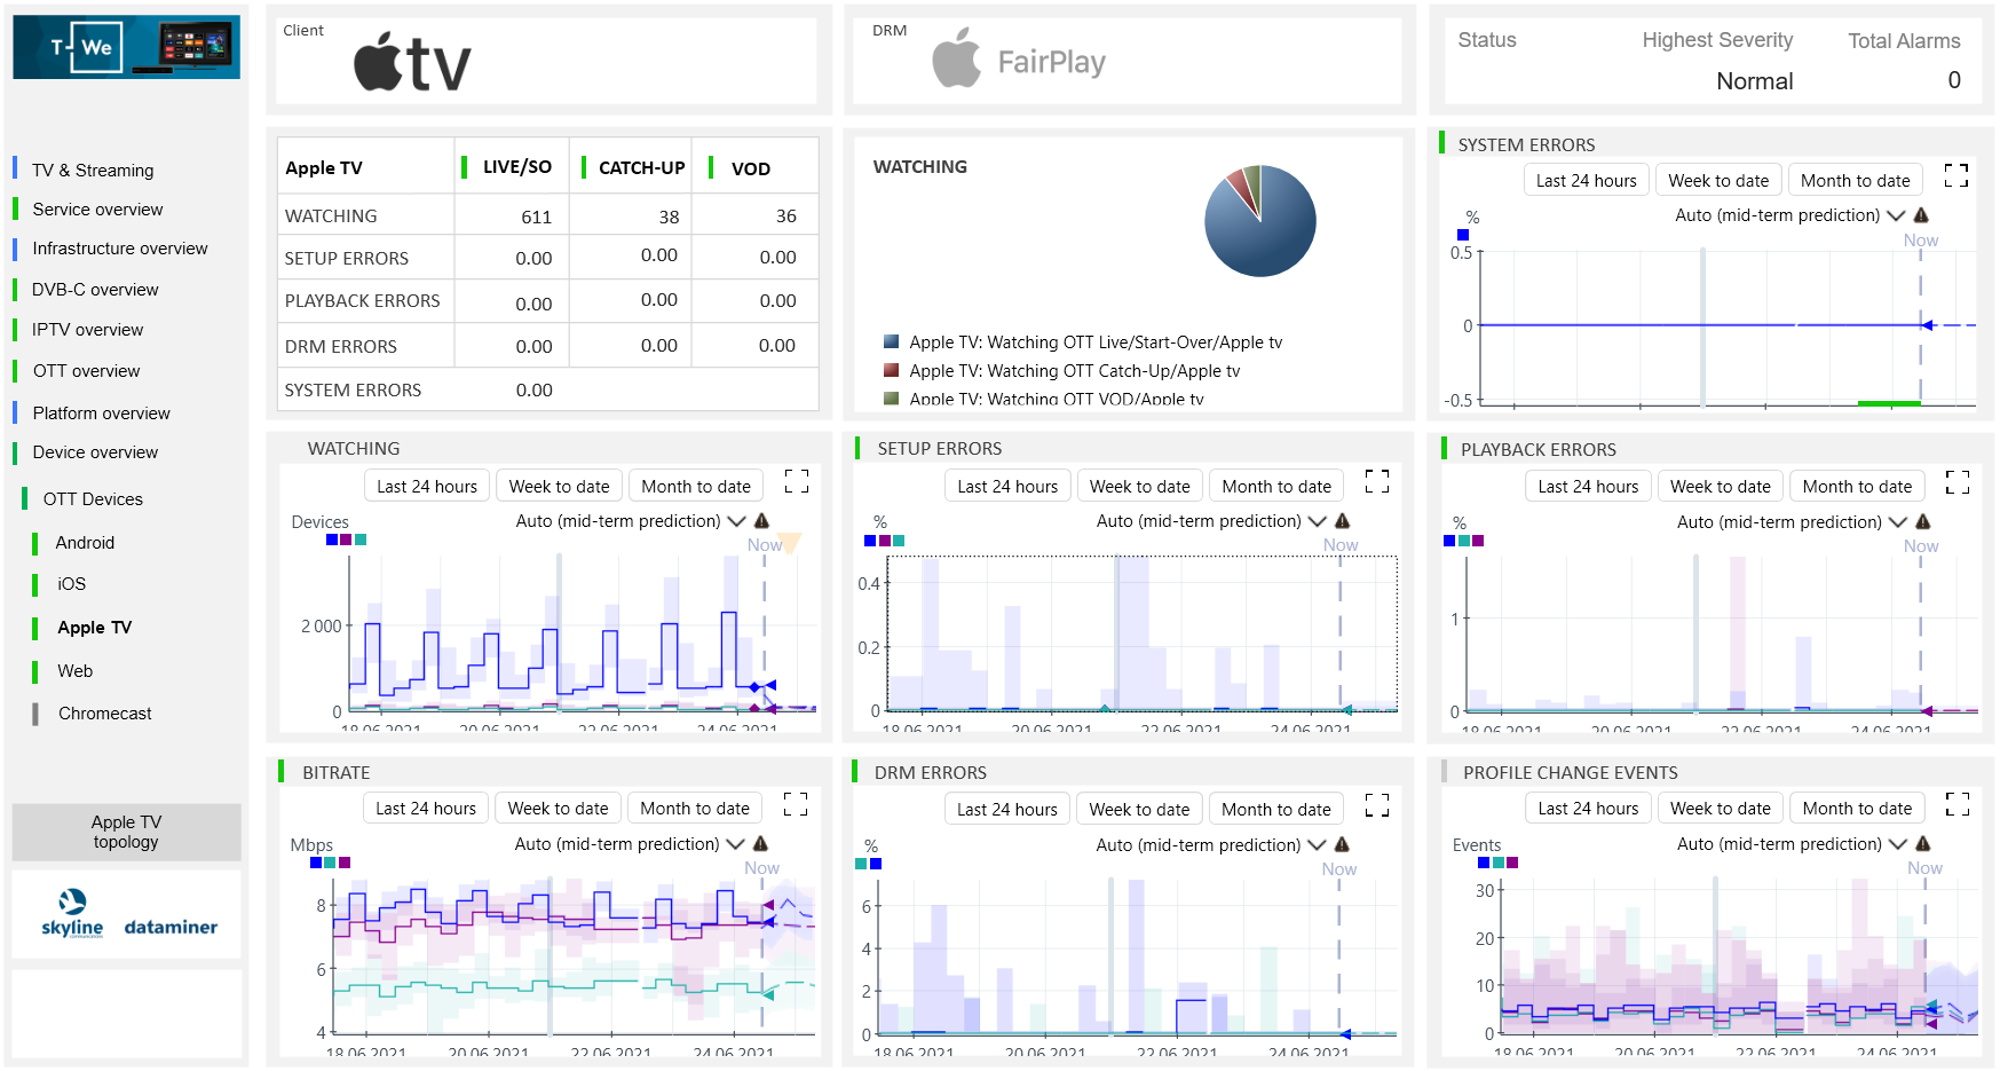 QoE summary overview of a specific type of service endpoint (unmanaged).
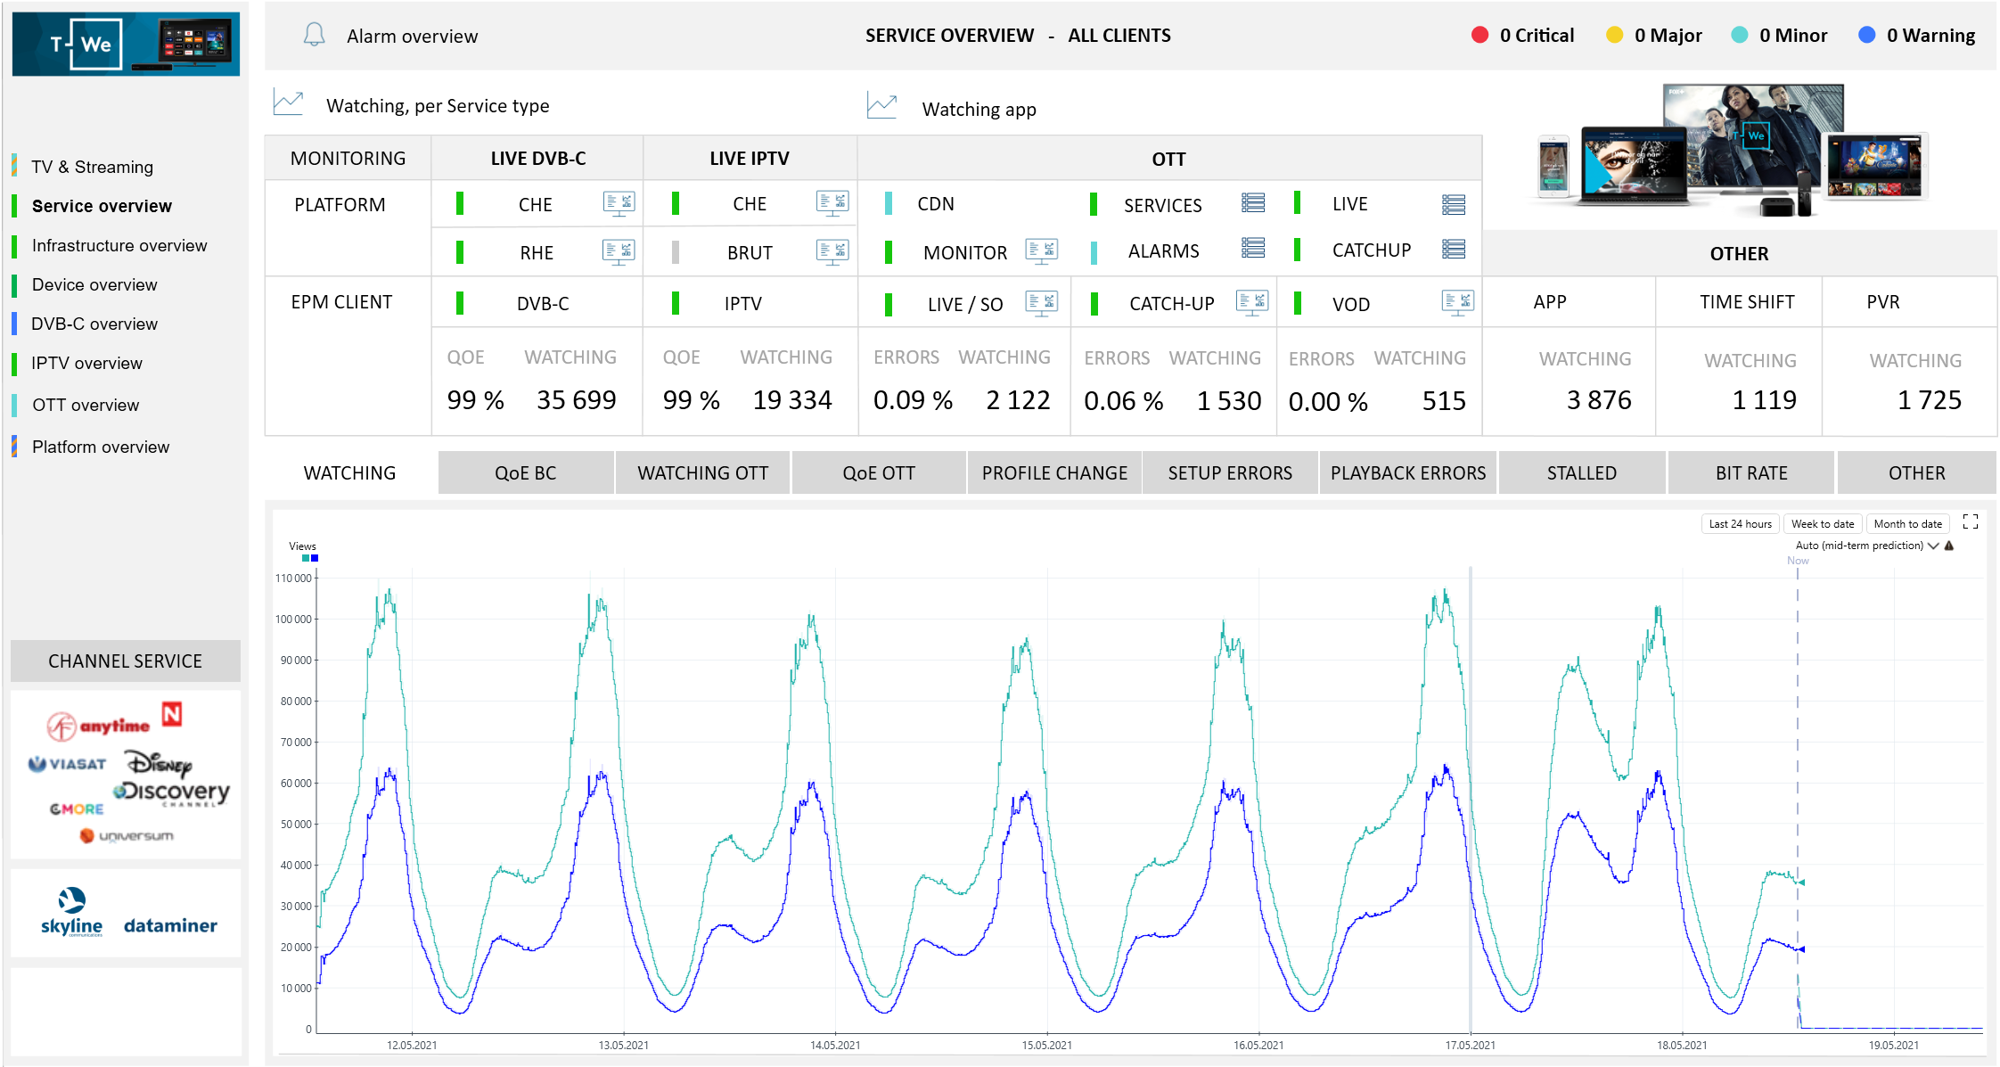 Service overview for all clients.
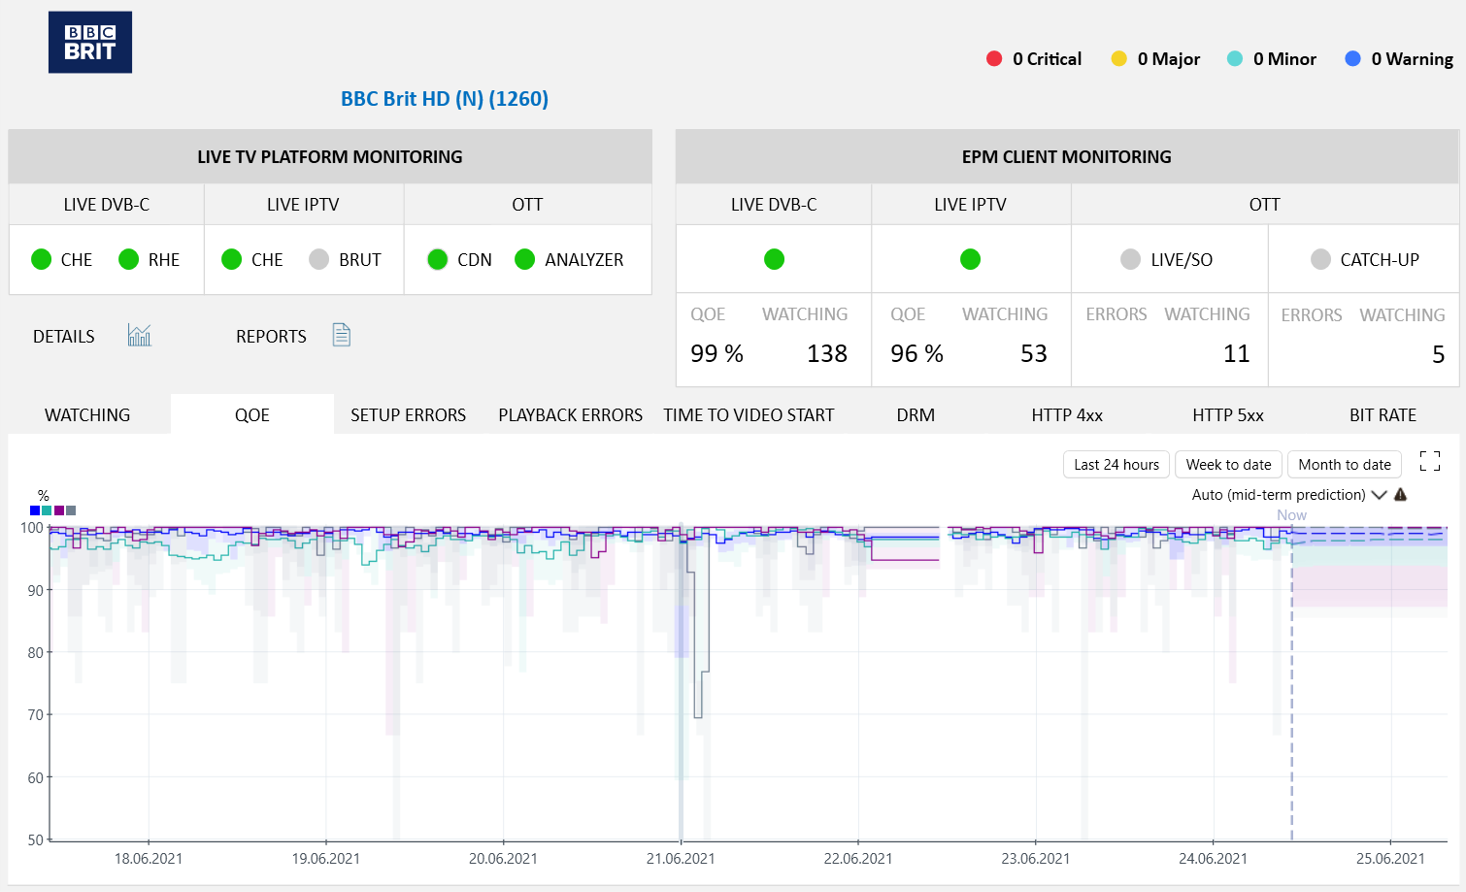
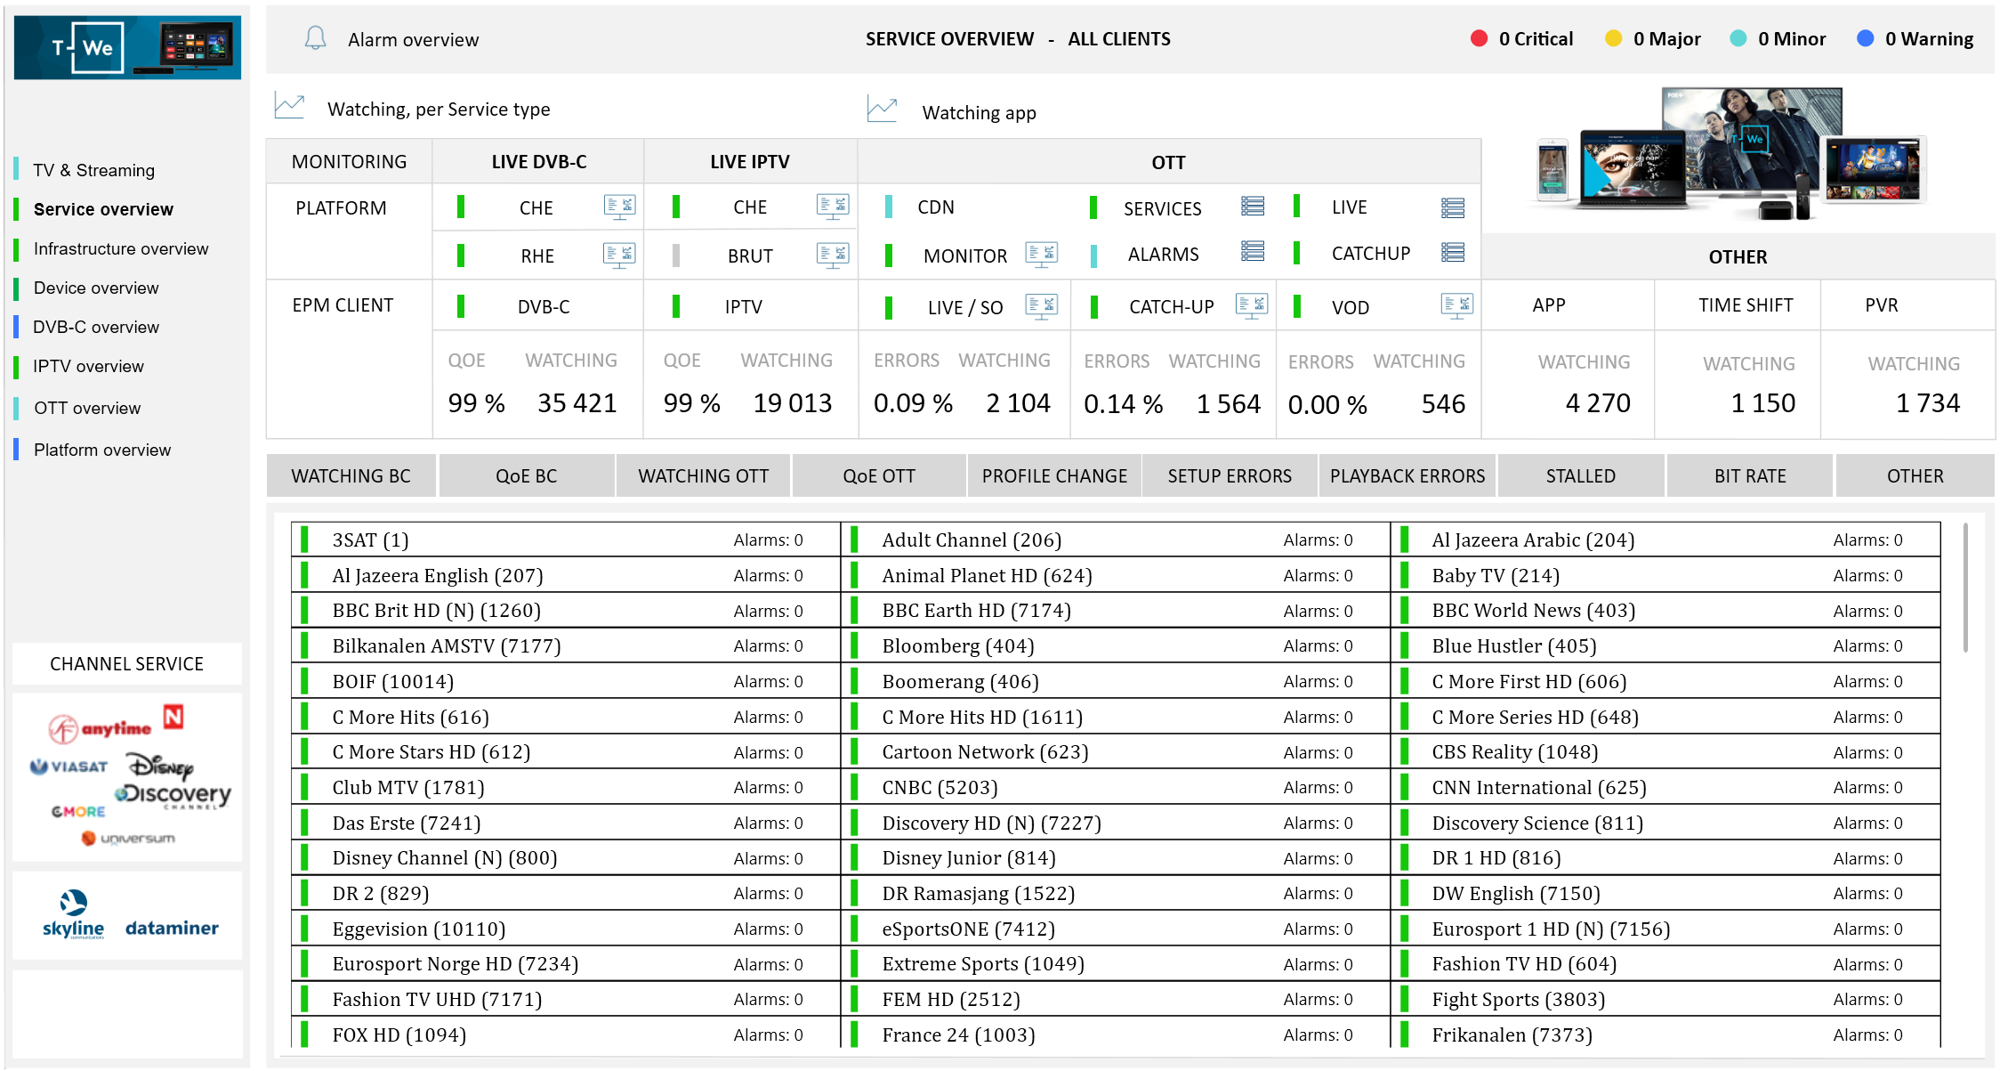 Channel status overview.
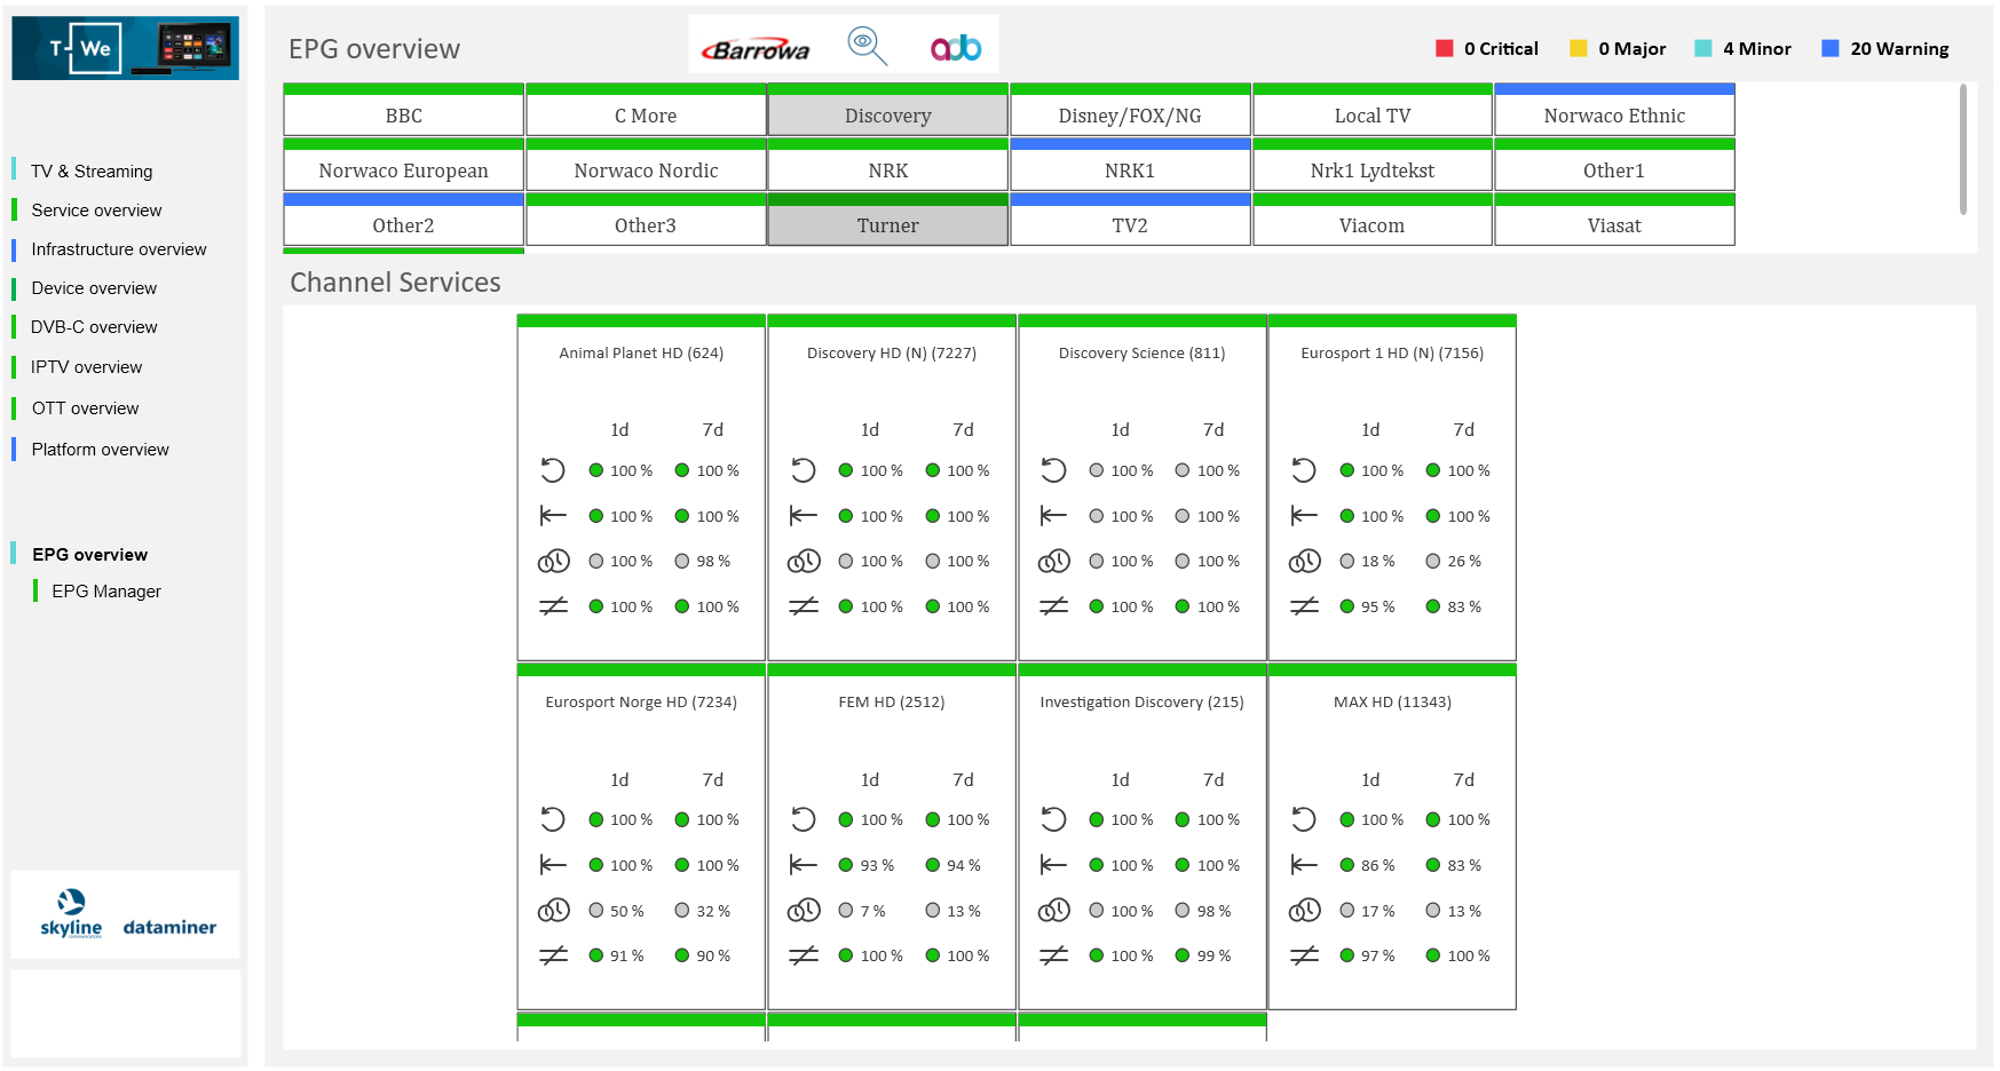 Visualization of EPG compliance status and consistency between STB EPG and EPG source data.
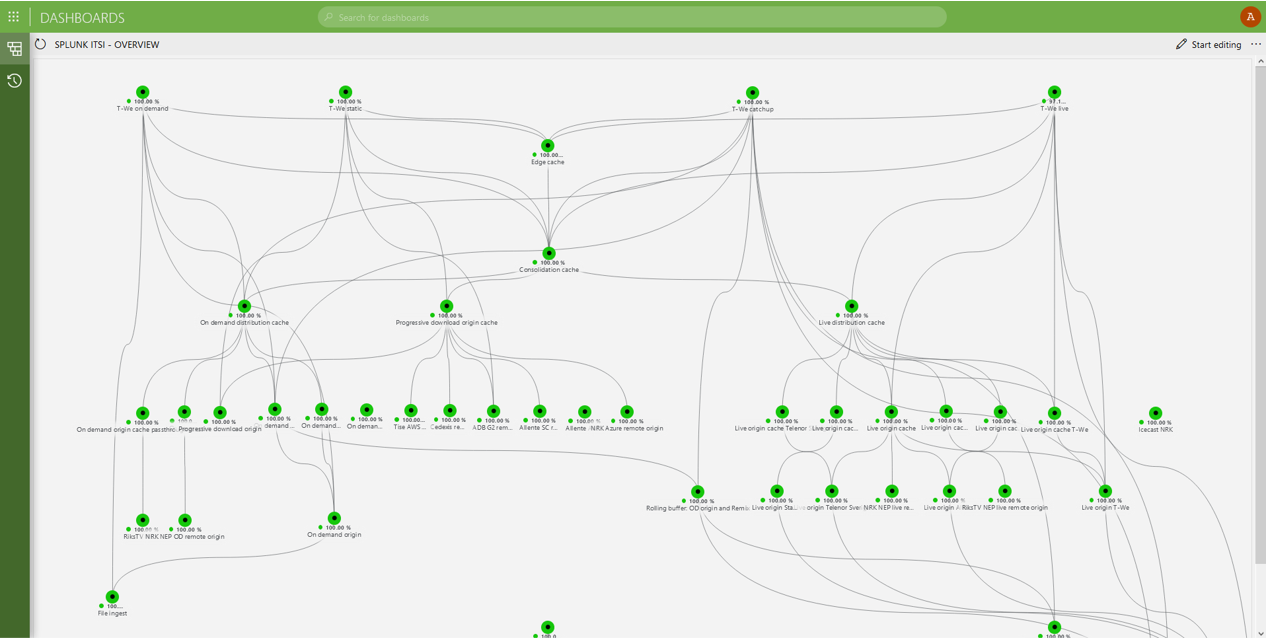 Node edge visualization of structure and health status for all IT services associated with OTT/CDN.
2 thoughts on “Quality of Experience Monitoring – QoE / EPM”
Leave a Reply
You must be logged in to post a comment.
This use case really depicts the power of what DataMiner stands for : connecting with any data source to ingest counters and metrics (in this case capturing streaming data from a Kafka bus amongst others), powerful data aggregation and analytics, and last but not least : great and interactive dashboarding.
Thanks Dominique for sharing this use case on Dojo. This makes it clear to our customers what DataMiner can do for their OTT, IPTV and DVB-C technologies. A powerful monitoring and orchestration tool that allows you to collect data from different devices from different vendors in one dashboard.