workflow Use Case
Proactive Network Maintenance (PNM)
docsis
In accordance with the D3.0 Proactive Network Maintenance (PNM) scheme, as described in CableLabs “PNM Best Practices: HFC Networks (DOCSIS 3.0)”, DataMiner looks at the upstream channel equalization used for the communication from cable modem to cable modem termination system (CMTS). The equalization is defined by 24 taps. Based on both the value and distribution of these, DataMiner can detect and identify any network impairments (e.g. group delay or reflection).
USE CASE DETAILS
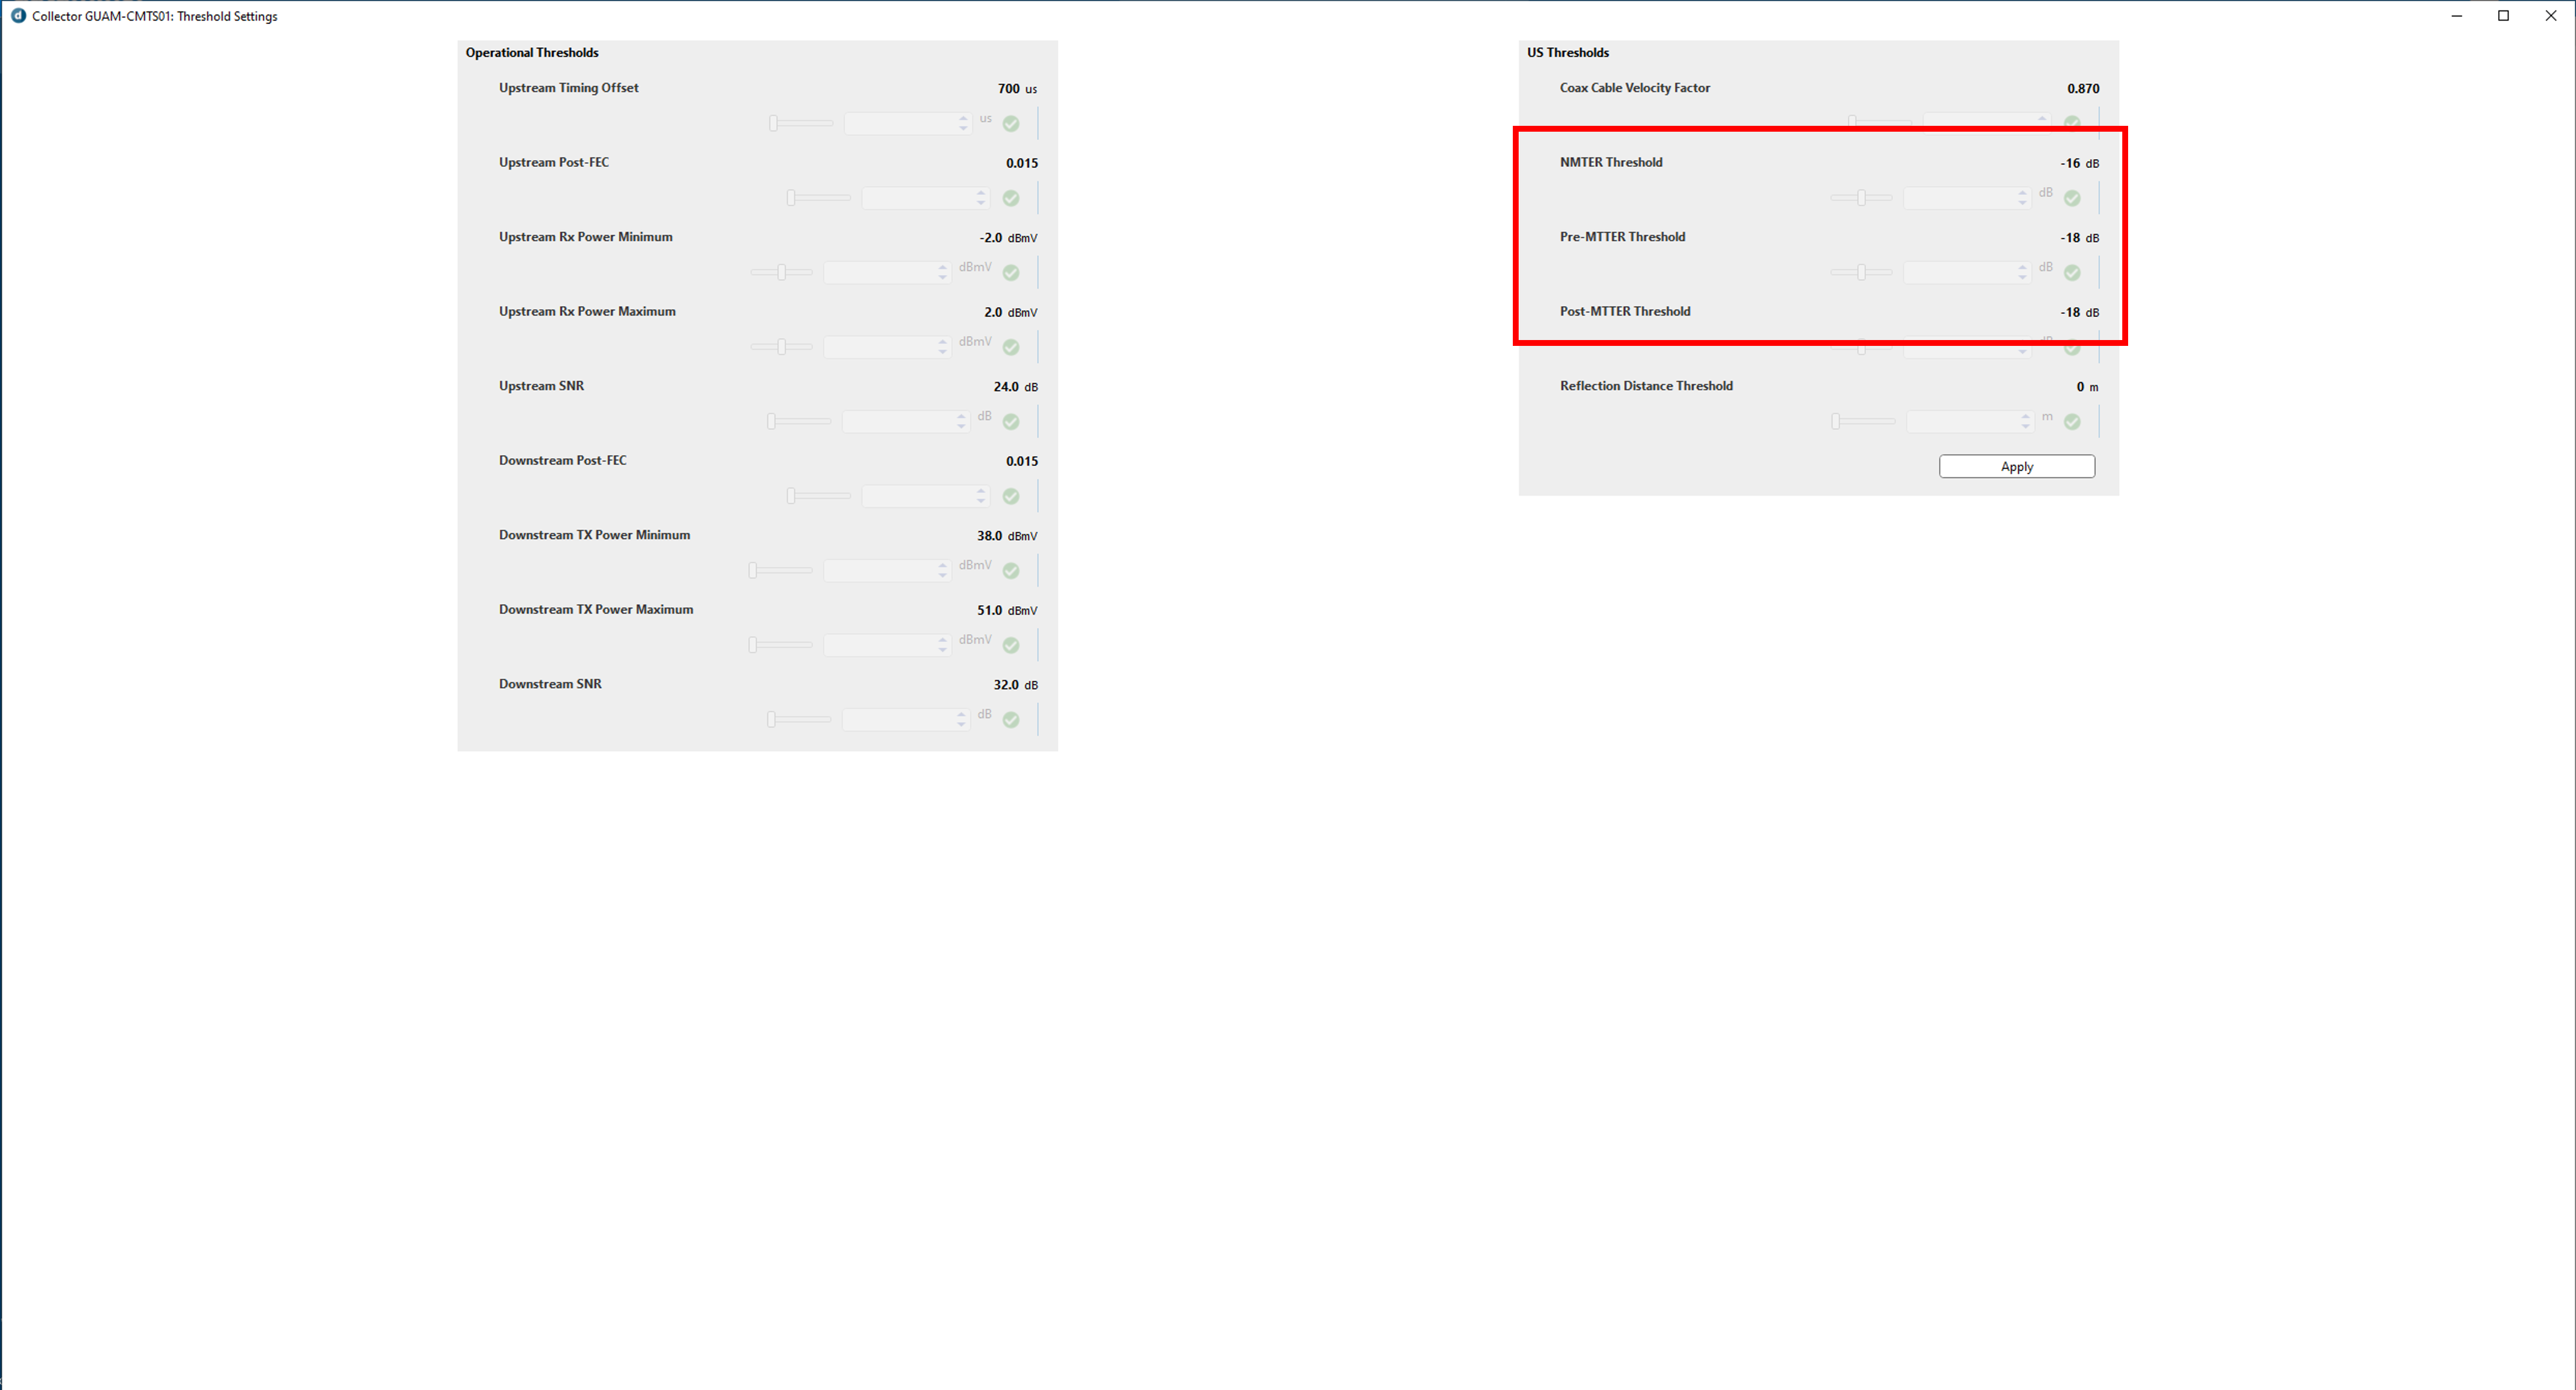 In the modem collector elements, the thresholds for pre- and post-main tap energy levels are defined. These will be used to scan for modems affected by group delay and reflection issues.
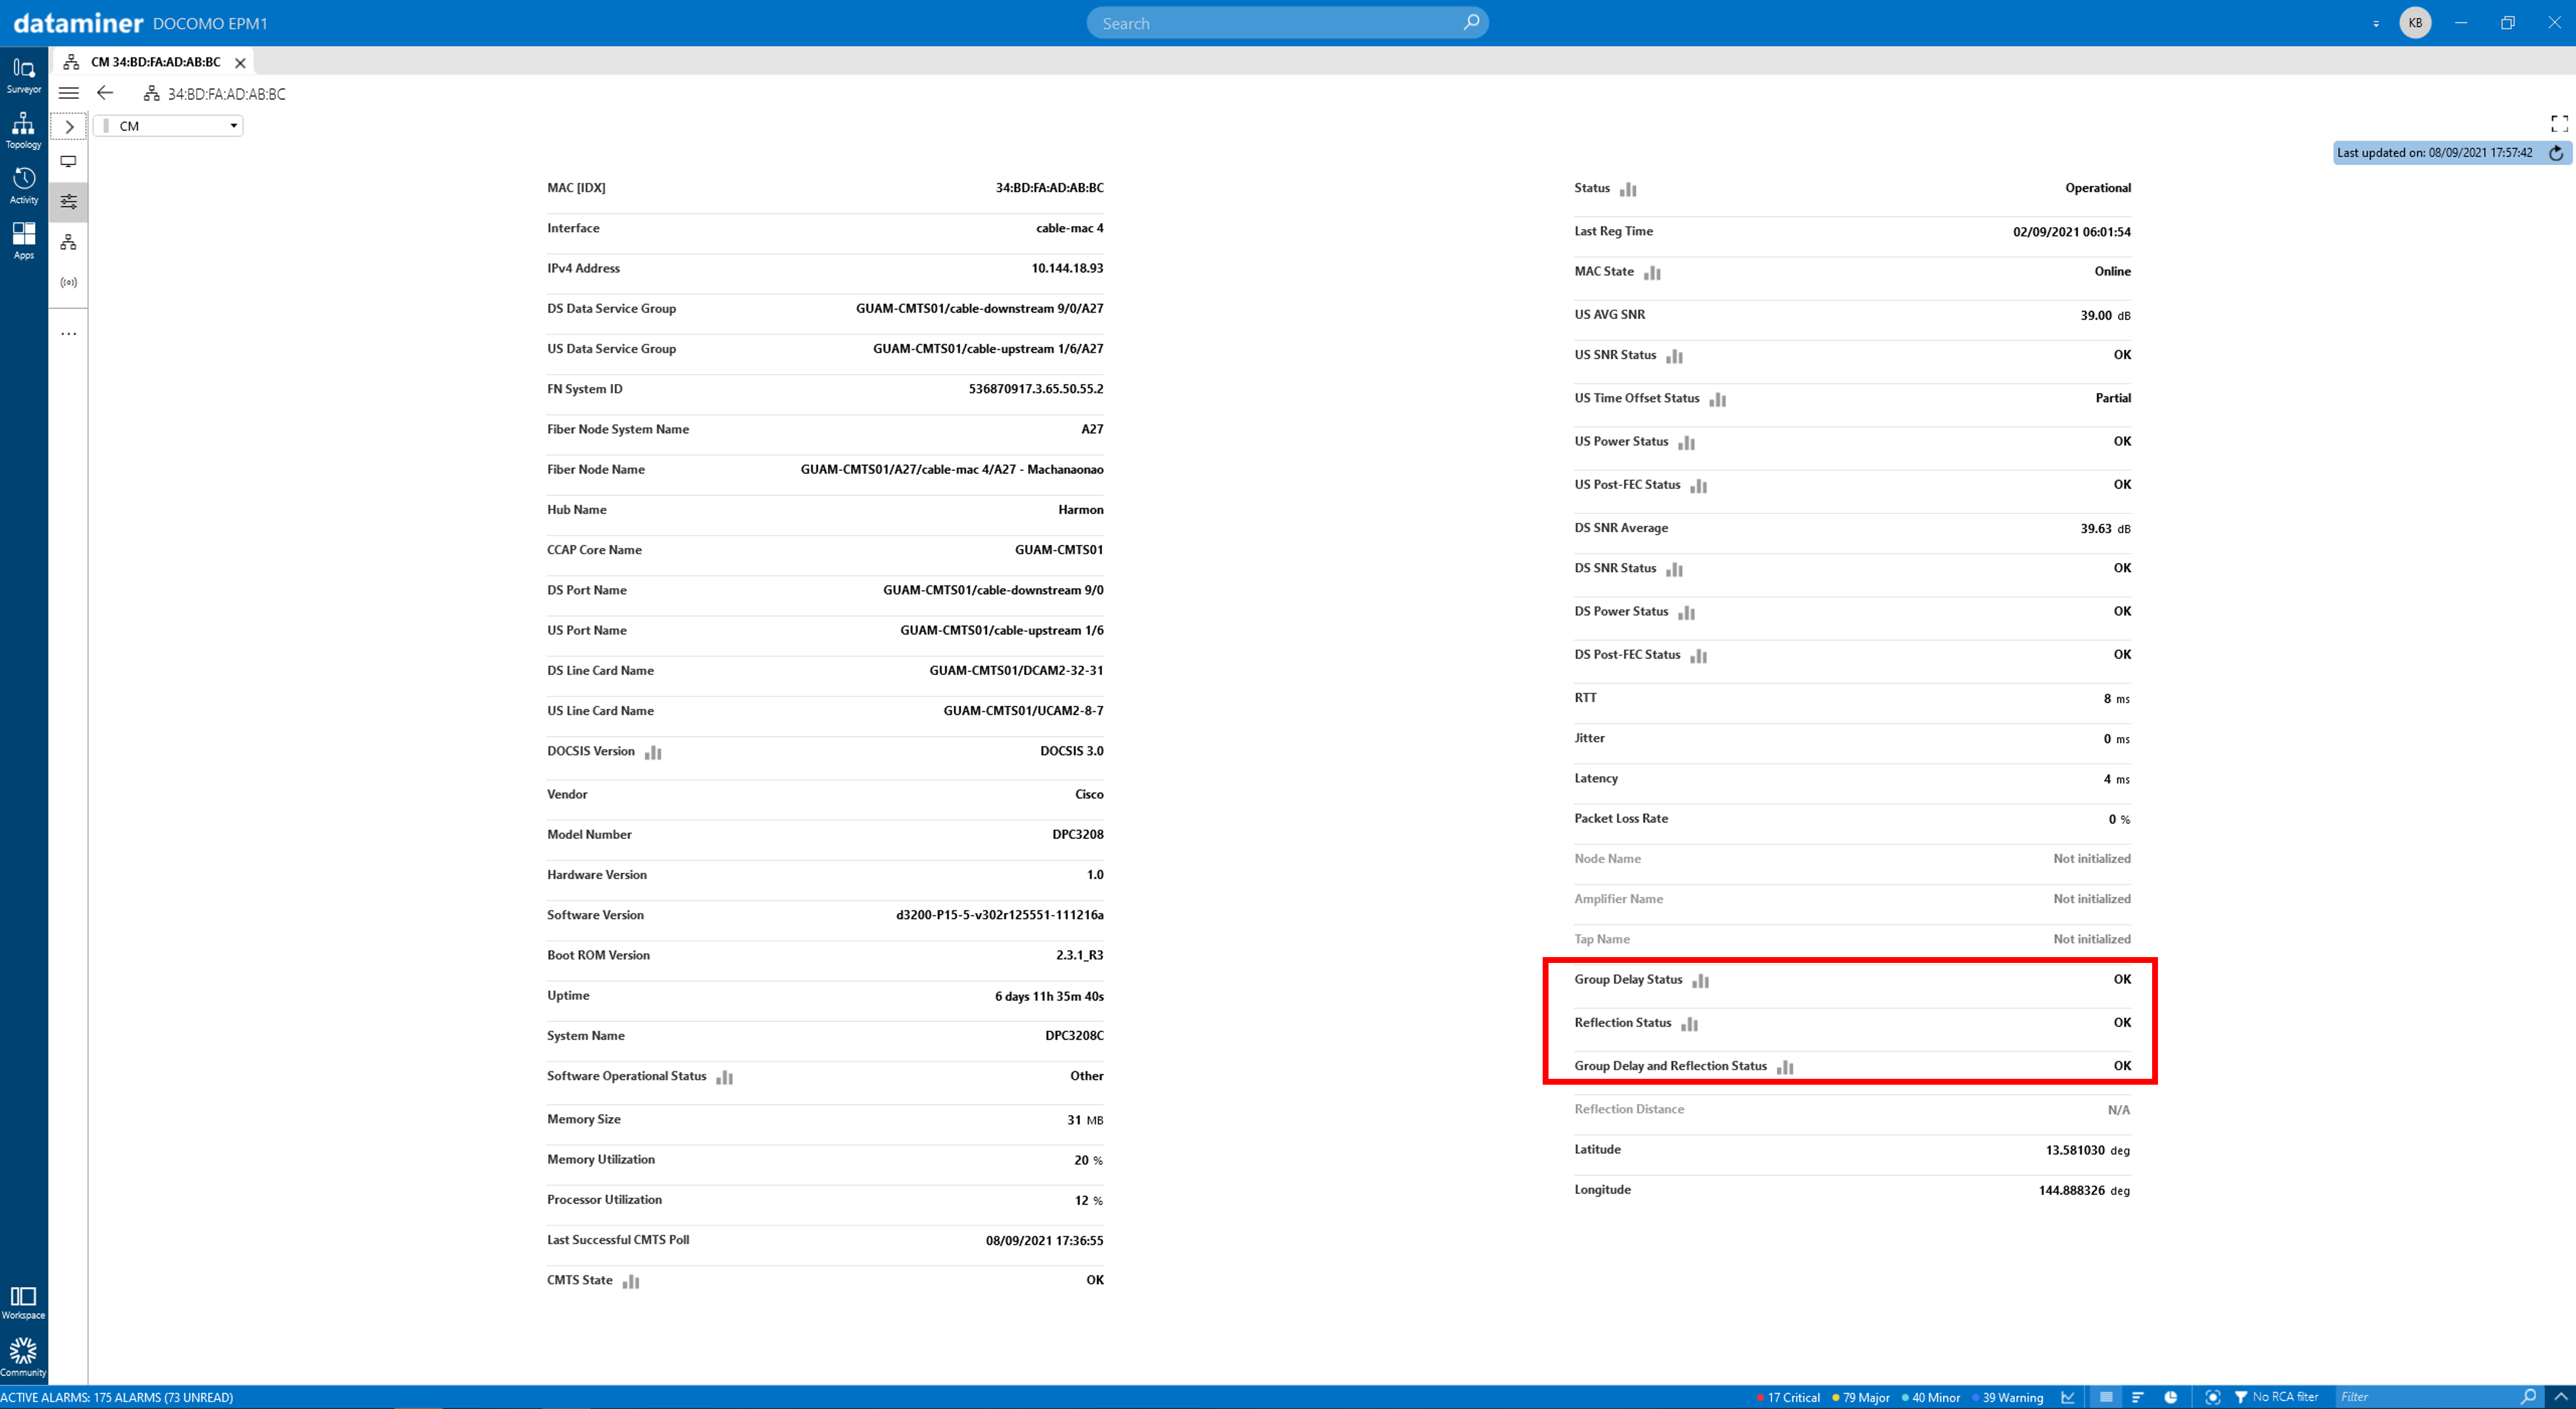 For every single modem, DataMiner shows if it is affected by group delay, reflection or by either of these. If a modem is affected by reflection, the reflection distance (which equals the size of the reflection cavity) is immediately indicated. This makes it easier to spot modems affected by the same impairment.
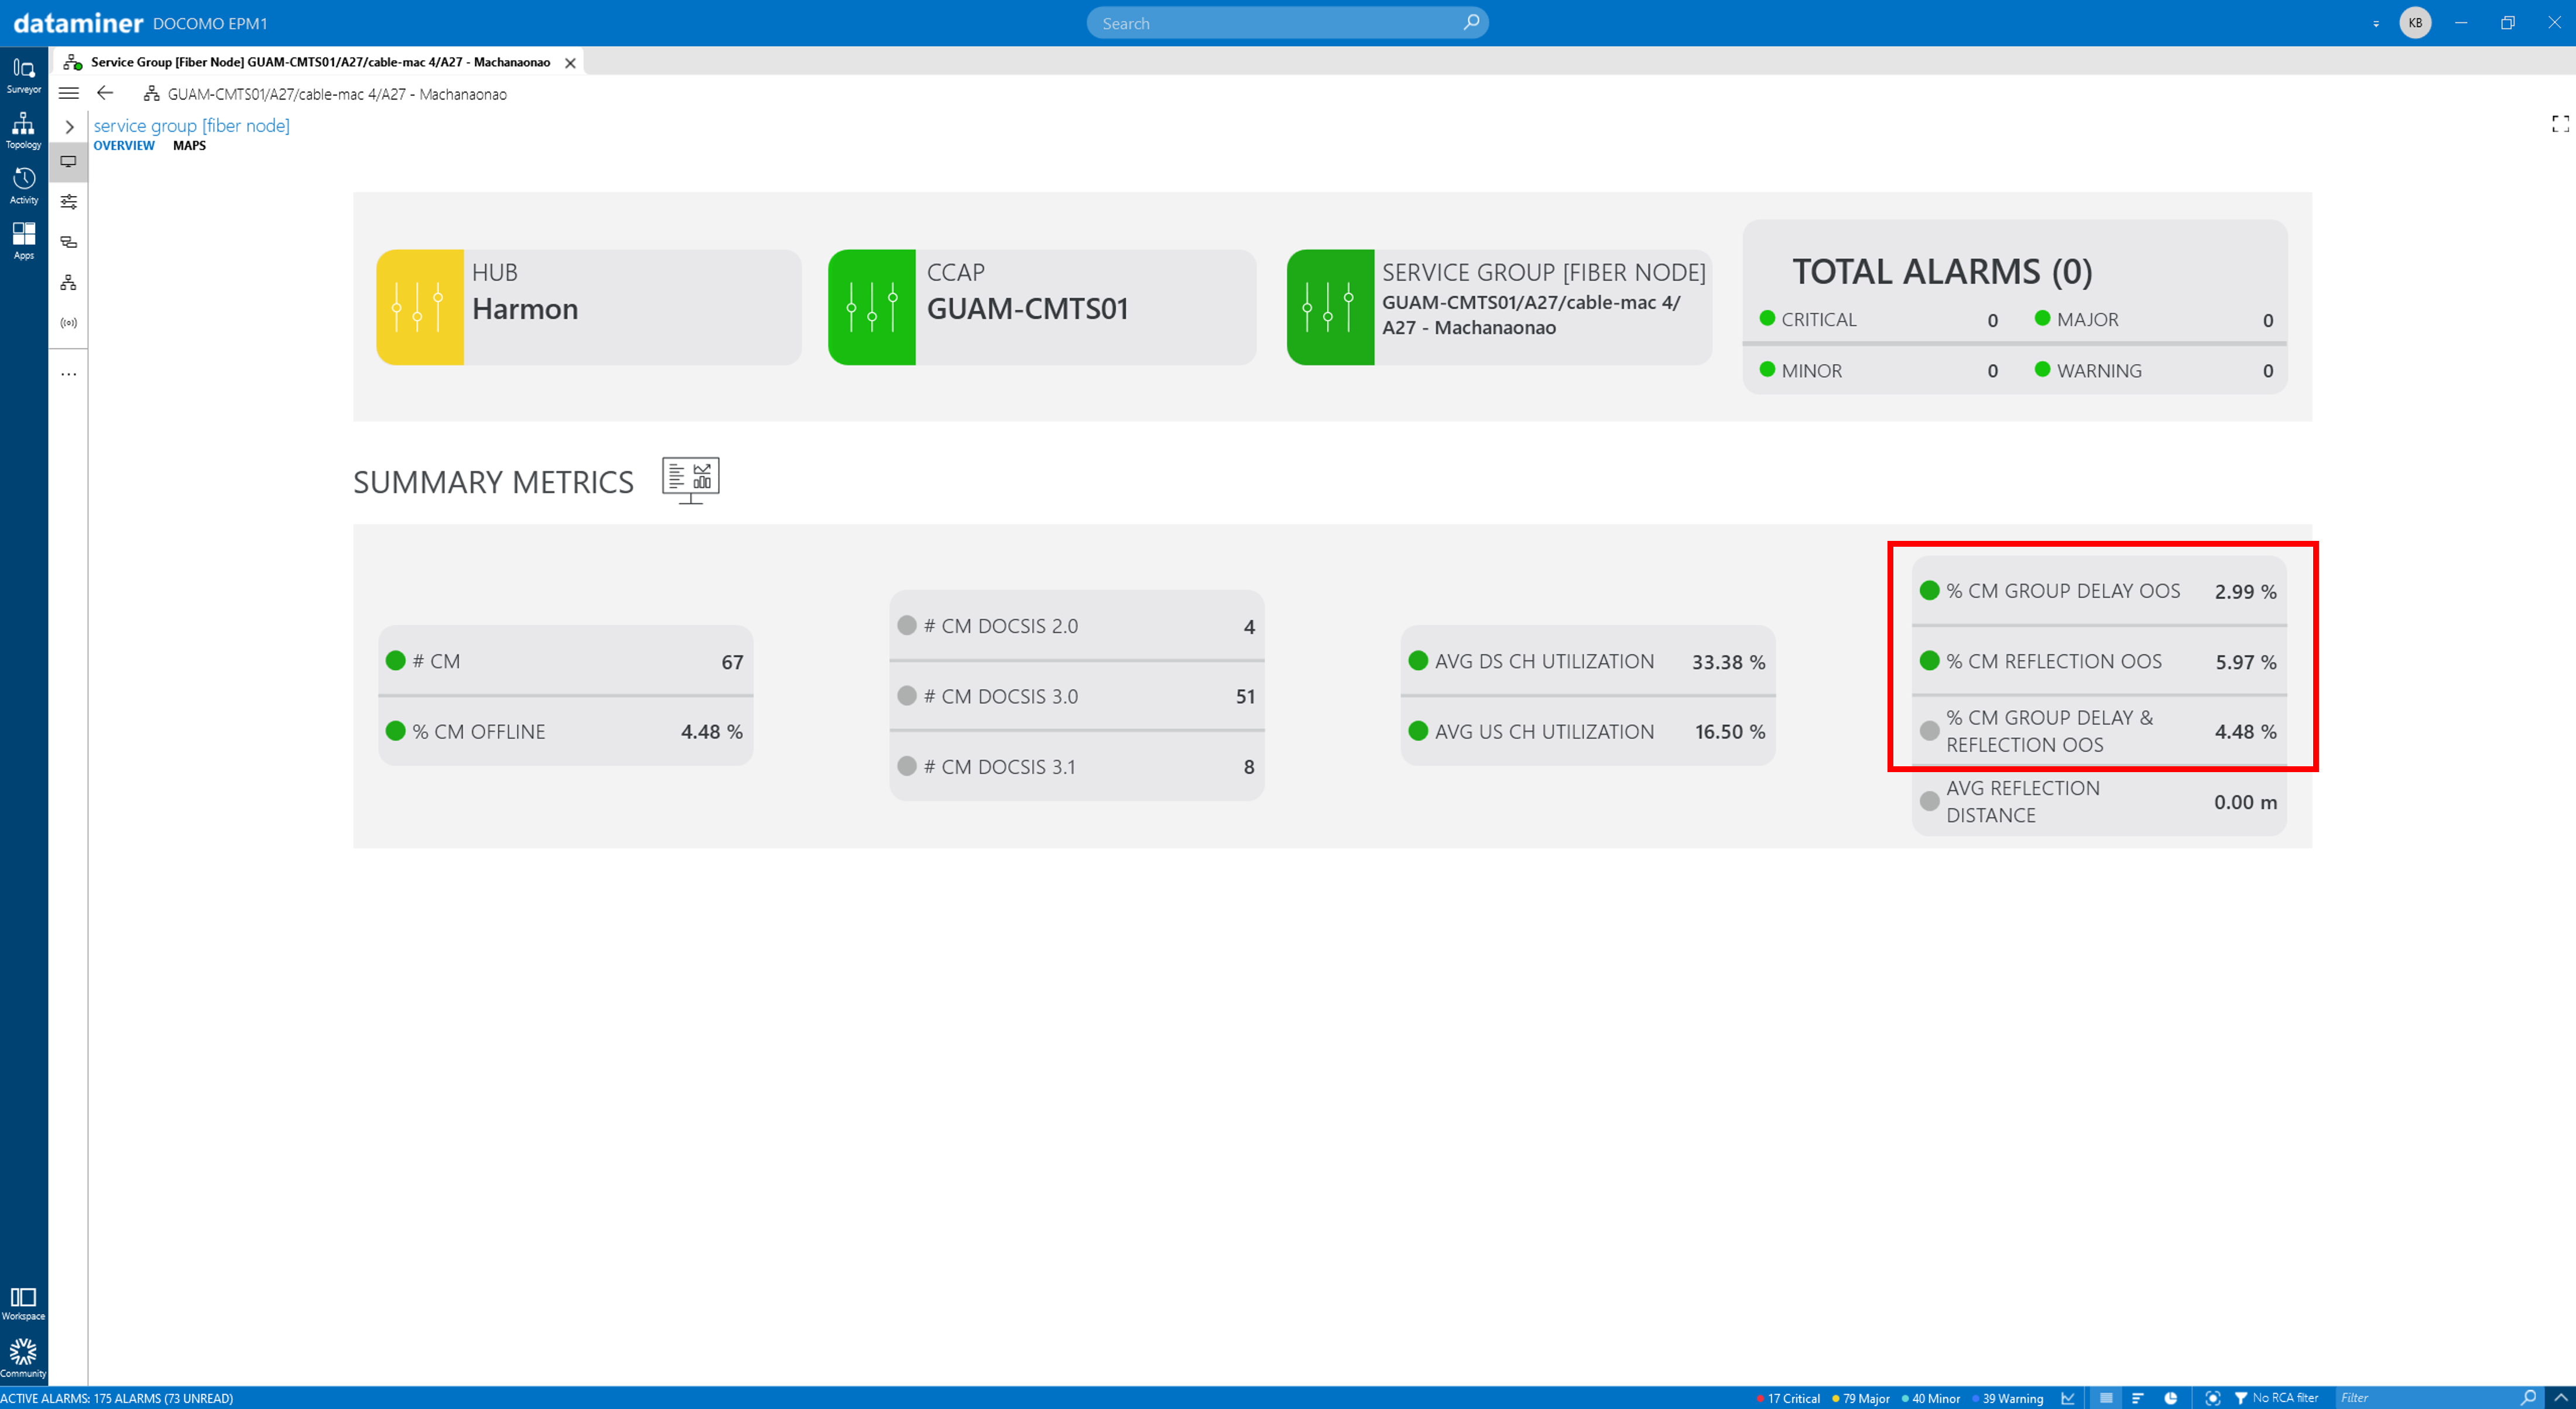 At the network segment level, you will find an indication of the percentage of modems that are affected by group delay, reflection or both.
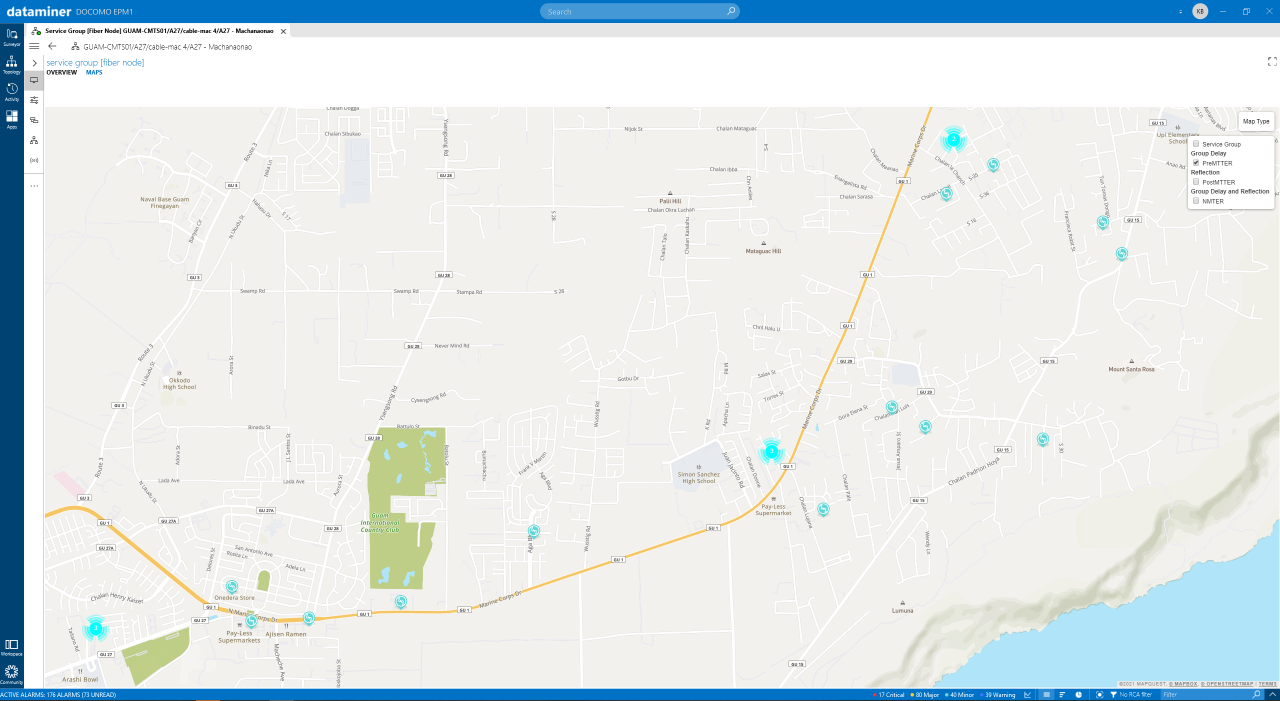
The modems can be visualized on a map of the relevant area. Filters allow you to visualize only modems that are affected by group delay, reflection or either of these. In this image, only modems affected by group delay are shown. When multiple modems are so close to each other that they cannot all be shown at the current zoom level, they are clustered under one marker that indicates how many modems are present in that area.
At the network segment level, you will find an indication of the percentage of modems that are affected by group delay, reflection or both.
The modems can be visualized on a map of the relevant area. Filters allow you to visualize only modems that are affected by group delay, reflection or either of these. In this image, only modems affected by group delay are shown. When multiple modems are so close to each other that they cannot all be shown at the current zoom level, they are clustered under one marker that indicates how many modems are present in that area.
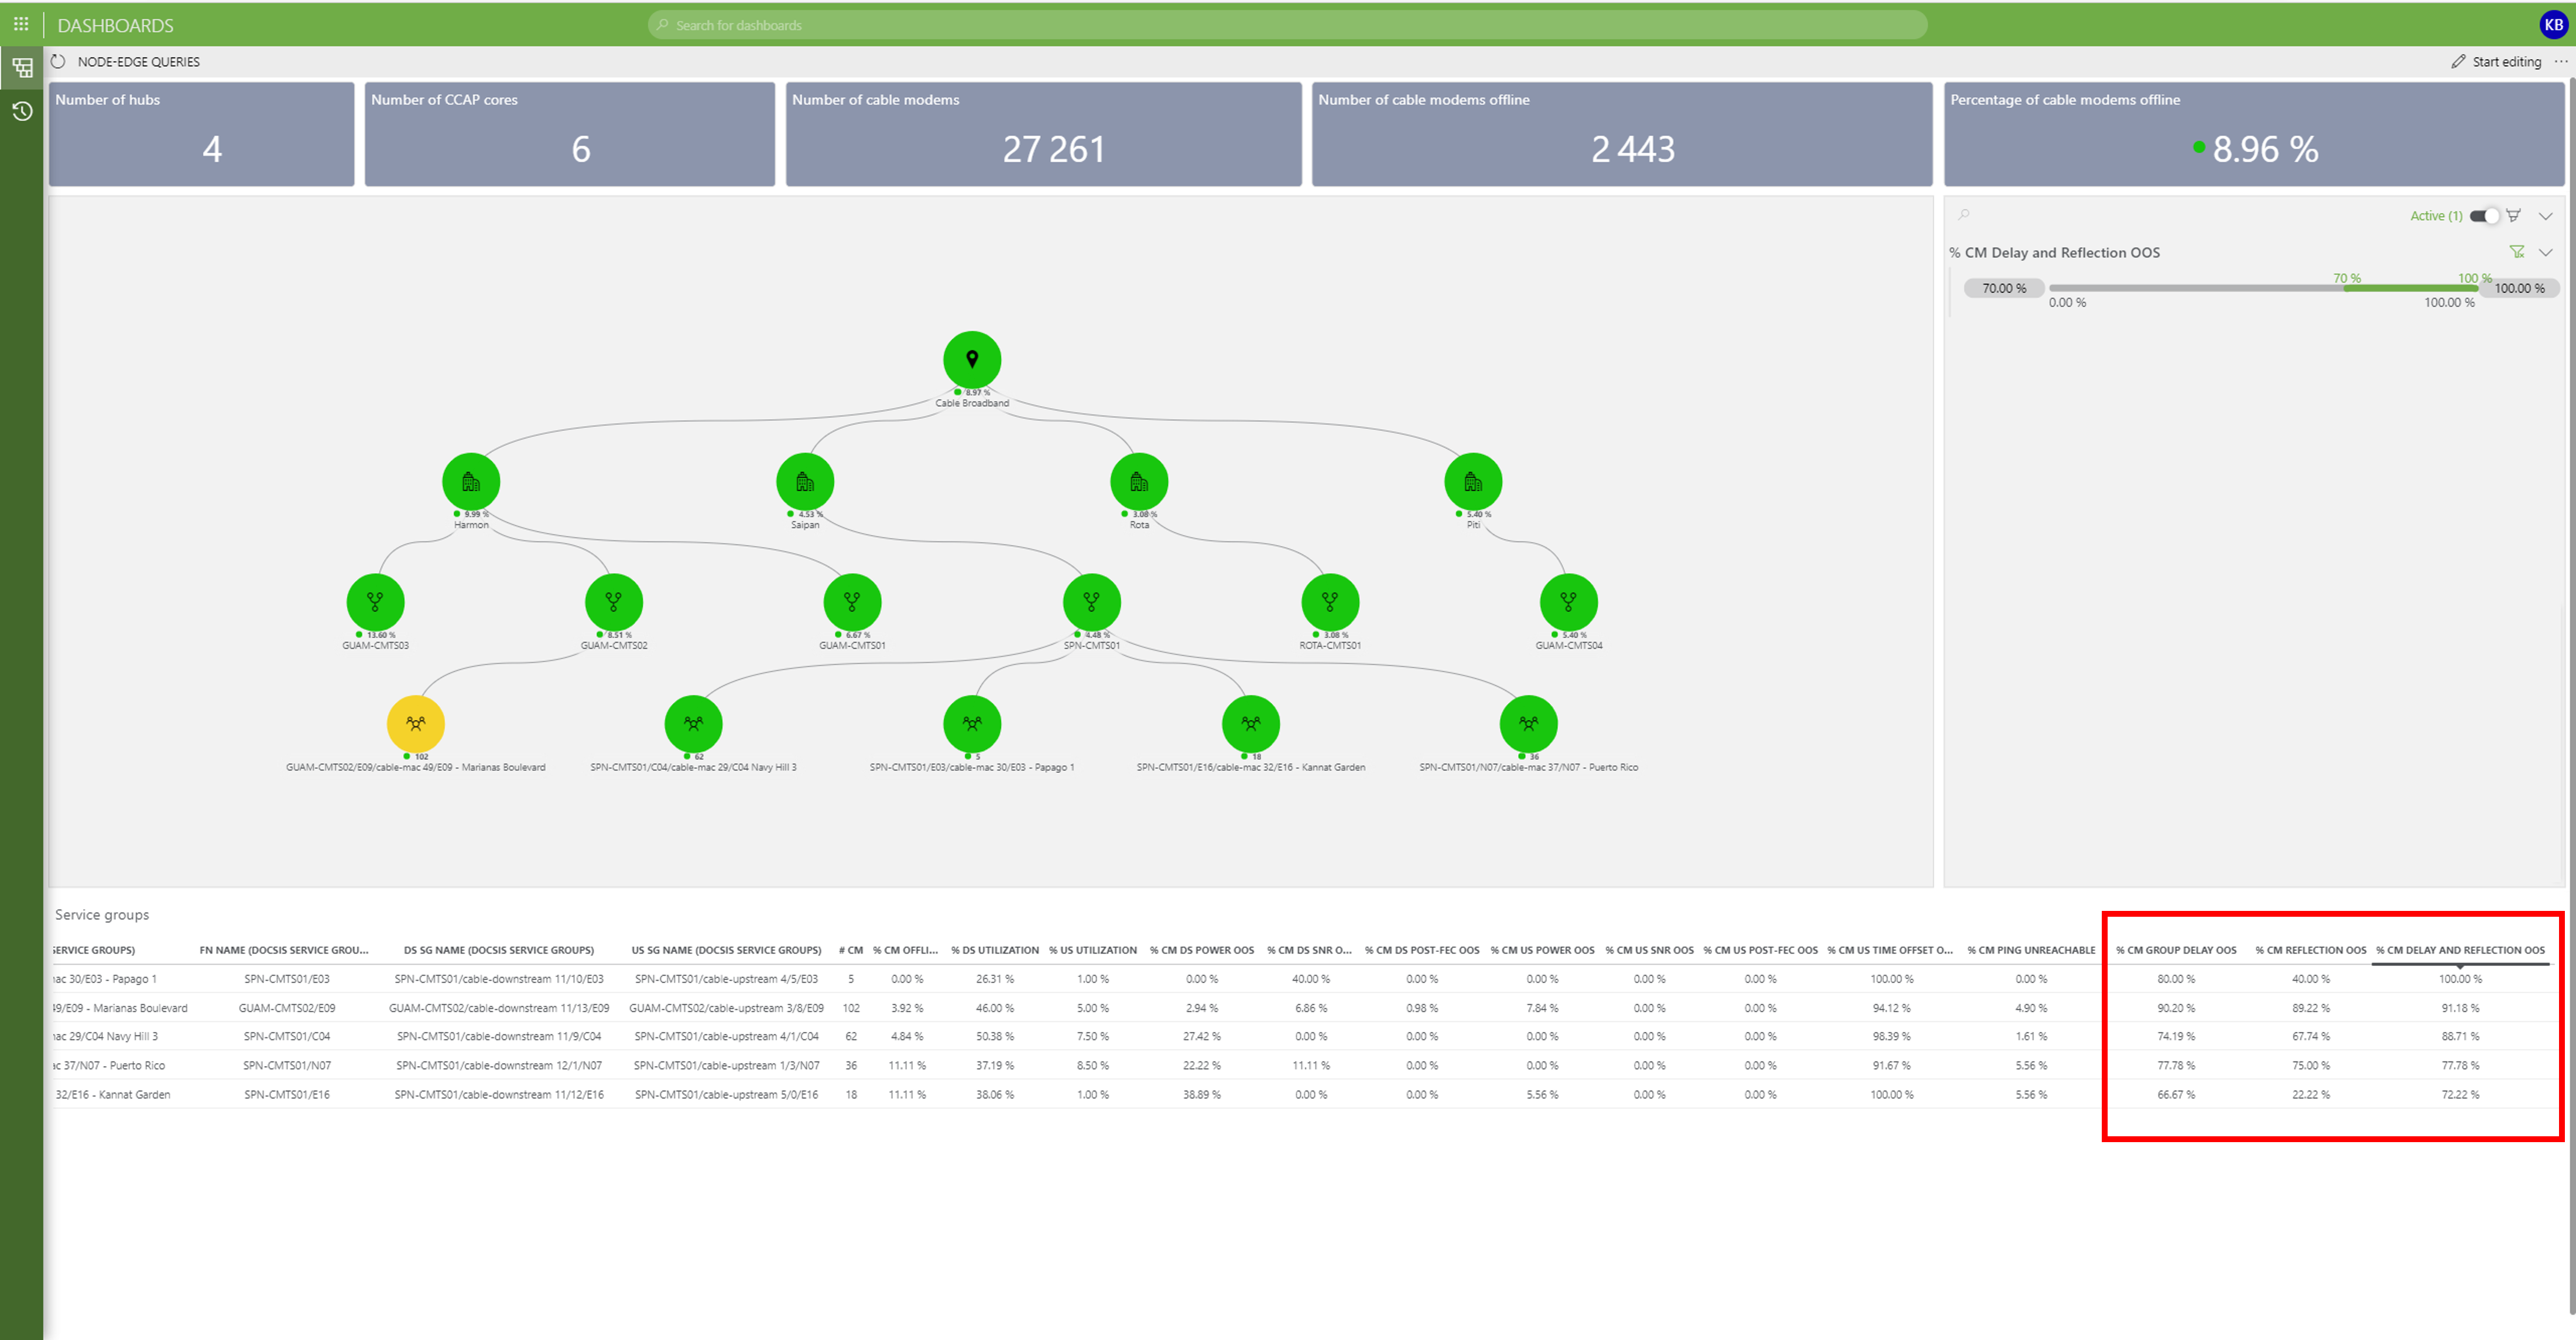 In a dashboard, we use a node-edge query to provide an overview of candidate segments for proactive network maintenance based on the reported percentage of modems affected by group delay and reflection. Here we are using a query for segments where more than 70% of the modems are affected by group delay and reflection. This returns five segments, associated with two core systems/hub sites.
At the bottom of the screen, full identification information for the segments is shown, as well as detailed information on the actual impact for each of these and a lot more. This overview is sorted to start with the segment with the largest impact, which is therefore most likely to be prioritized for proactive network maintenance.
The energy thresholds that are used to flag whether modems are affected by group delay or reflection can be fully adjusted. The percentage within a service segment that will be used for the query can easily be adjusted in the dashboard. This way, the setup can be continuously updated based on the resources available for this activity and the conditions of the outside plant itself (e.g. lower power thresholds can be used when necessary).
In a dashboard, we use a node-edge query to provide an overview of candidate segments for proactive network maintenance based on the reported percentage of modems affected by group delay and reflection. Here we are using a query for segments where more than 70% of the modems are affected by group delay and reflection. This returns five segments, associated with two core systems/hub sites.
At the bottom of the screen, full identification information for the segments is shown, as well as detailed information on the actual impact for each of these and a lot more. This overview is sorted to start with the segment with the largest impact, which is therefore most likely to be prioritized for proactive network maintenance.
The energy thresholds that are used to flag whether modems are affected by group delay or reflection can be fully adjusted. The percentage within a service segment that will be used for the query can easily be adjusted in the dashboard. This way, the setup can be continuously updated based on the resources available for this activity and the conditions of the outside plant itself (e.g. lower power thresholds can be used when necessary).