solution Use Case
L-Band Spectrum Monitoring
Satellite Downlink
ETL
Nevion
Rohde&Schwarz
This use case demonstrates how DataMiner can be used for L-band spectrum monitoring at a broadcaster operating a satellite downlink of any size together with automated and manual IRD control.
USE CASE DETAILS
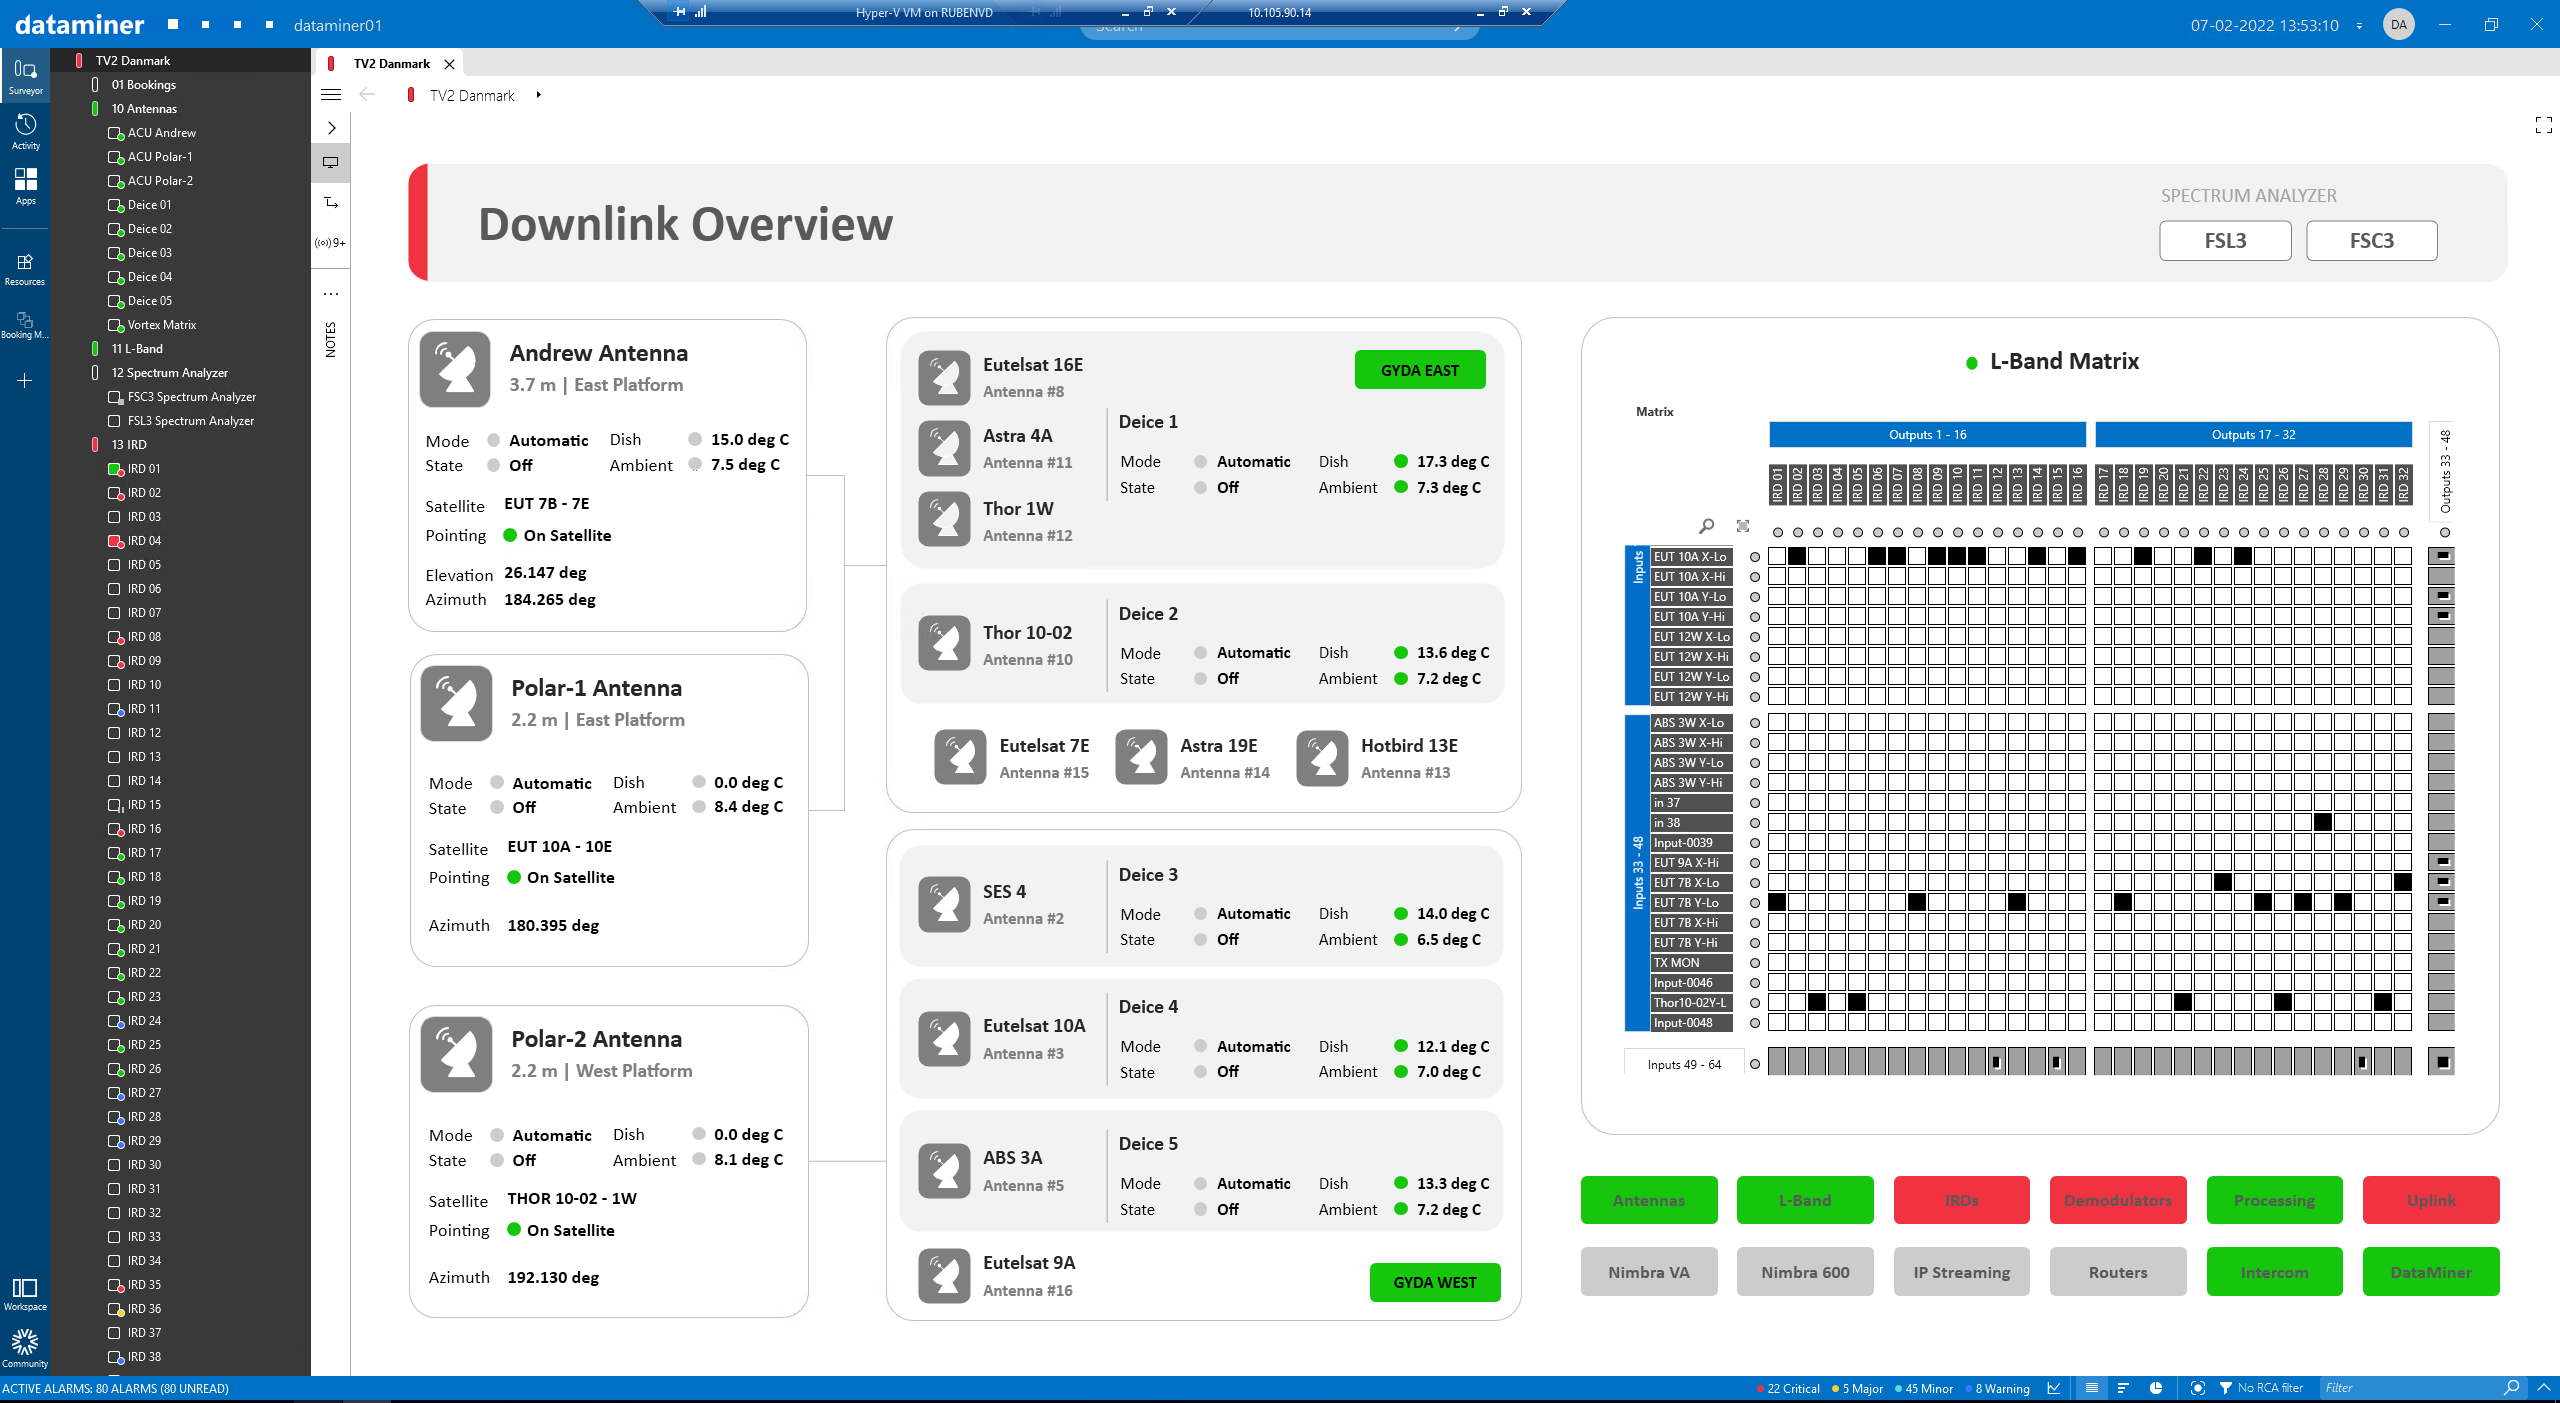
On the left, this downlink overview shows the different antennas feeding signals into the matrix. The antennas are grouped by orientation and type (east/west/steerable). On the right, the overview shows the L-band matrix that connects with the dish farm over an optical link. The incoming satellite signals are listed in the column on the left, and IRDs and demodulators are shown at the top of the matrix, so that cross points can be set to feed the appropriate L-band signals to the IRDs and demodulators. Underneath the matrix, a series of status indicators shows the status of the different components in this setup, both upstream (antennas, L-band fiber transport) and downstream from the matrix element (IRDs, demodulators, decoders, network and uplink elements).
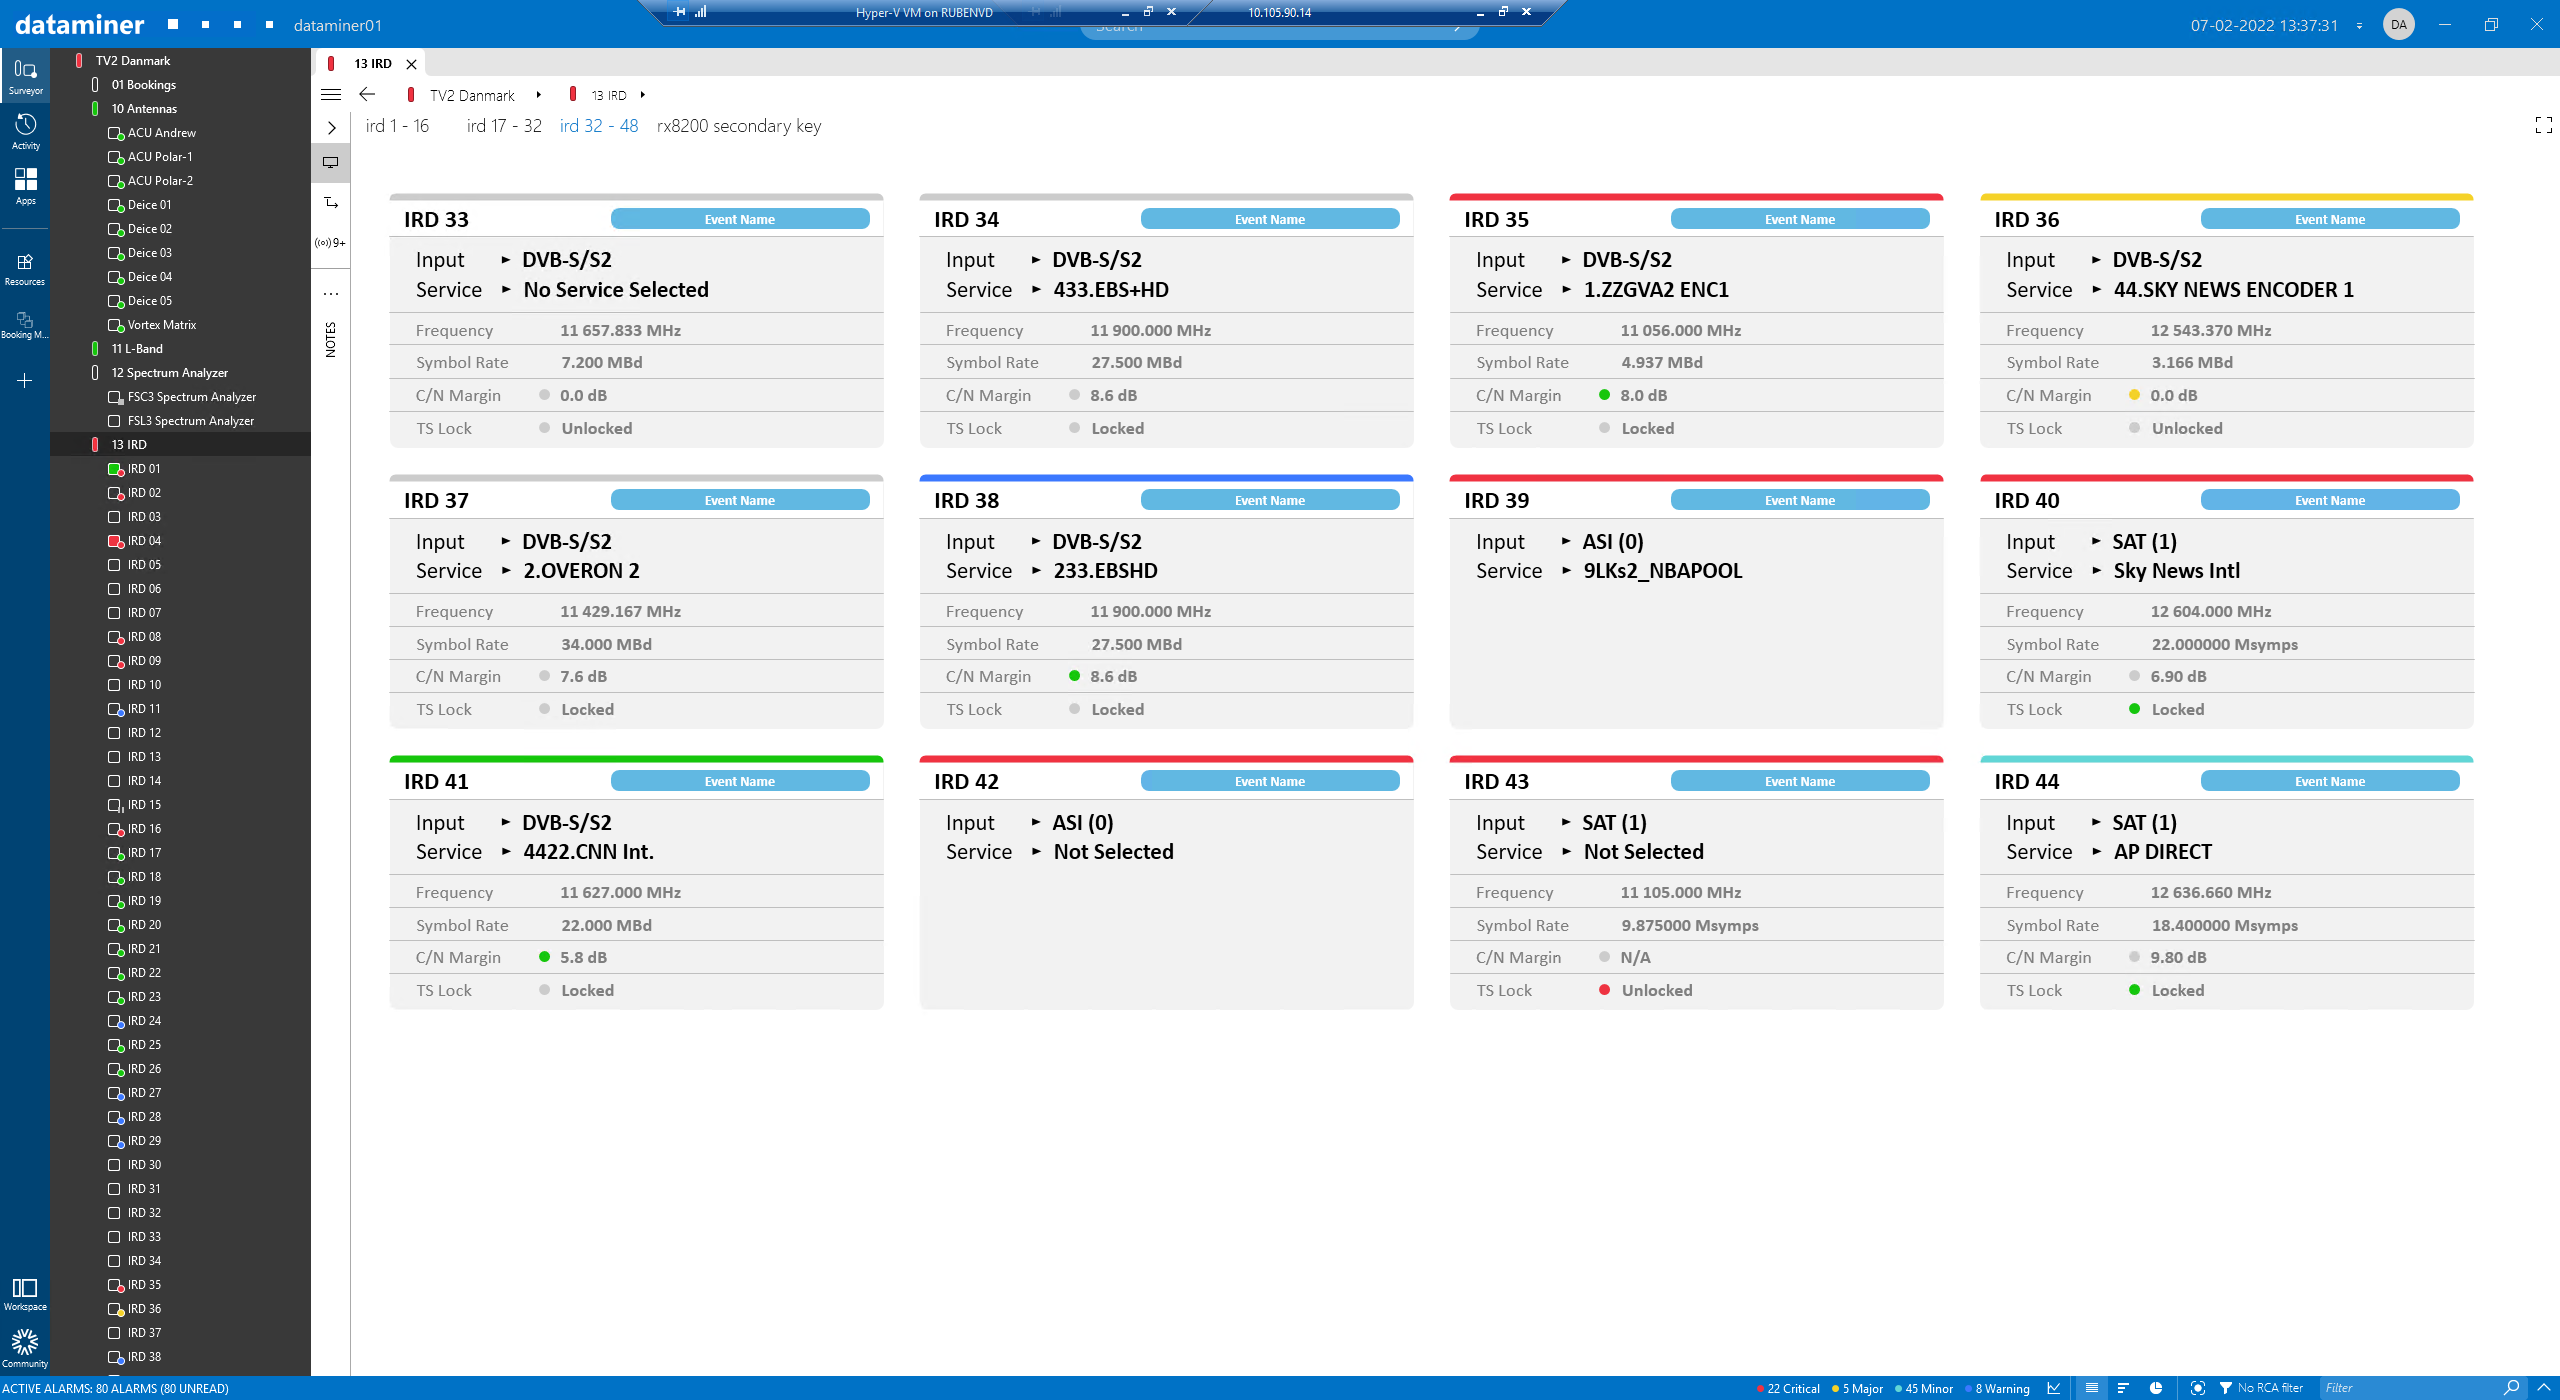 This is an example of the IRD overview page, showing the type of input, the service reference and the status for each IRD. If a service is associated with a specific event, you can add that event name as a label.
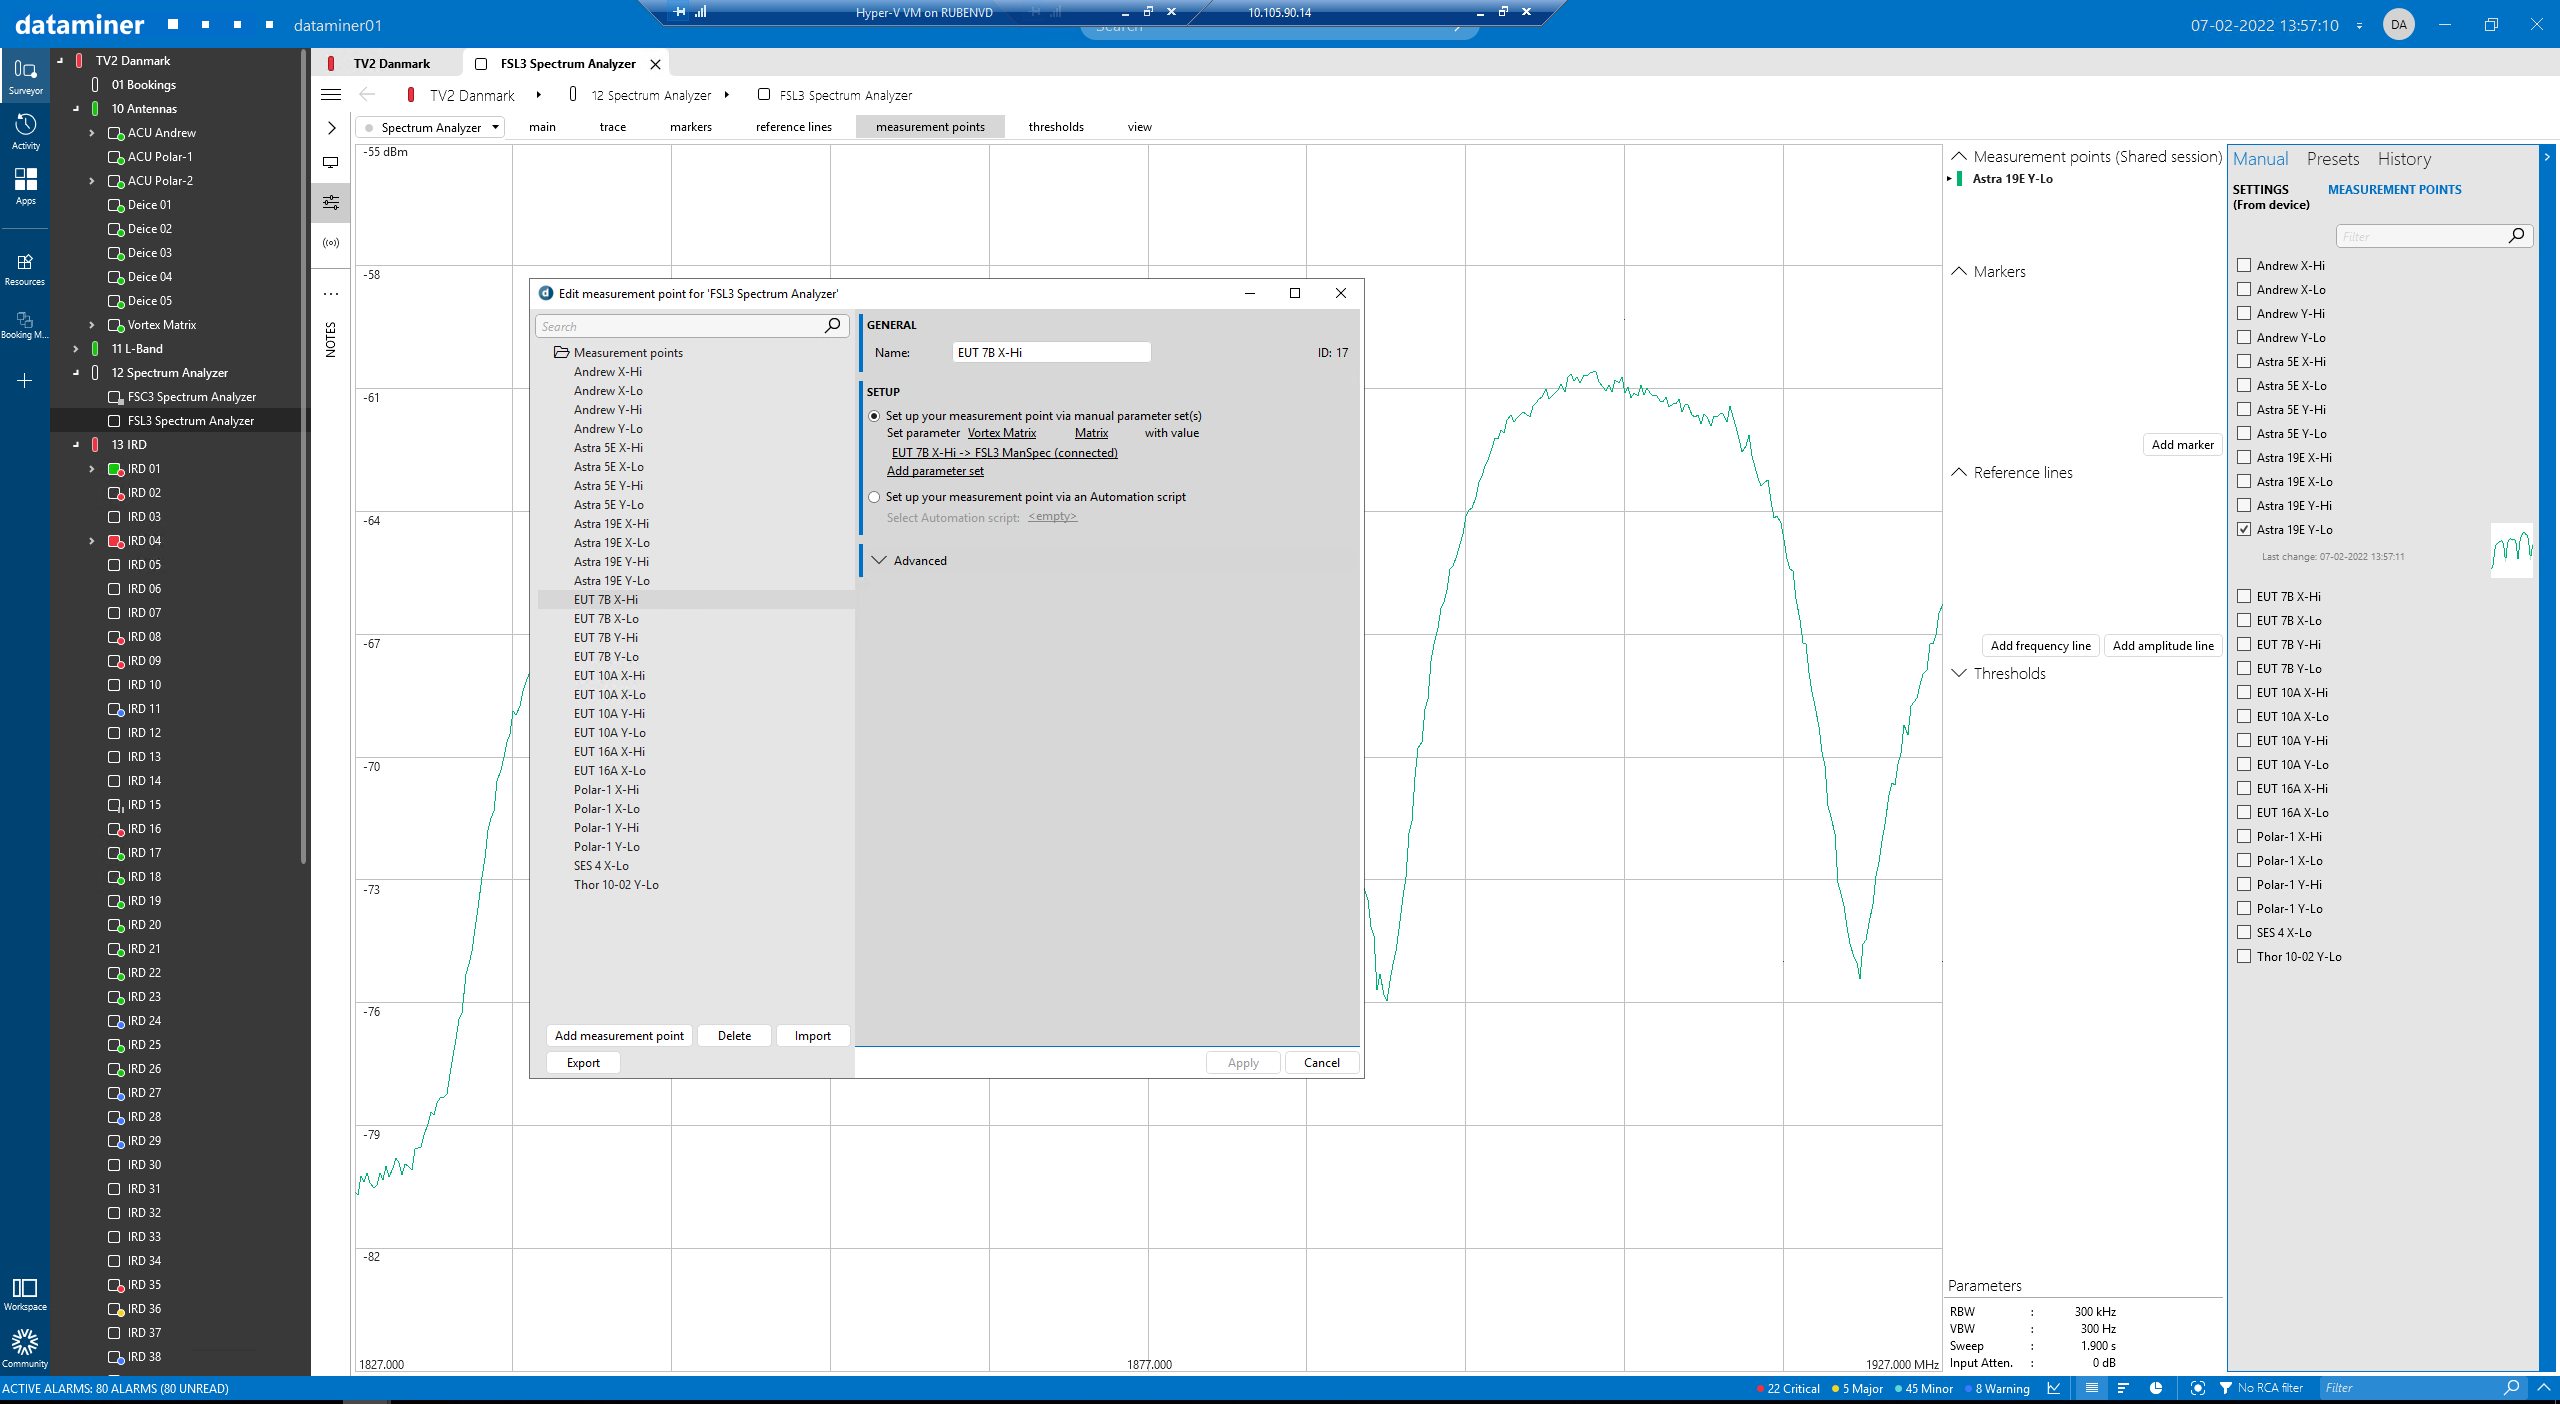 Here you can see the user interface where you can define and edit the measurement points that will be used by the automated spectrum analyzer component, which operates in the background to support the automatic visualization of the L-band trace when an IRD and demodulator element are selected.
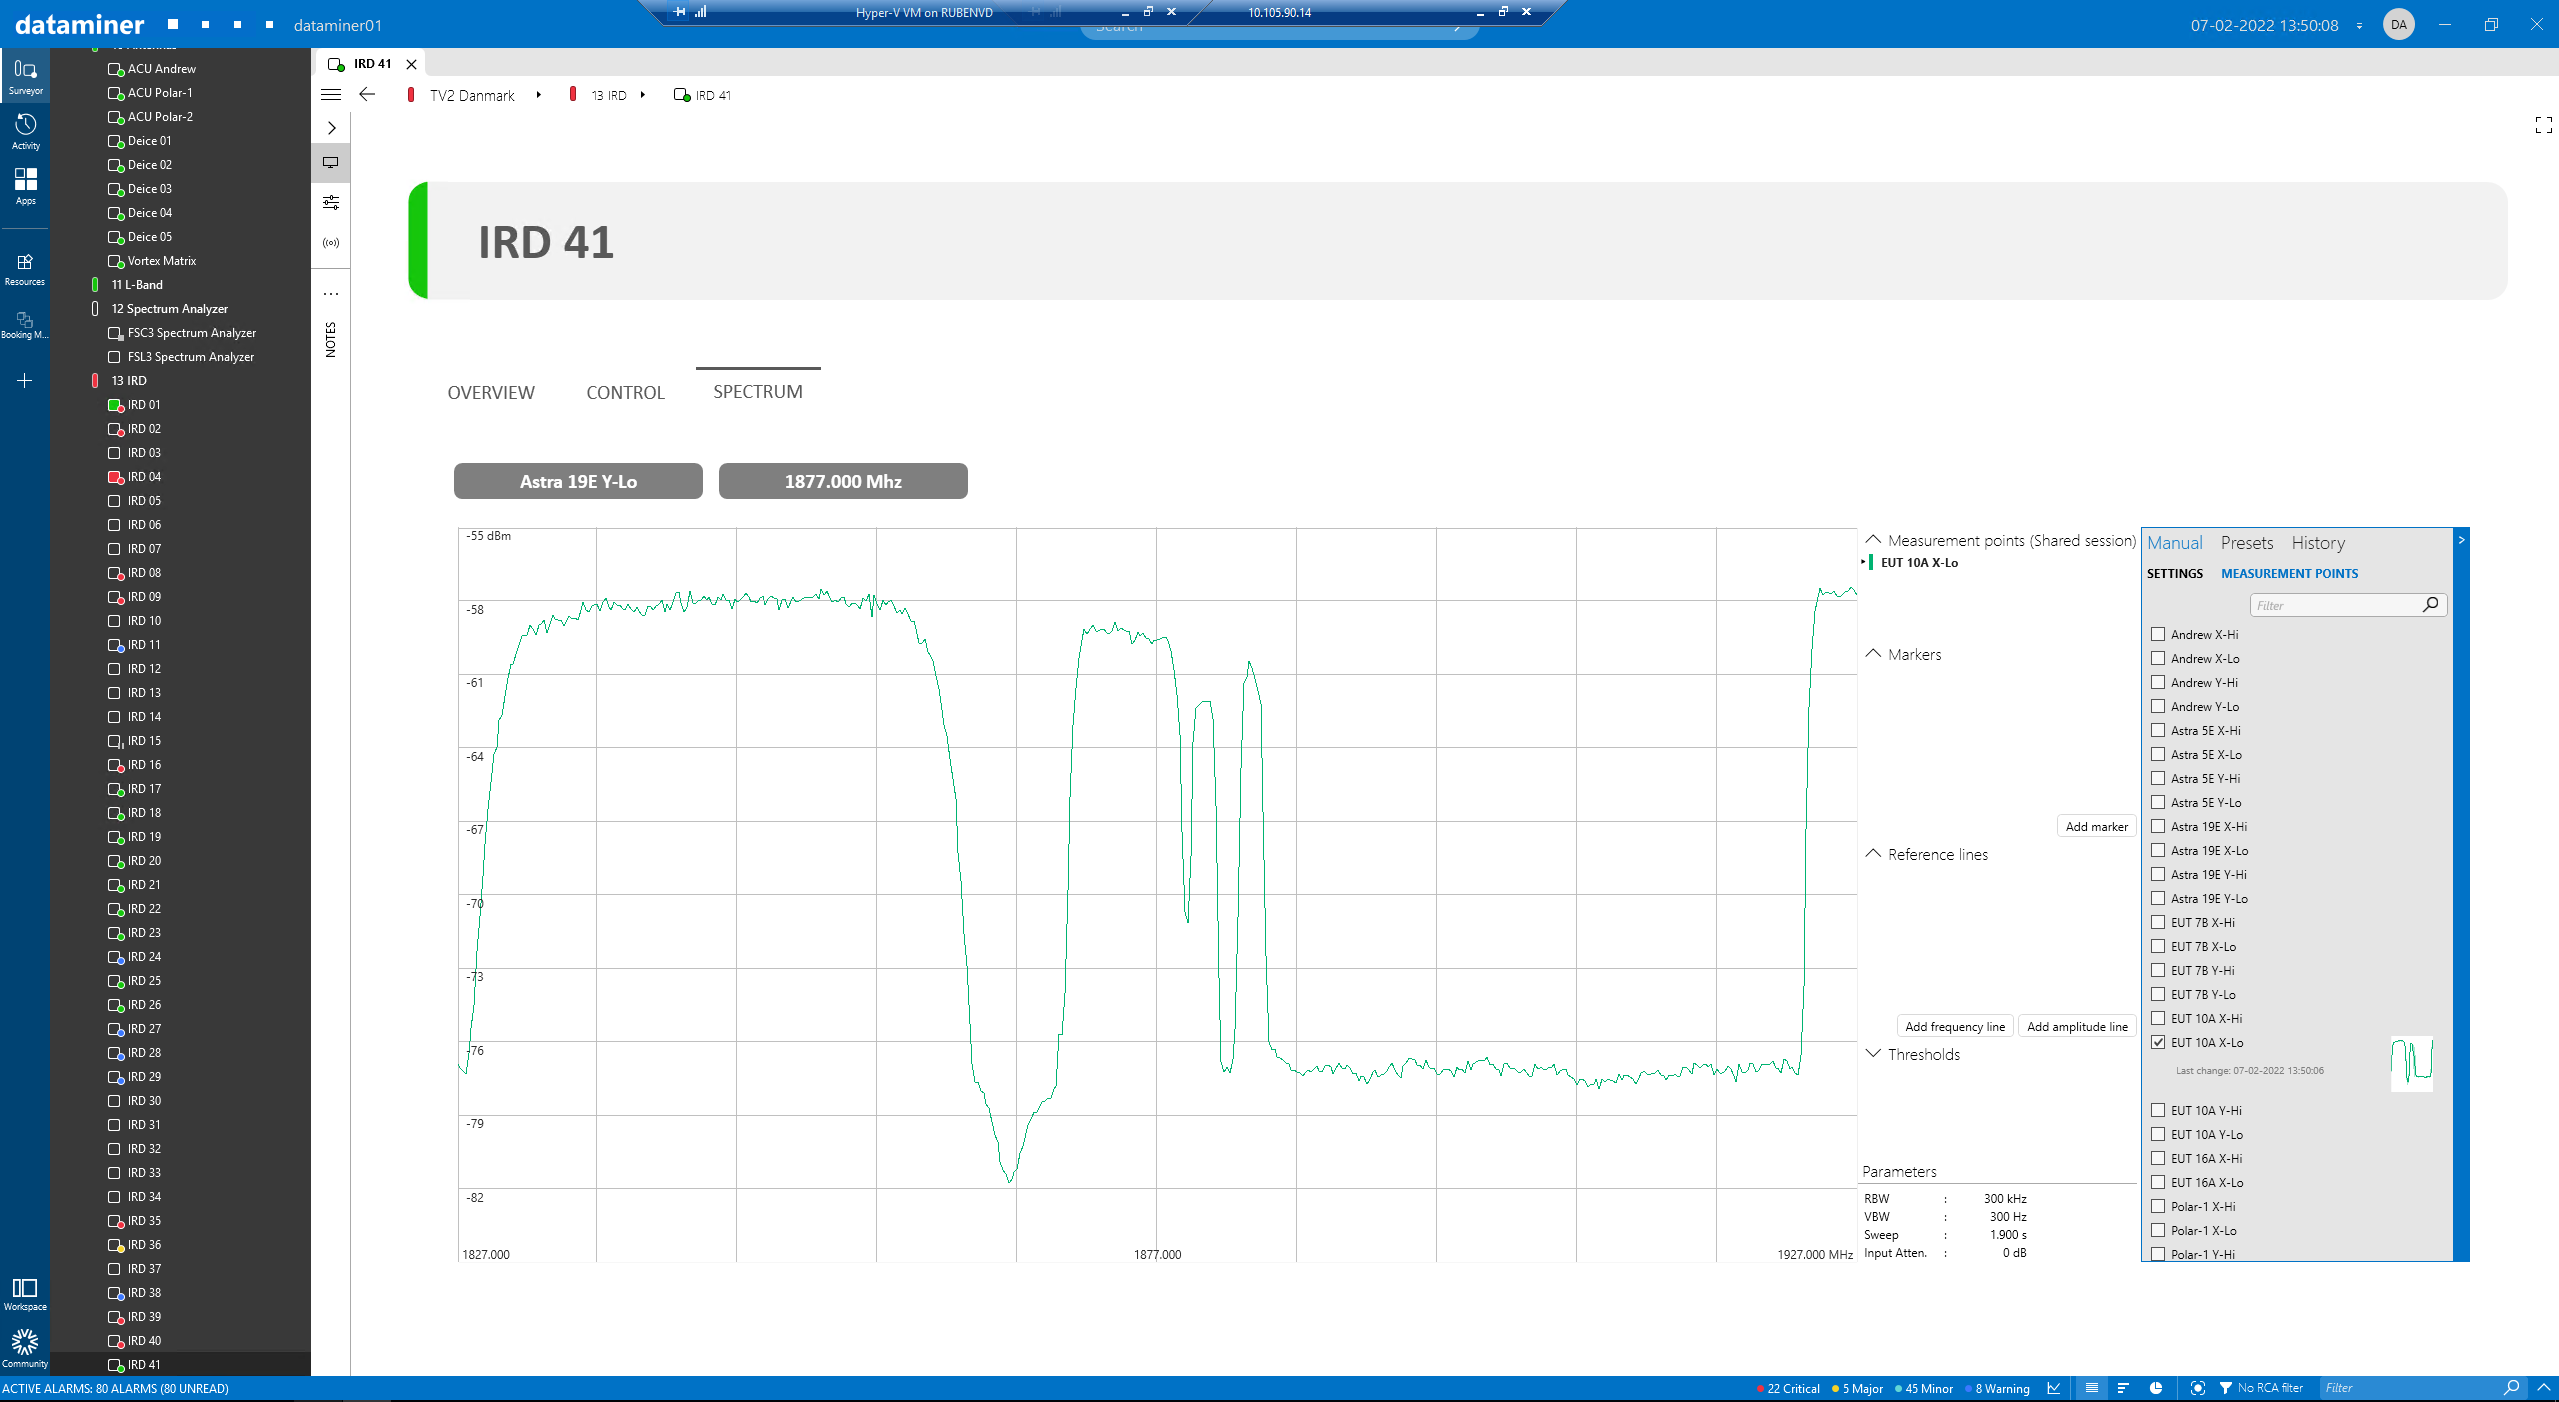 This is an example of the L-band spectrum trace, in this case for IRD 41. This trace is shown as soon as the operator accesses the element. This is achieved using an Automation script that launches automatically when the visual overview is opened. This script will return both the measurement point and the L-band frequency required to feed the spectrum measurement component, and it will make sure that the trace is correctly scaled and centered.
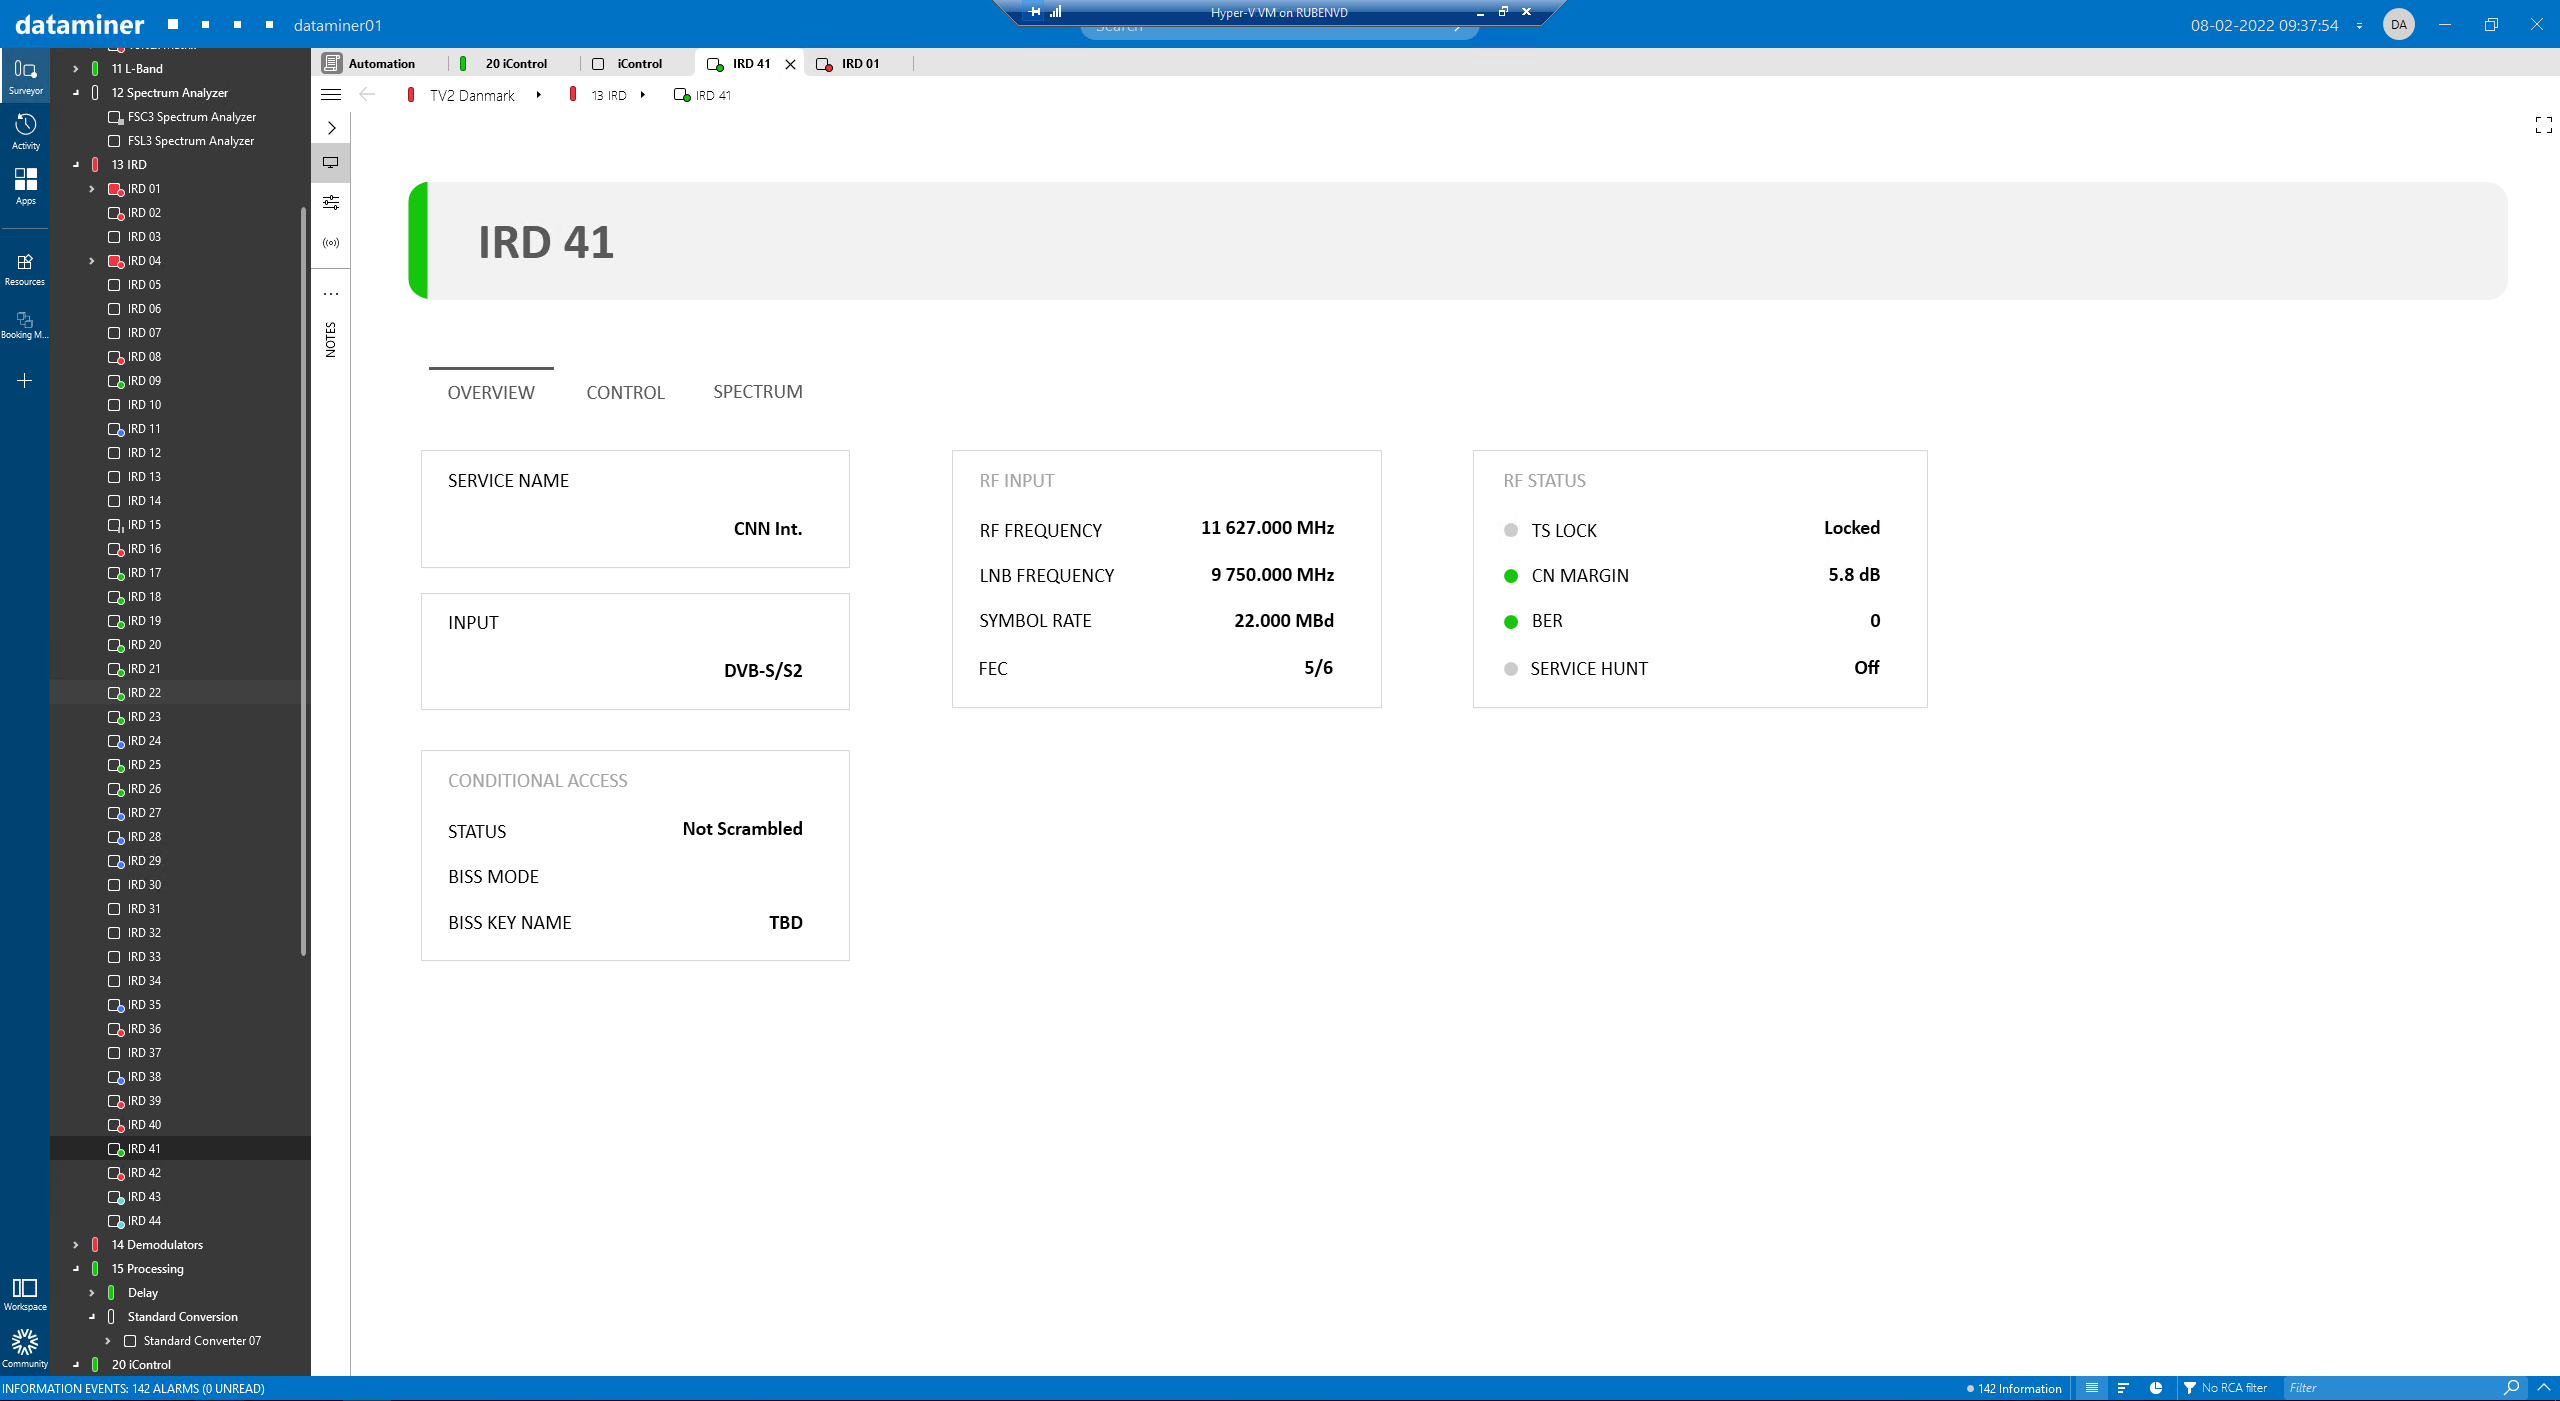 On the IRD overview page, you can find information related to the service, type of signal, RF and LNB frequencies, status and conditional access. The difference between the RF frequency and LNB frequency gives us the L-band center carrier frequency used to center the spectrum trace shown above.
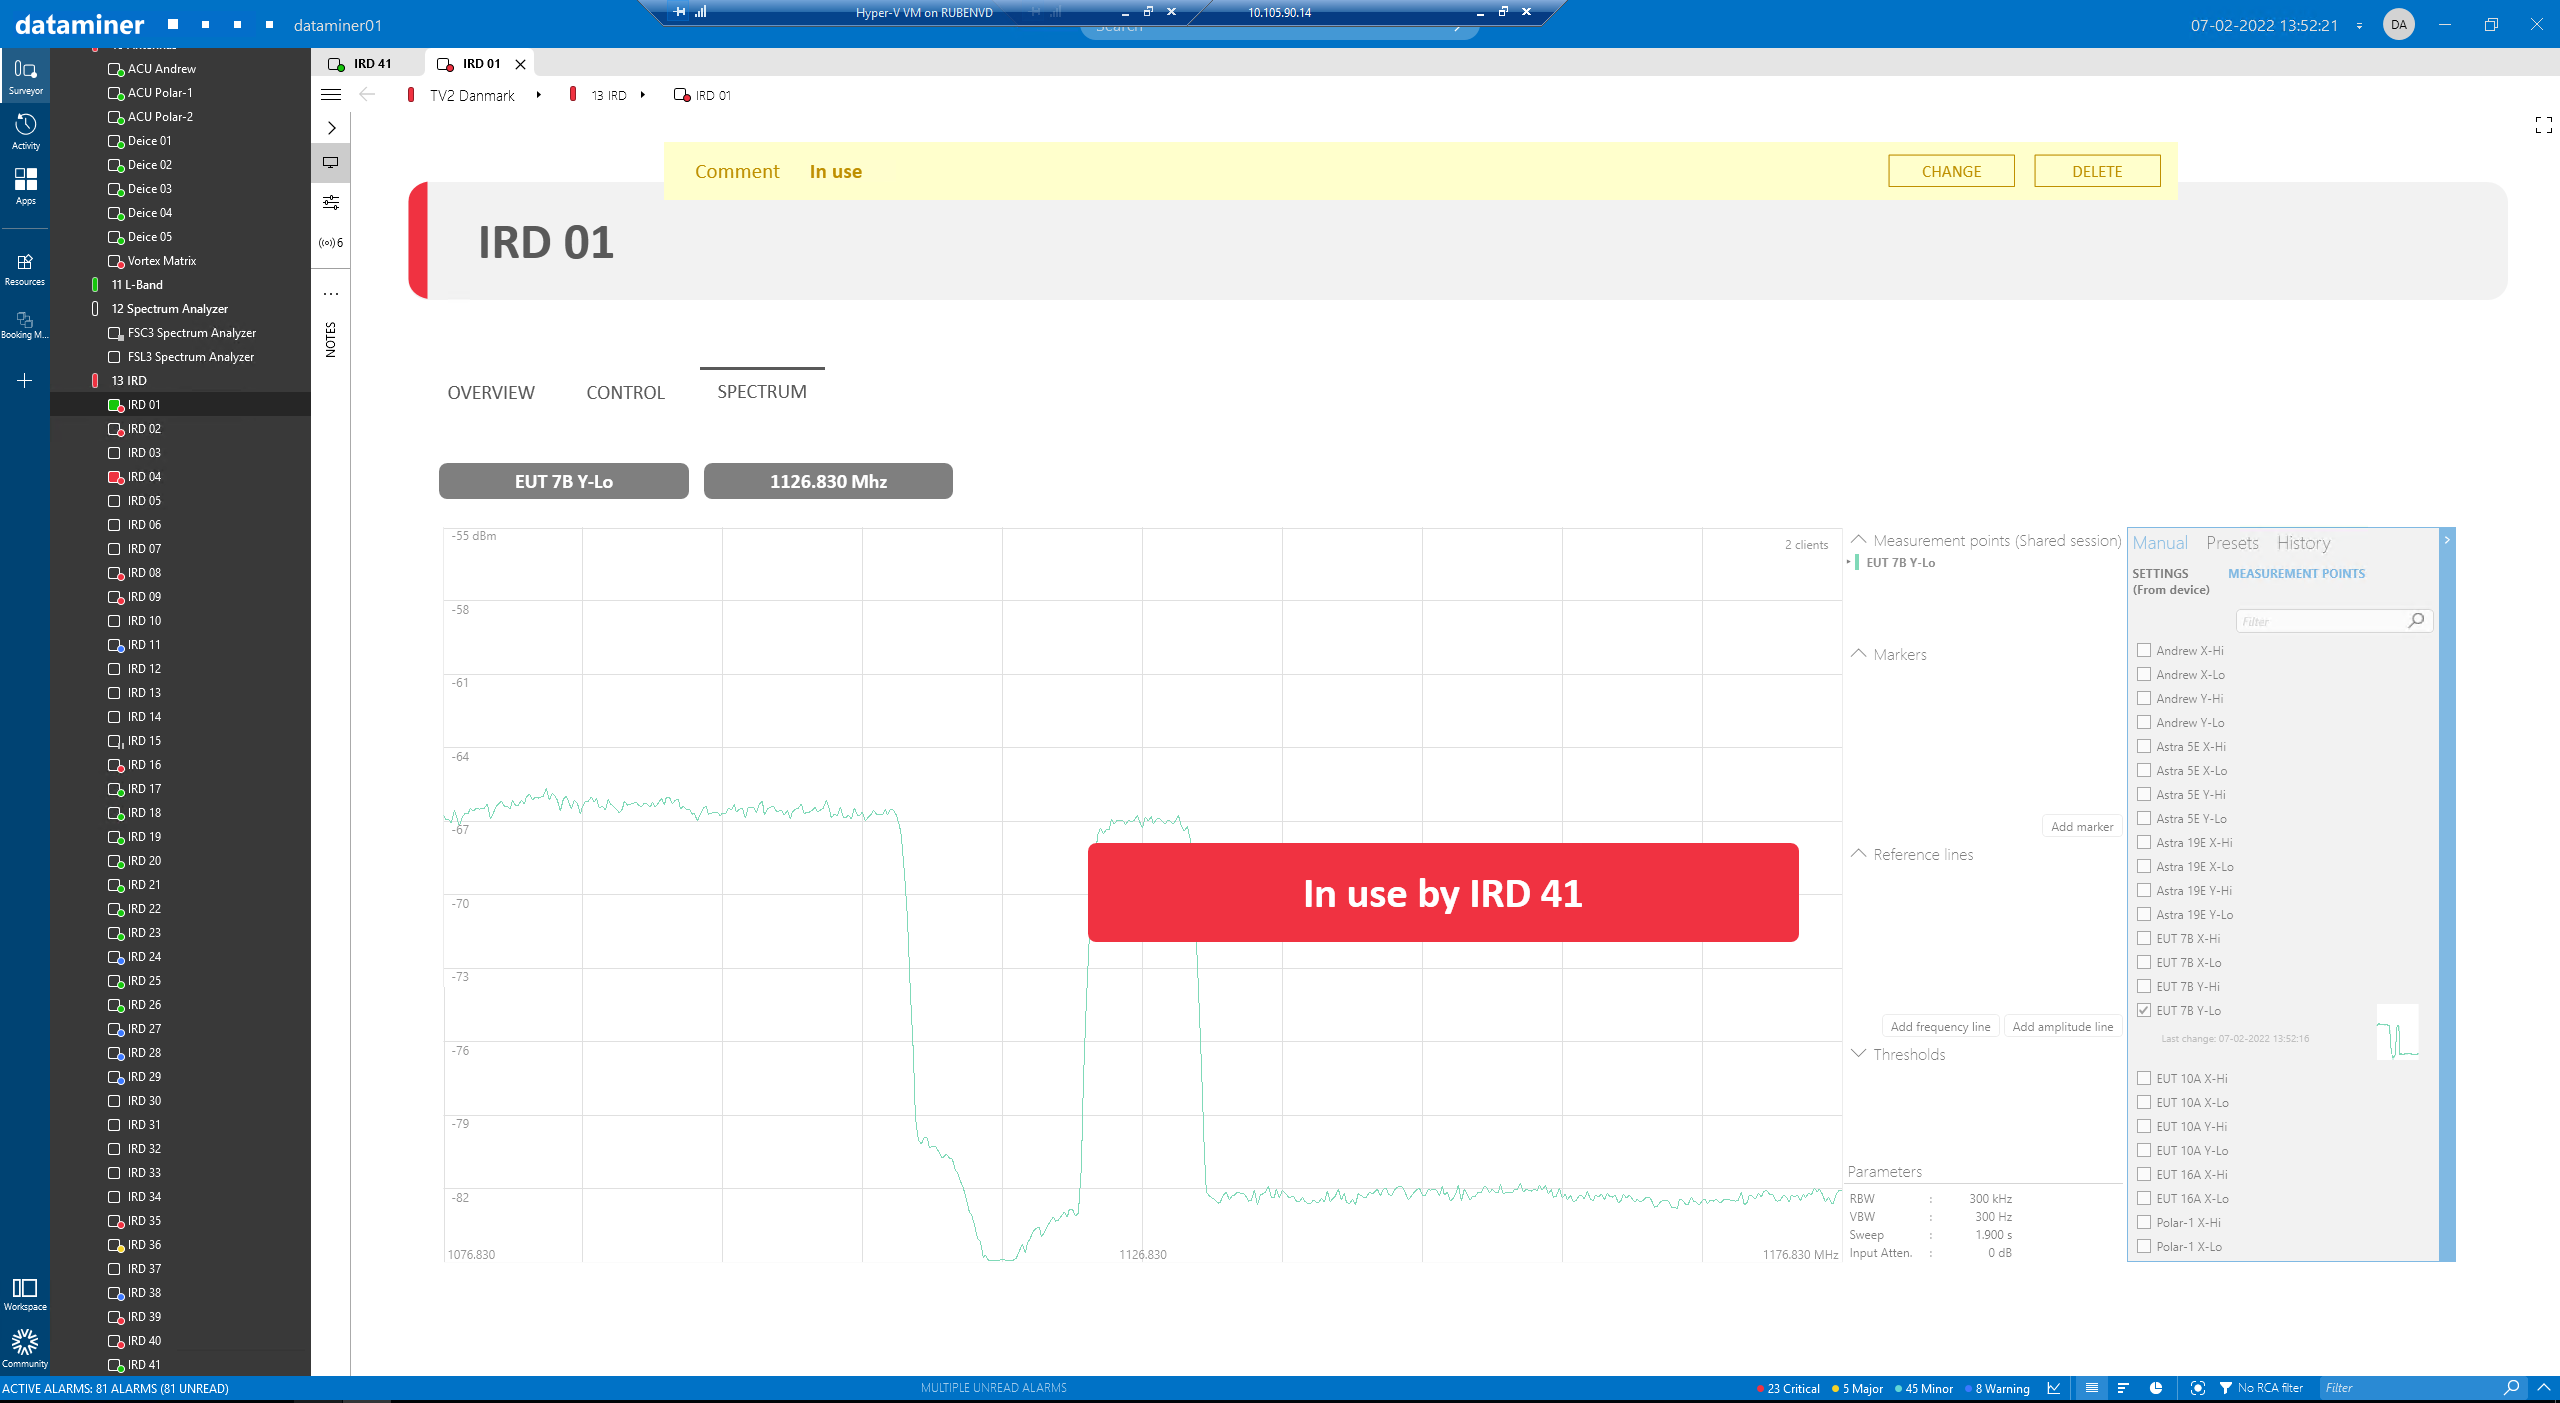 Because the spectrum analyzer acts as a shared resource in this setup, when a new IRD element is opened, it will automatically take control of the spectrum analyzer, and the IRD element that was previously connected will show an “In use by…” message.
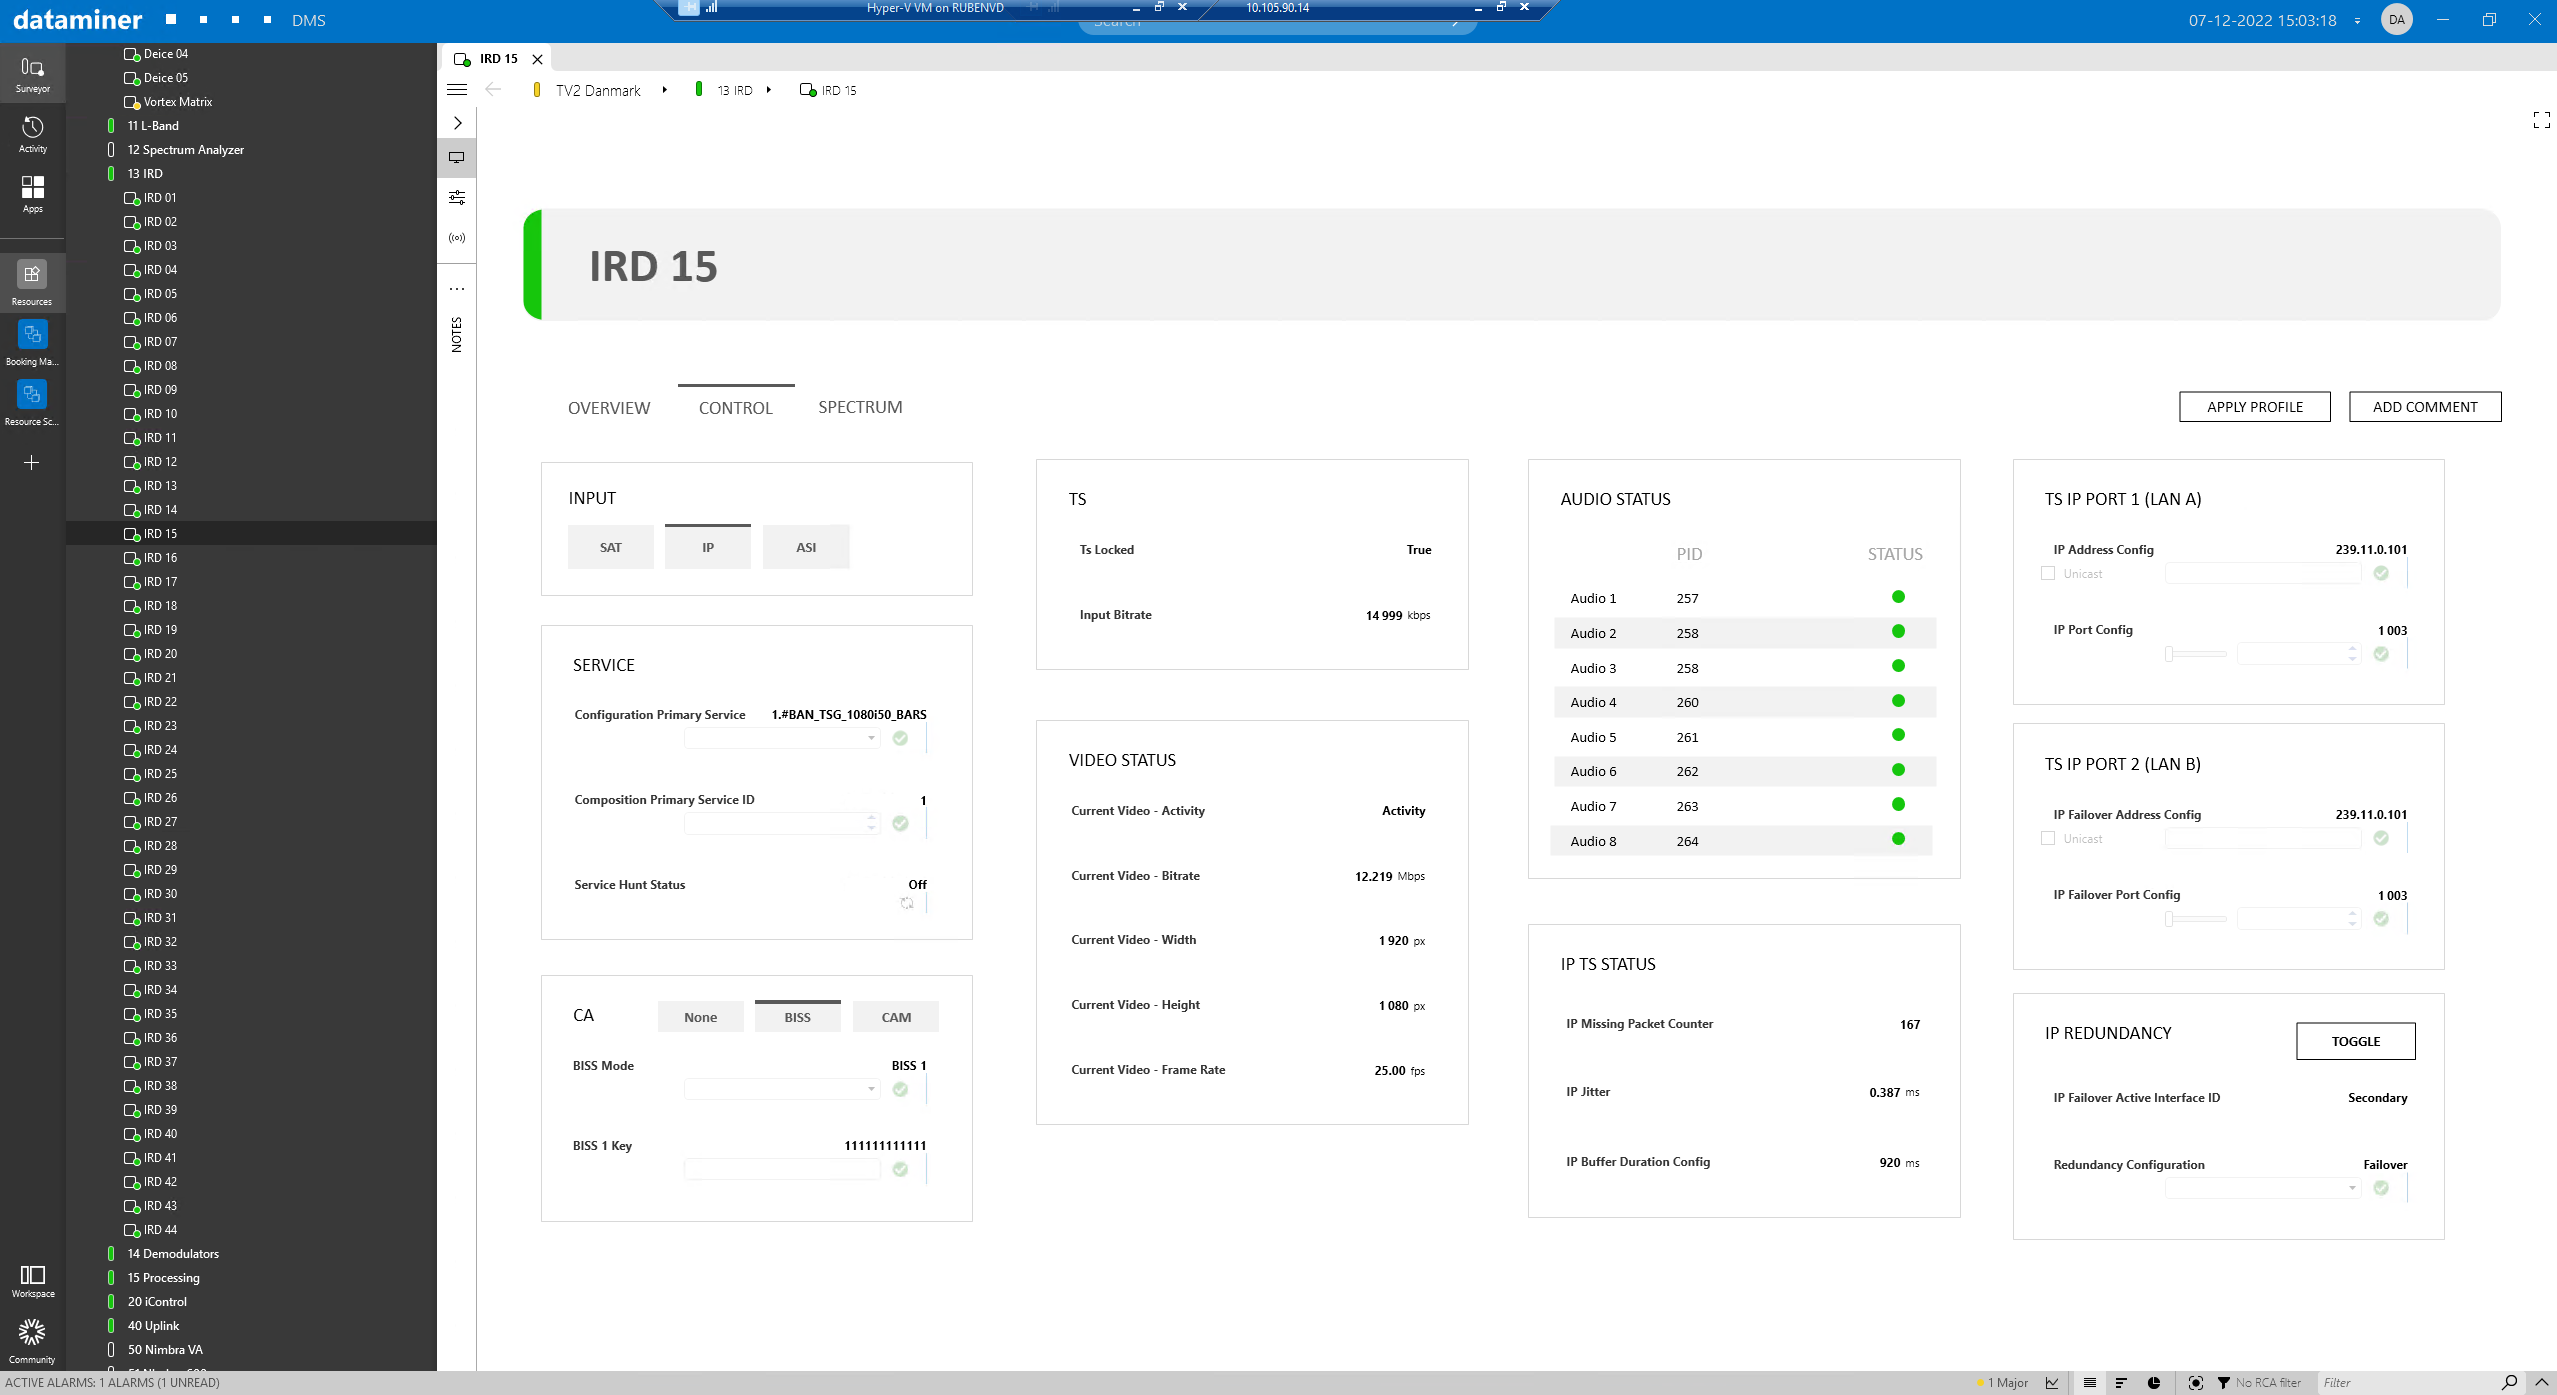 The next two screenshots are showing the control surfaces for IRDs. First pick an input and then get the most important parameters & KPIS together with all controls for that input. For example, select the MPTS, the service-ID and also configure the outgoing multicast-IPs.
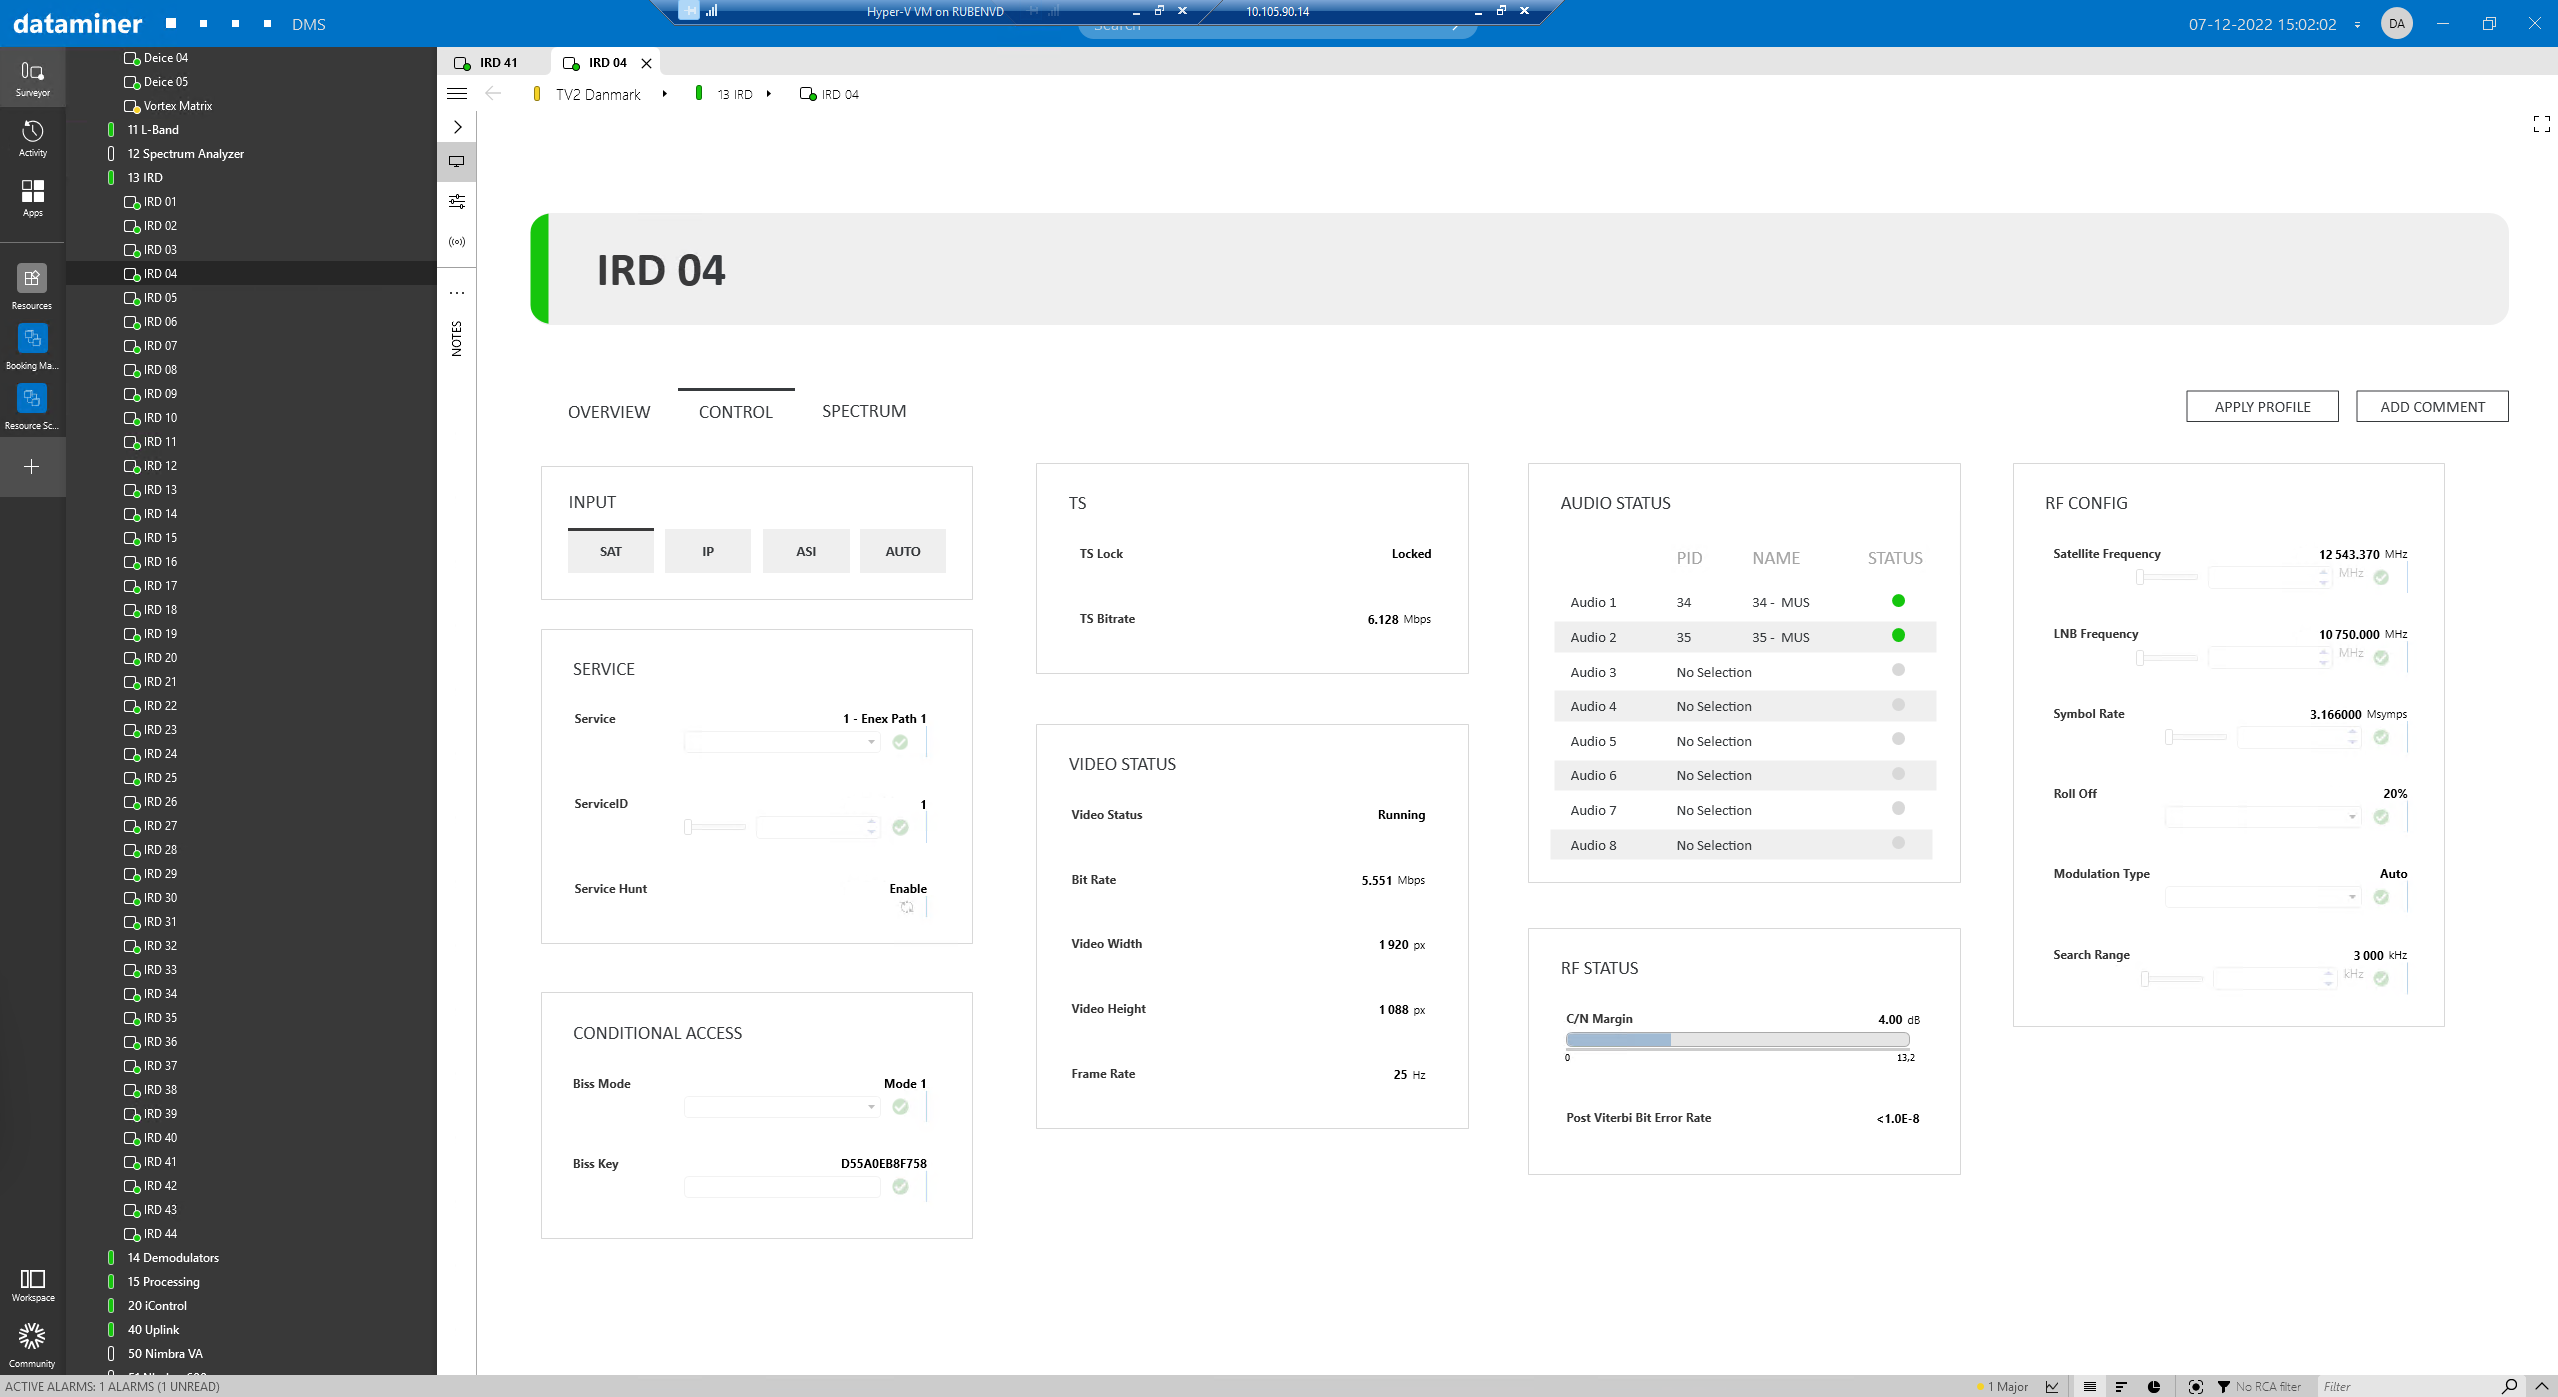 When you change your input to SAT, then easily configure your RF parameters such as satellite and LNB frequency, symbol rate, roll off and modulation. Or instead of changing individual parameters, just apply a full profile that includes all parameters in a template.