solution Use Case
GPON EPM Platform
One of the biggest challenges faced by internet service providers today is delivering efficient and prompt customer service. When a customer contacts the support team with a complaint about their internet connection, a slow solution to the problem can lead to customer dissatisfaction and potentially cause the company to lose that customer. The primary obstacle is accurately identifying the source of the issue. Is the problem confined to a single customer due to a malfunctioning GPON ONT, or is it a neighborhood-wide issue caused by higher-level network failures?
Without a clear diagnosis, companies often resort to sending technicians to individual customers’ homes, only to find that the issue lies elsewhere in the network. This approach can lead to wasted time and resources.
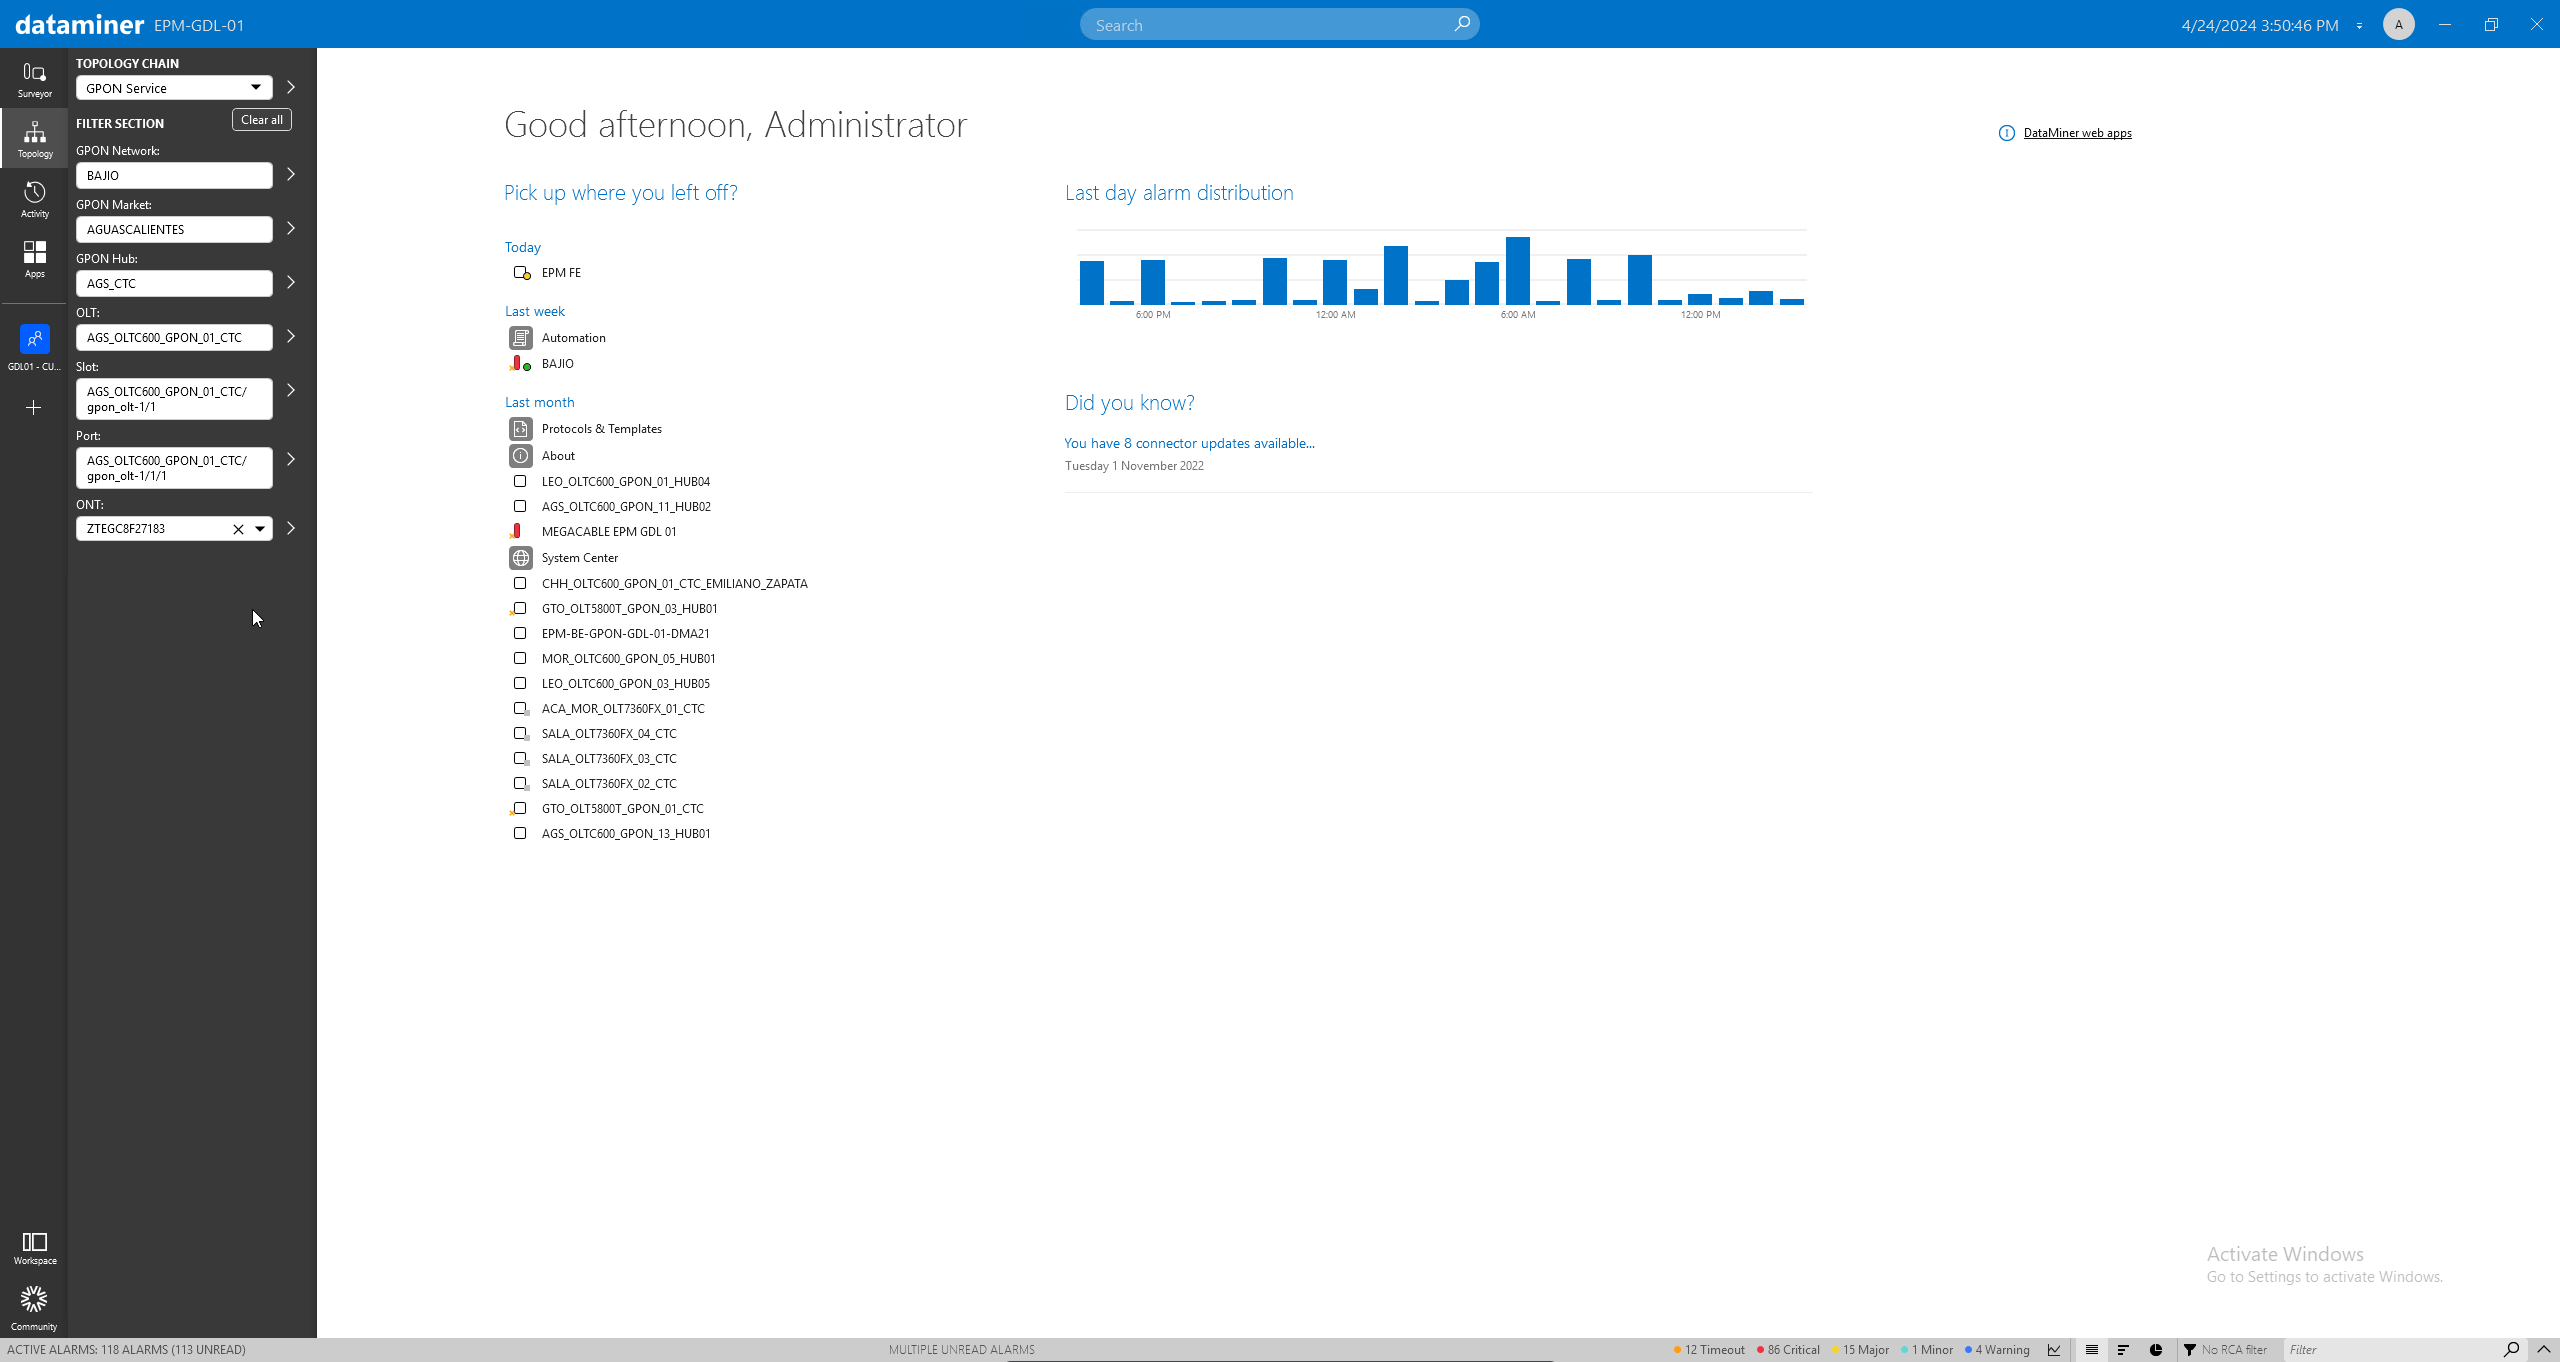
The Skyline EPM GPON Solution offers an easy remedy. It collects comprehensive topology data from an entire GPON network and aggregates vital KPIs throughout the network’s structure. This wealth of data enables customer service teams to precisely locate failures when users report issues, leading to faster resolutions and higher customer satisfaction. Additionally, it minimizes unnecessary expenses associated with deploying technicians for problems that are not customer specific.
USE CASE DETAILS
 With the Skyline EPM GPON solution, you can seamlessly navigate through all topology levels to any desired depth. As you explore, you can access KPIs for each level and easily switch to related dashboards for more details.
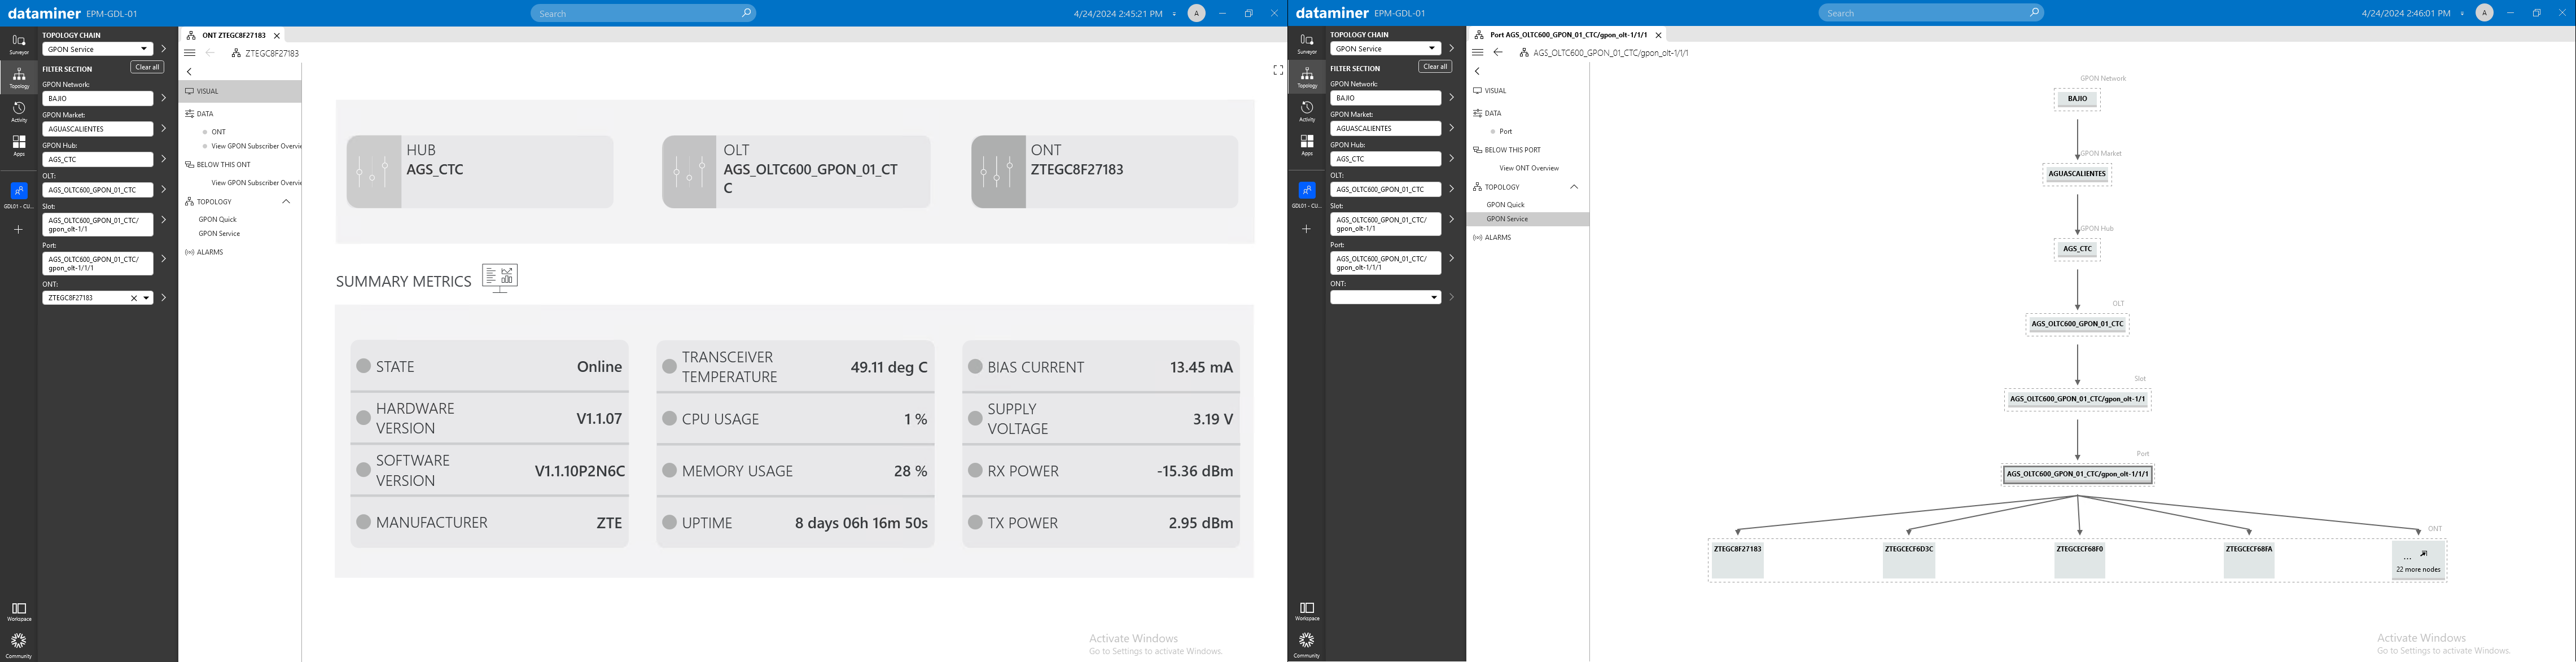
In the Topology section, you can view a hierarchical tree diagram of the GPON network, making it easy to navigate through different topology levels. This allows you to examine the relationships between parent and child elements. By double-clicking you can access detailed information about any specific level.
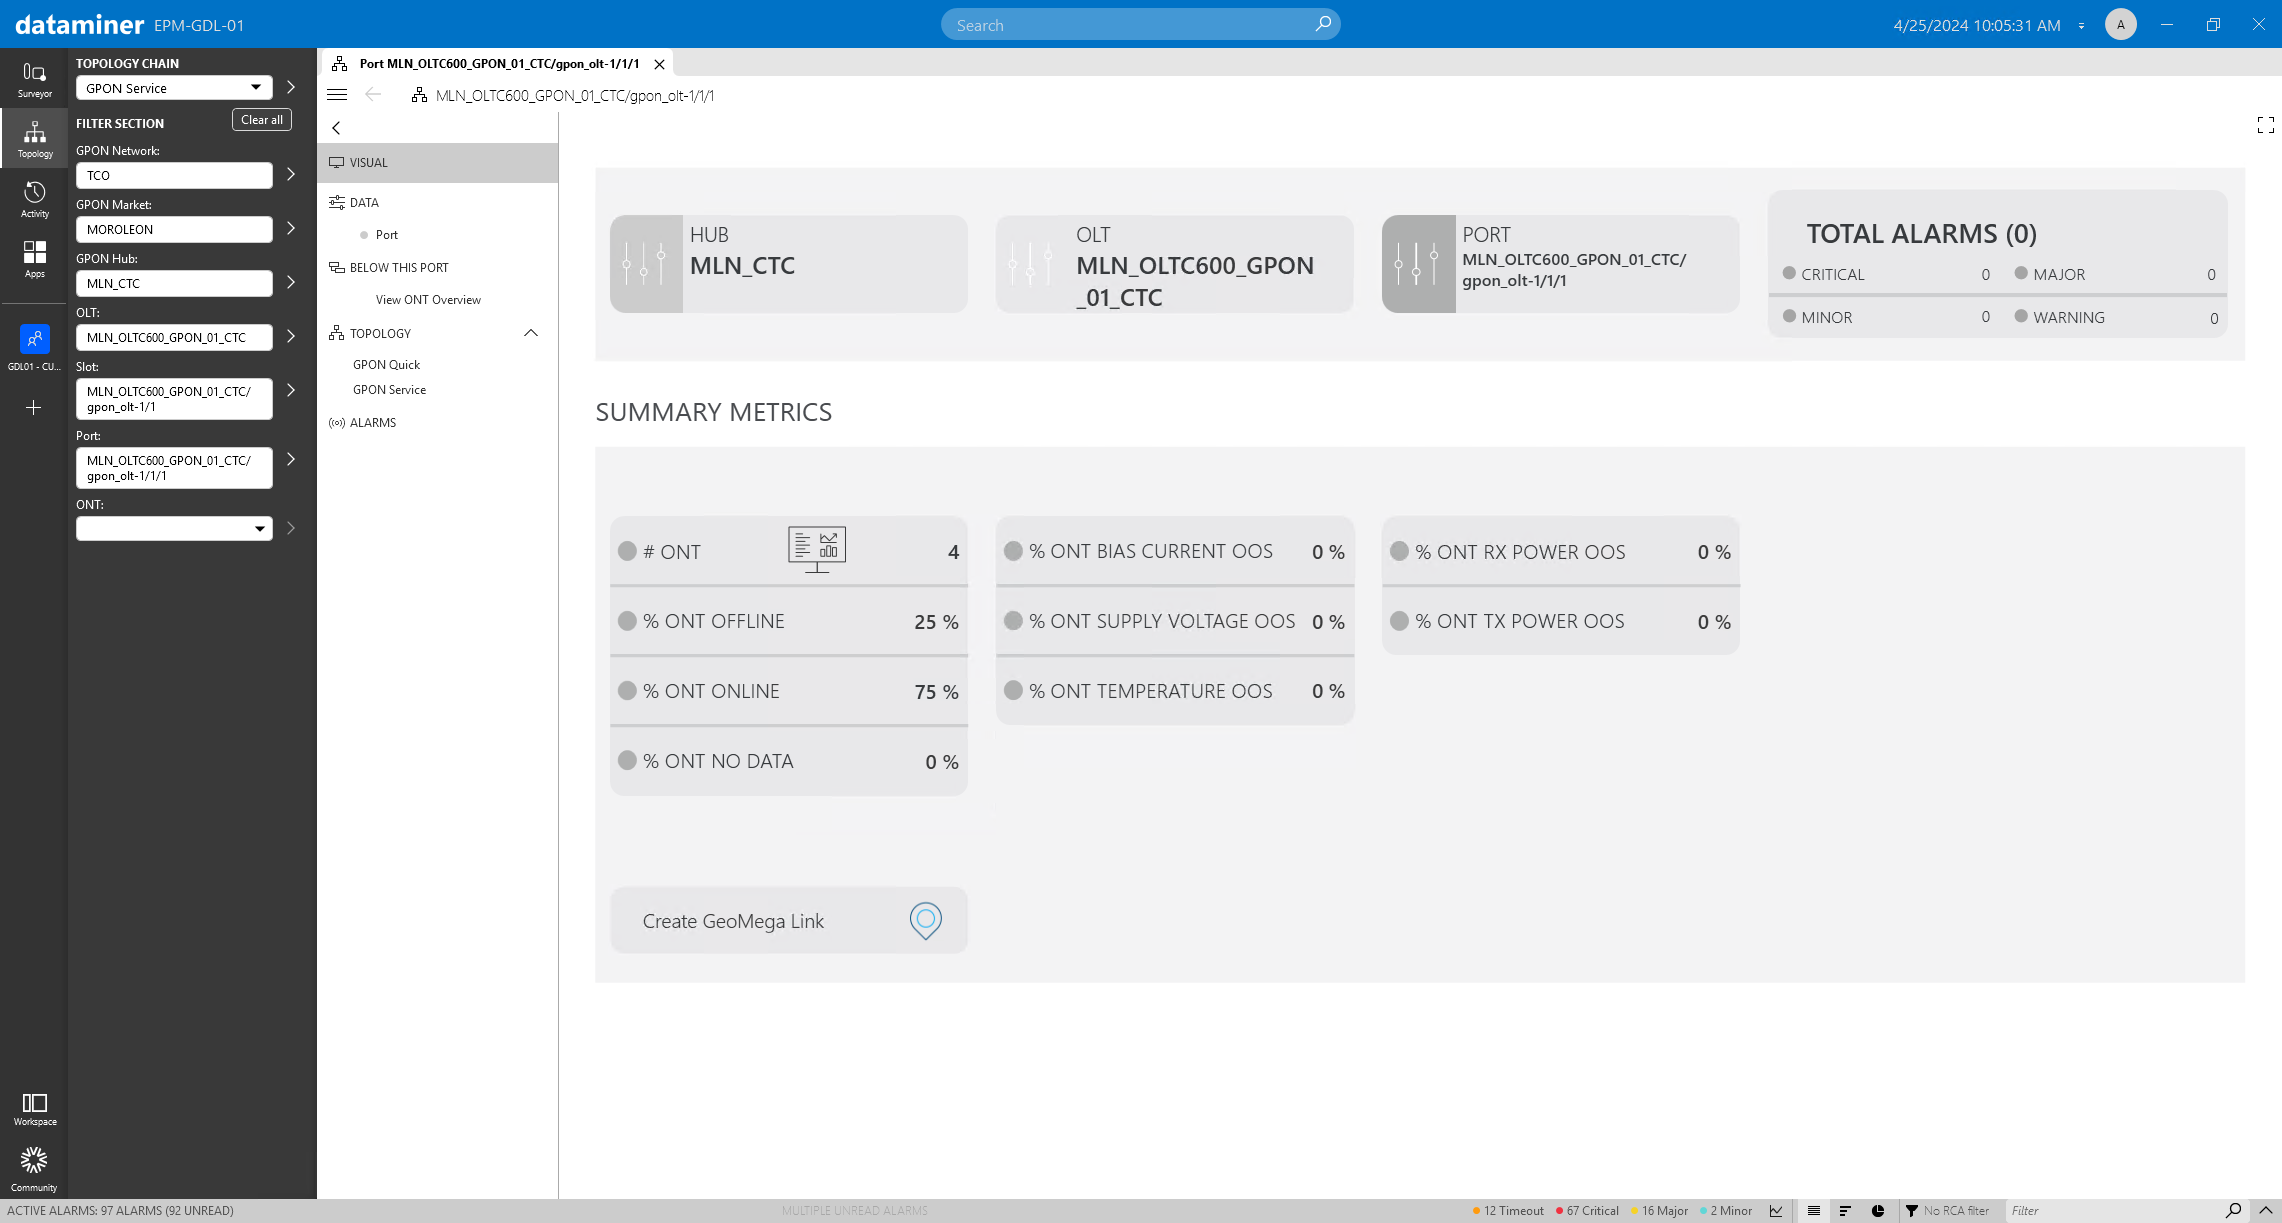 When you select a port in the Topology navigation menu, located in the sidebar, you will be presented with a visual summary. This summary contains key performance indicators (KPIs) for the selected port, offering you a comprehensive overview of the operational status of Optical Network Terminals (ONTs) associated with the port.
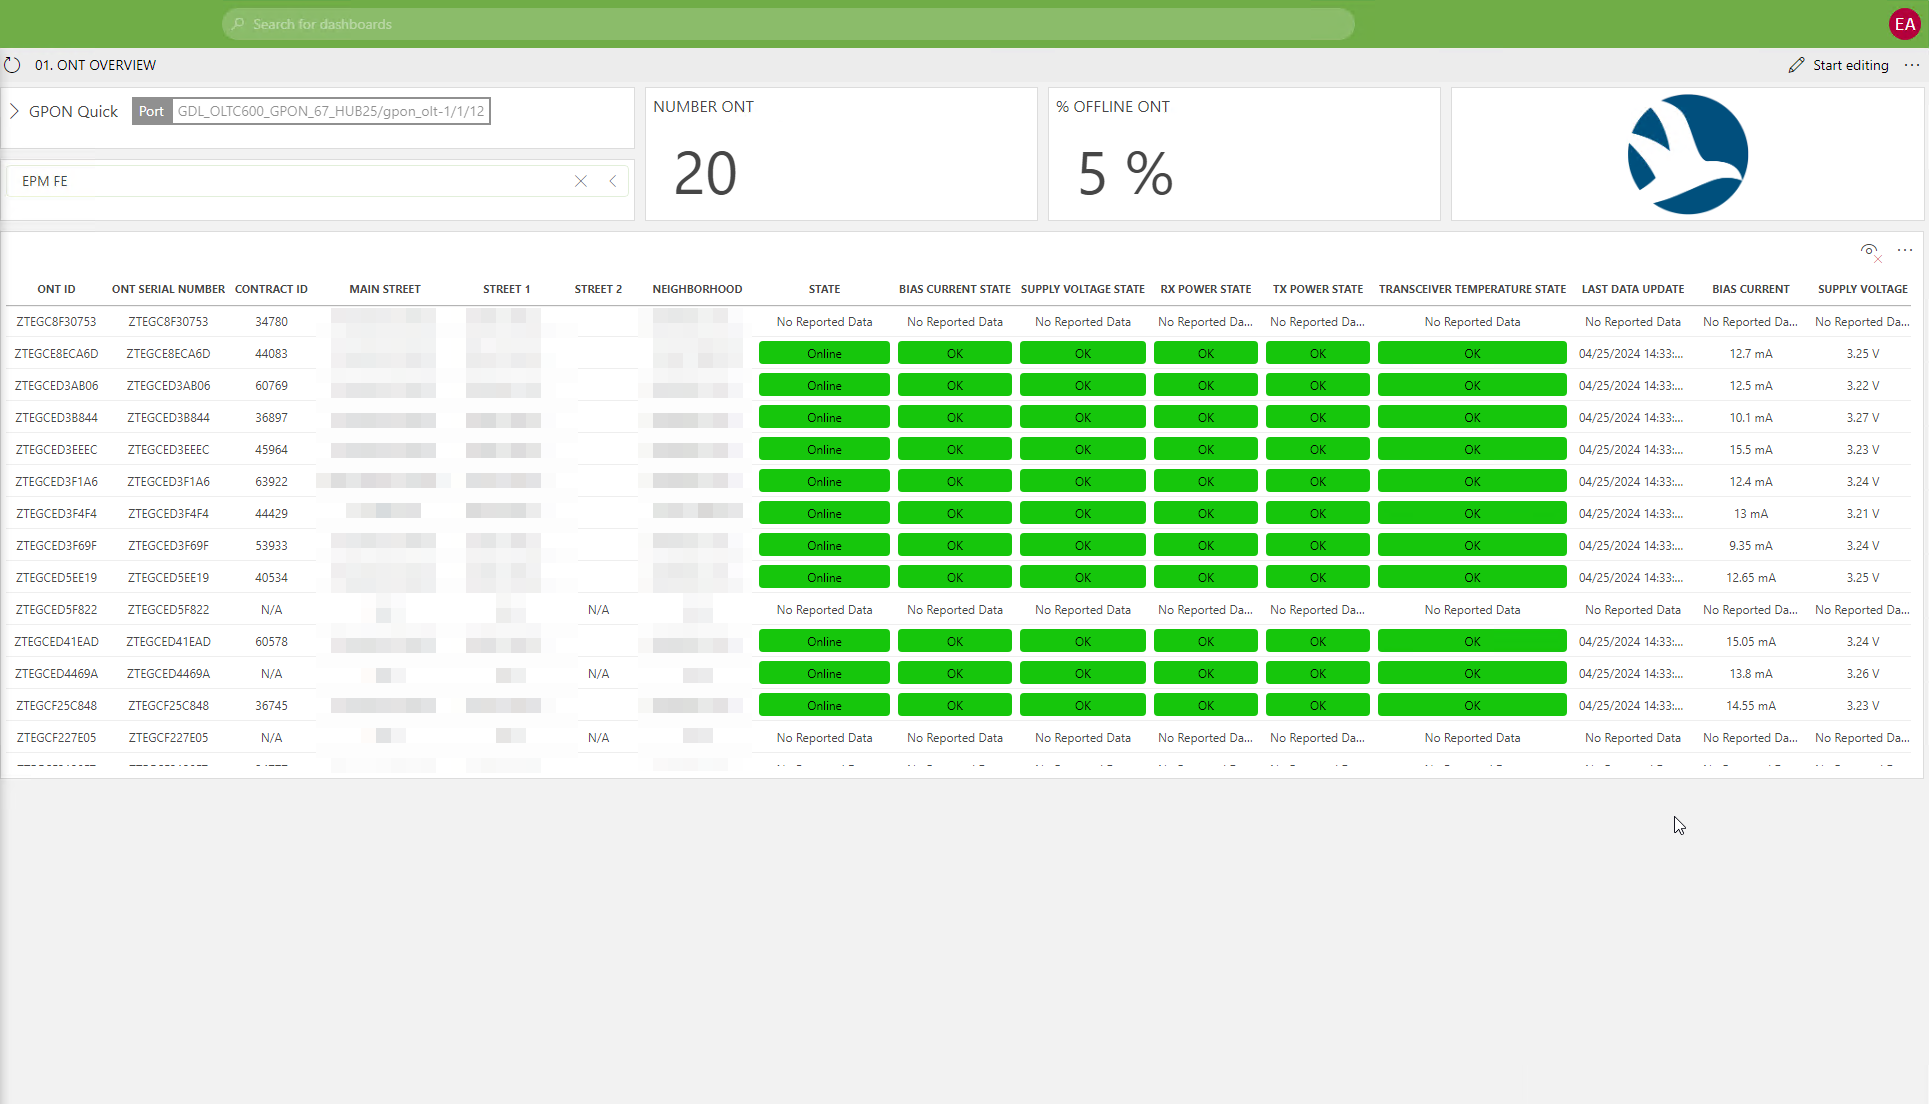 The Skyline EPM GPON solution comes with a set of dashboards designed for monitoring the status of ONTs across various aggregation levels. For instance, in the Port folder, you can find the ONT overview dashboard, which allows you to track KPIs related to a specific port. These KPIs include the total number of ONTs, the percentage of ONTs that are offline, and a detailed table listing each ONT along with its respective KPIs.
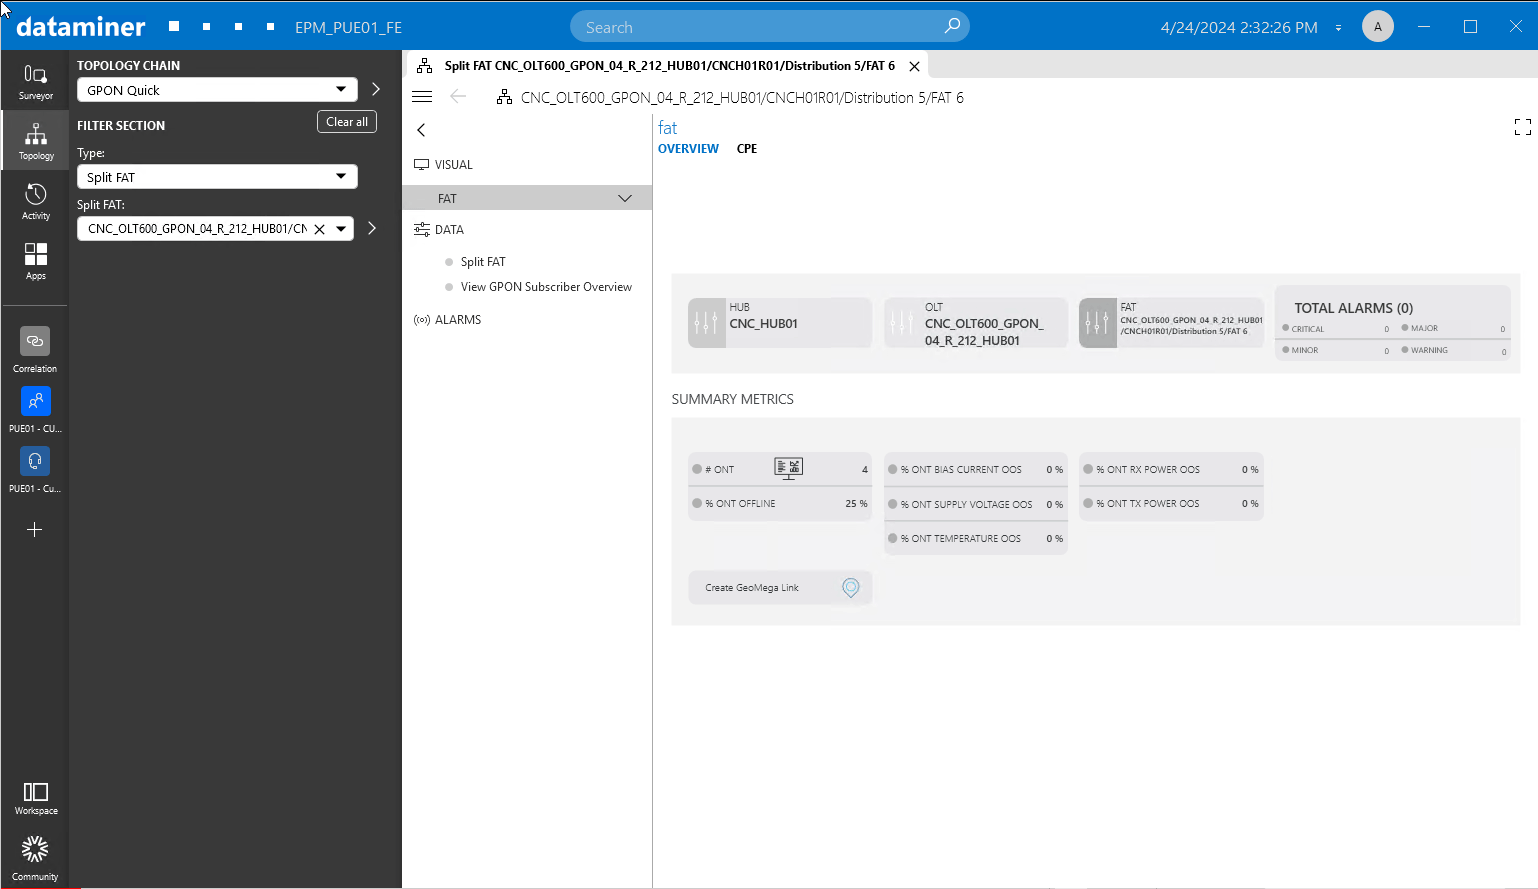 In Cube, navigate through the Topology menu to explore various levels, such as Split Distribution and Split FAT. Start by selecting GPON Quick, then choose either Split Distribution or Split FAT as the type, and select a specific distribution or FAT from the dropdown list. This grants you access to relevant KPIs, offering valuable insights into the network's health. Quickly pinpoint and address potential issues across these topology levels with ease.
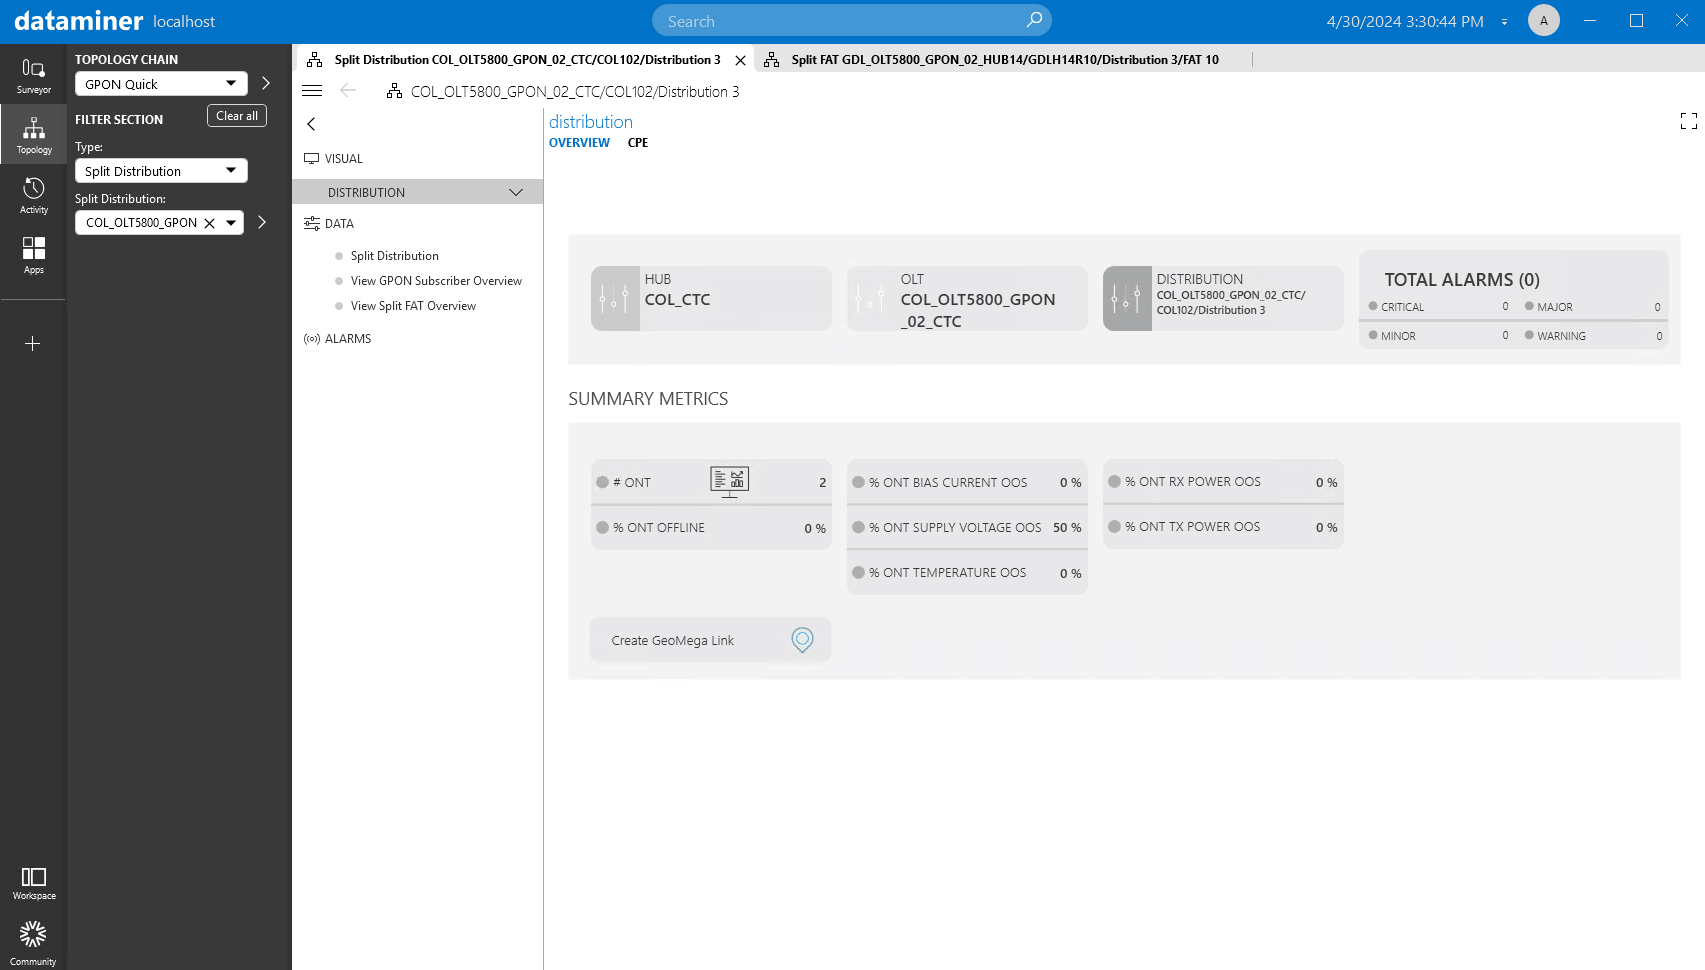 On the FAT and Distribution overview pages, click the dashboards icon to be redirected to the ONT overview dashboards, located in either the FAT or Distribution folder. Use these dashboards to examine KPIs, including the total number of ONTs, the percentage of ONTs that are offline, and a table listing each ONT along with its respective KPIs.
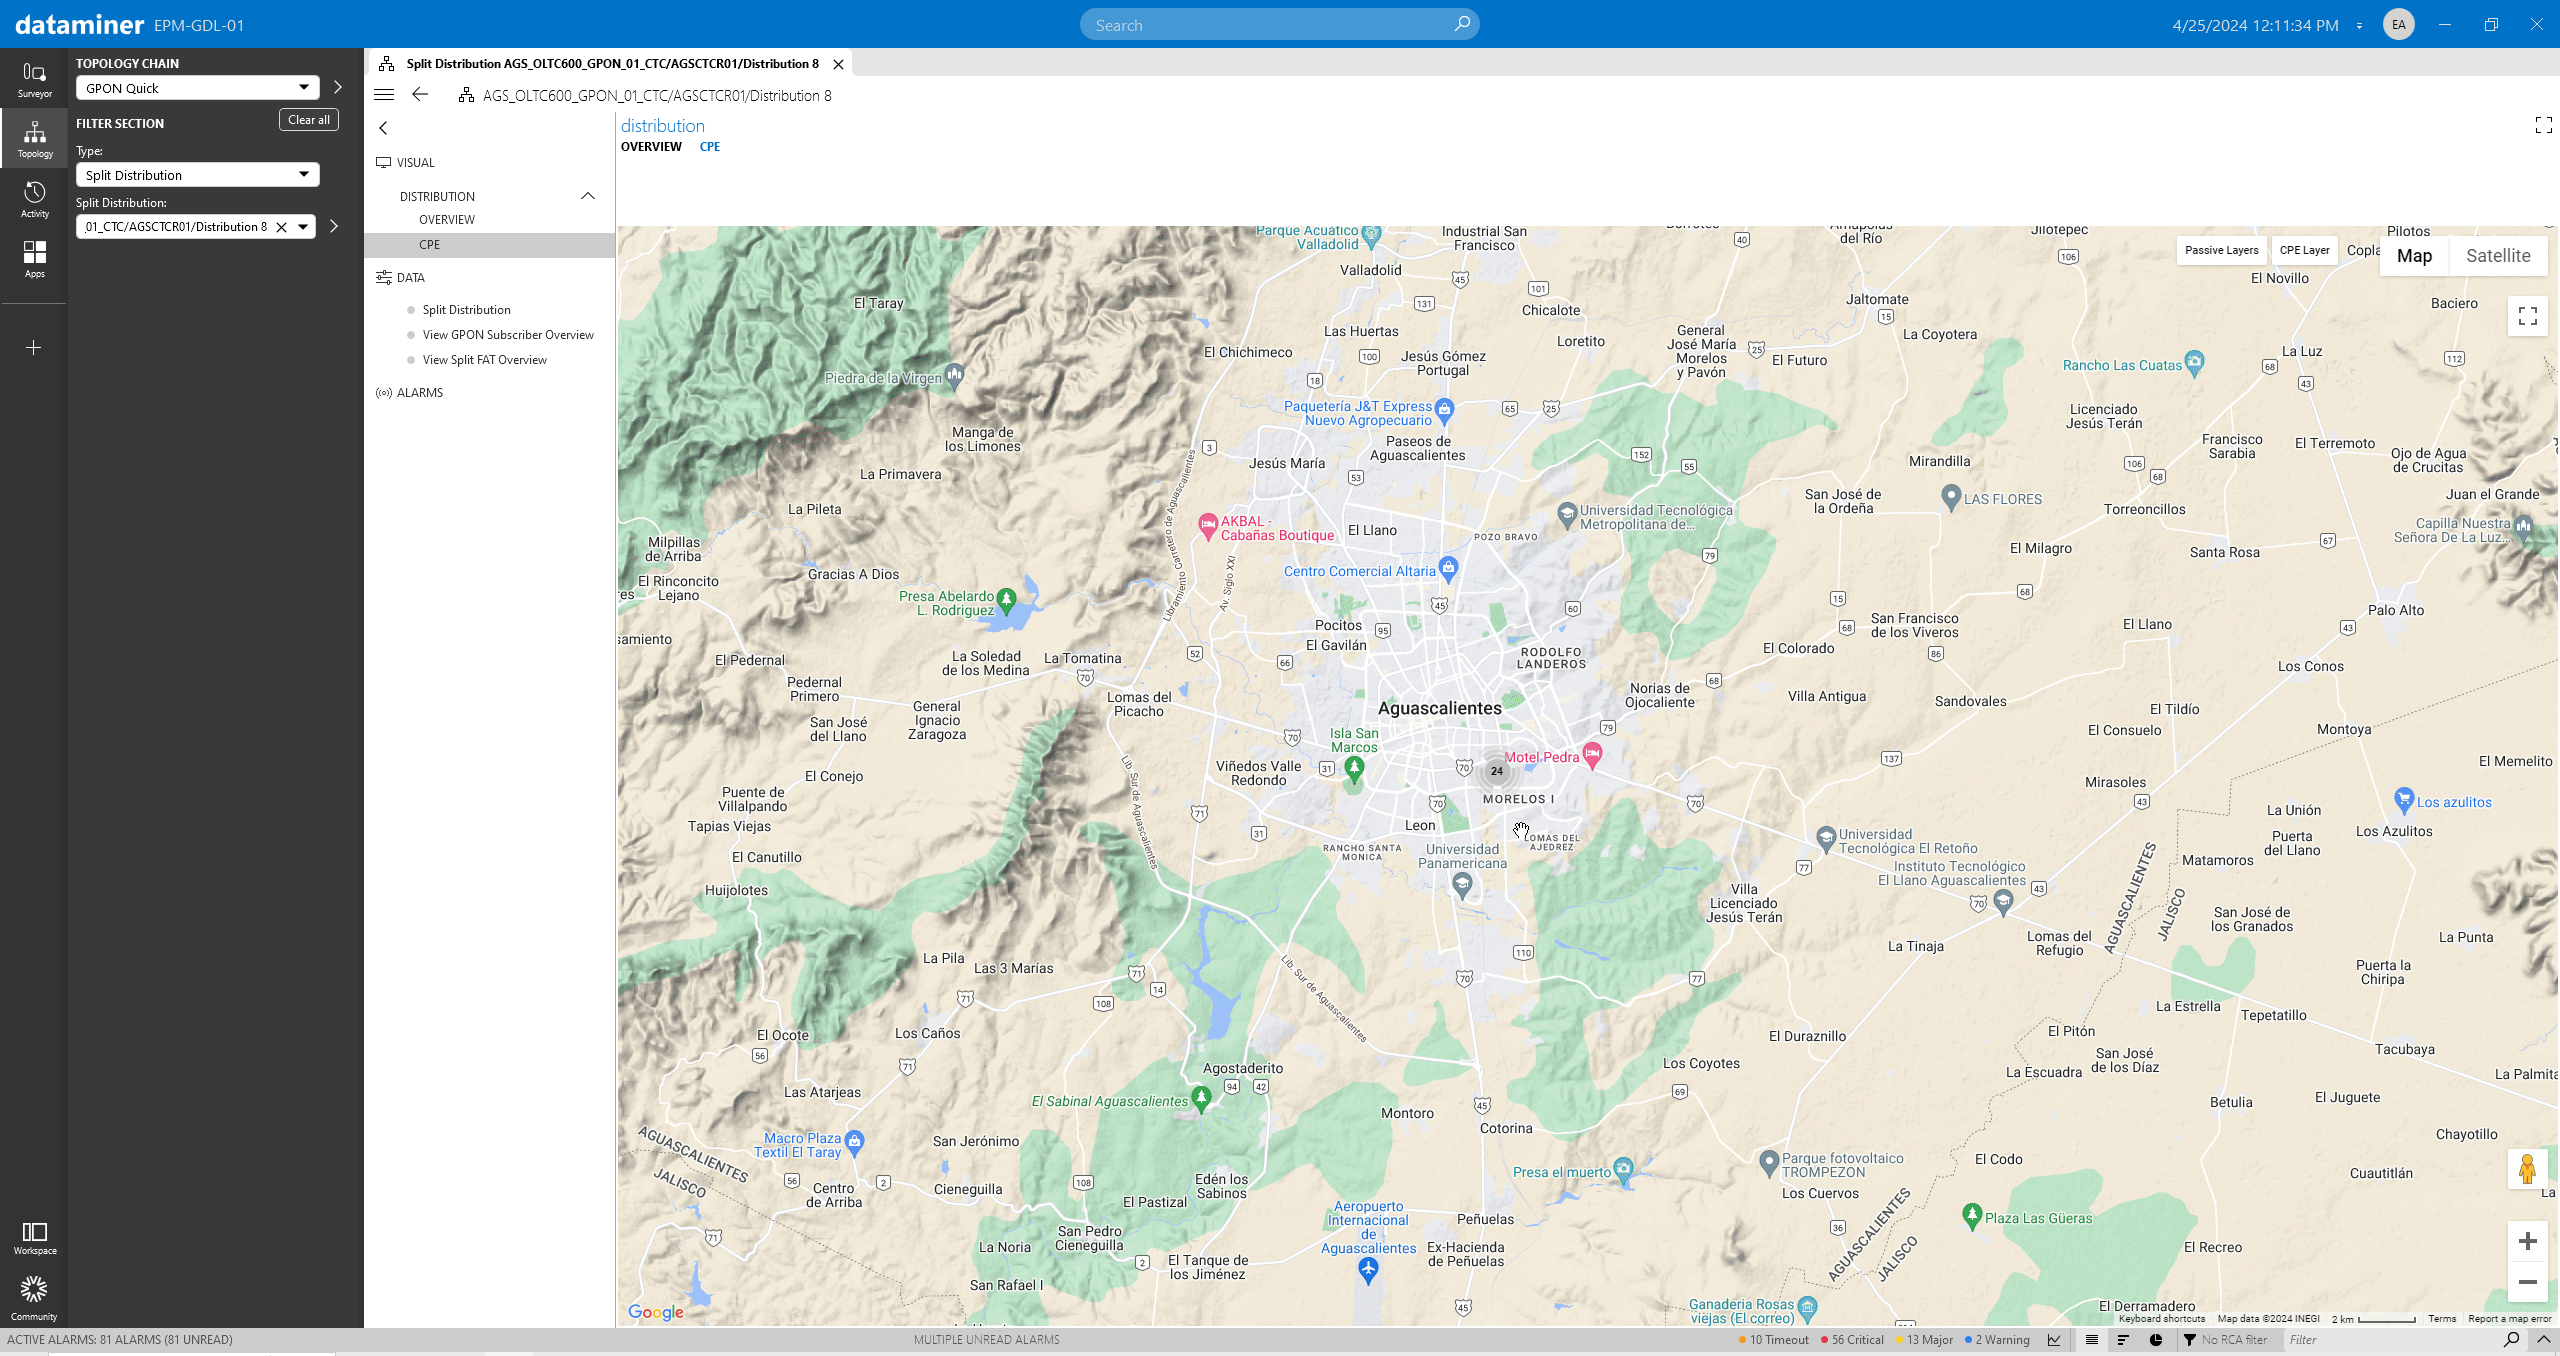 Additionally, when you've selected a distribution point in the Topology navigation menu, you can also navigate to the CPE (Customer Premises Equipment) page. On the Distribution CPE pages, you will find a comprehensive map encompassing all subscribers and passive elements situated within the respective geographical region.
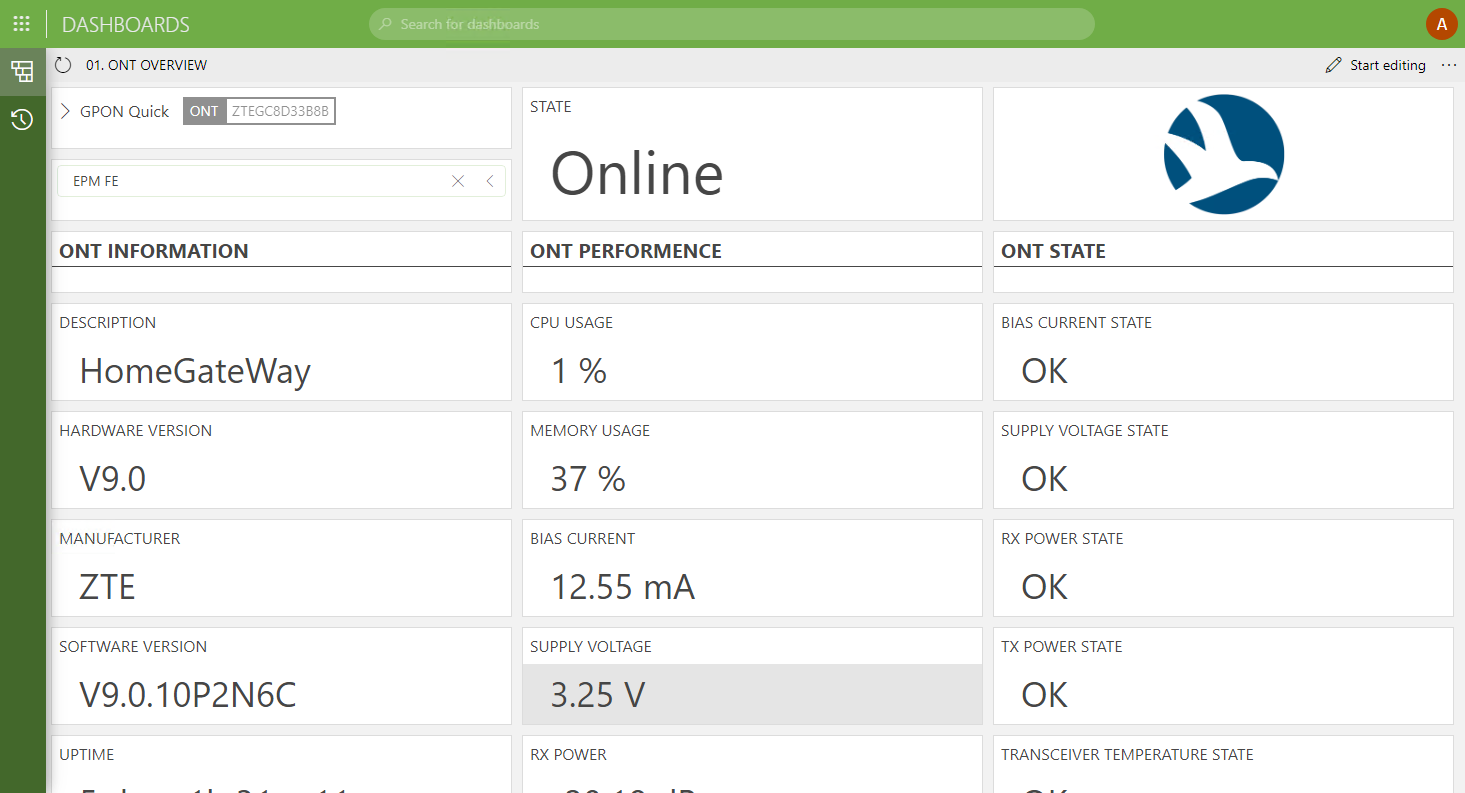 The ONT overview dashboard in the ONT folder offers an overview of the main KPIs of a selected ONT, such as general status, CPU usage, memory usage, supply voltage, and bias current, among others.