solution Use Case
Flow Monitoring – Custom search
As shown in other use cases, such as Multicast Flow Monitoring and Flow Monitoring, DataMiner provides robust tools for the monitoring of multicast flows in a network. These two previously published use cases highlight some of DataMiner’s key technologies, including GQI (Generic Query Interface), Node-Edge, and HTML5, to better show the flow status and the different streams that are present in the network.
In this use case, we explain how DataMiner extends those features by providing search tools that allow users to zoom in on a specific section of the network. The search is narrowed down by providing a Source IP and a Transport Stream IP (optionally a service within the multicast flow). Then, DataMiner will look for the device that matches the input data and calculate the upstream and downstream flows associated with the Source IP and Transport Stream IP.
Those upstream and downstream flows are composed of several devices by different vendors (CISCO, Harmonic, AWS) and include different transformations that streams might suffer on each device. For example, on CISCO DCMs, the video of a stream can be manipulated to get a different resolution and the stream itself can be outputted into multiple interfaces for redundancy. All these different transformations are tracked by DataMiner and shown in a node-edge component, so a user doesn’t have to jump into different device interfaces to see the behavior of a stream.
USE CASE DETAILS
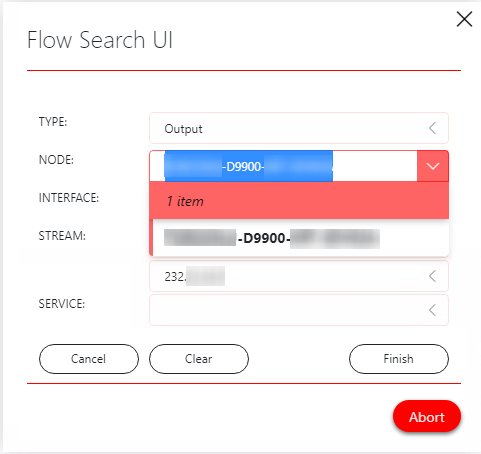 You can specify the following information: type, node, interface, stream, and service. You start your search by filling in one of the fields, and DataMiner will filter the others based on the initial selection.
This way, if you know that a certain device is having issues, DataMiner will show the possible affected interfaces, streams and/or services.
You can specify the following information: type, node, interface, stream, and service. You start your search by filling in one of the fields, and DataMiner will filter the others based on the initial selection.
This way, if you know that a certain device is having issues, DataMiner will show the possible affected interfaces, streams and/or services.
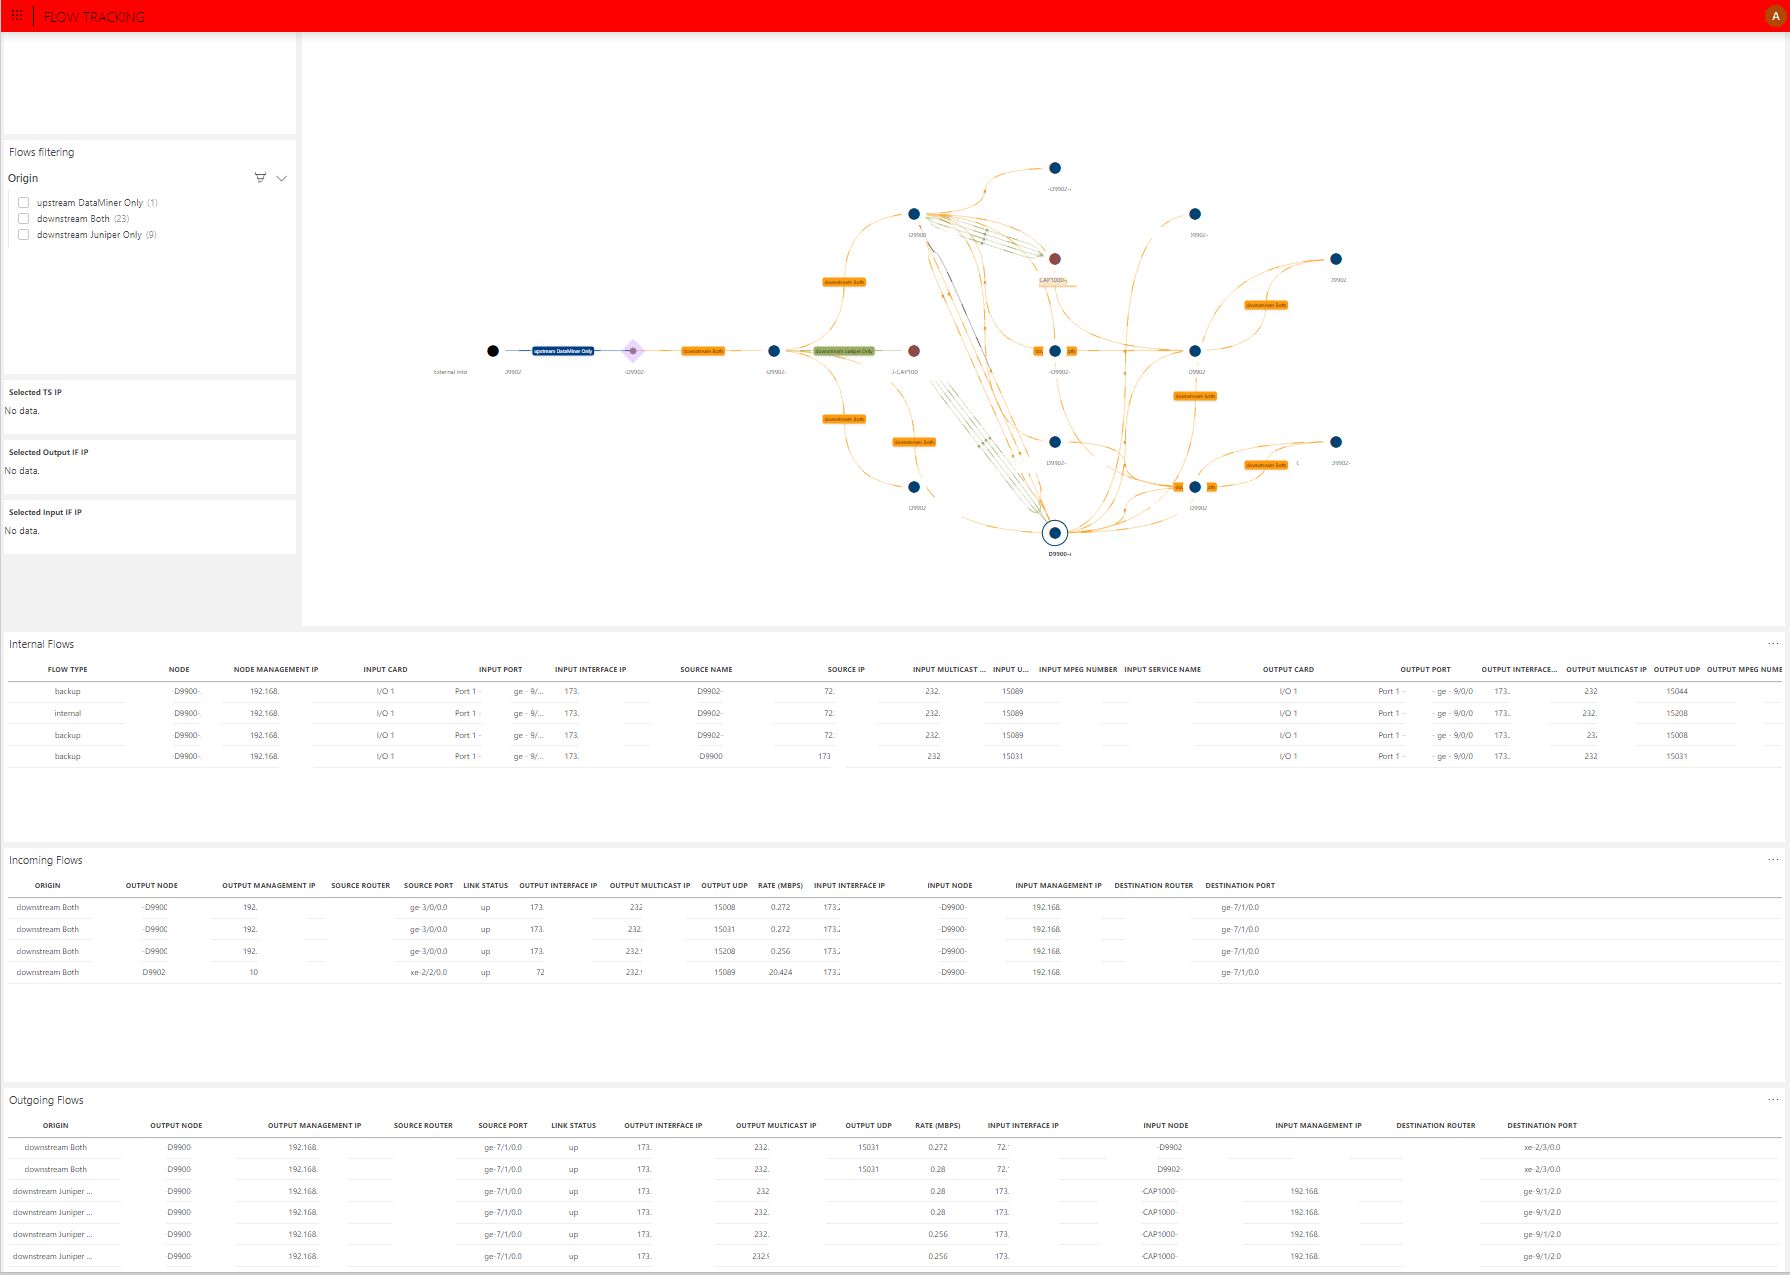
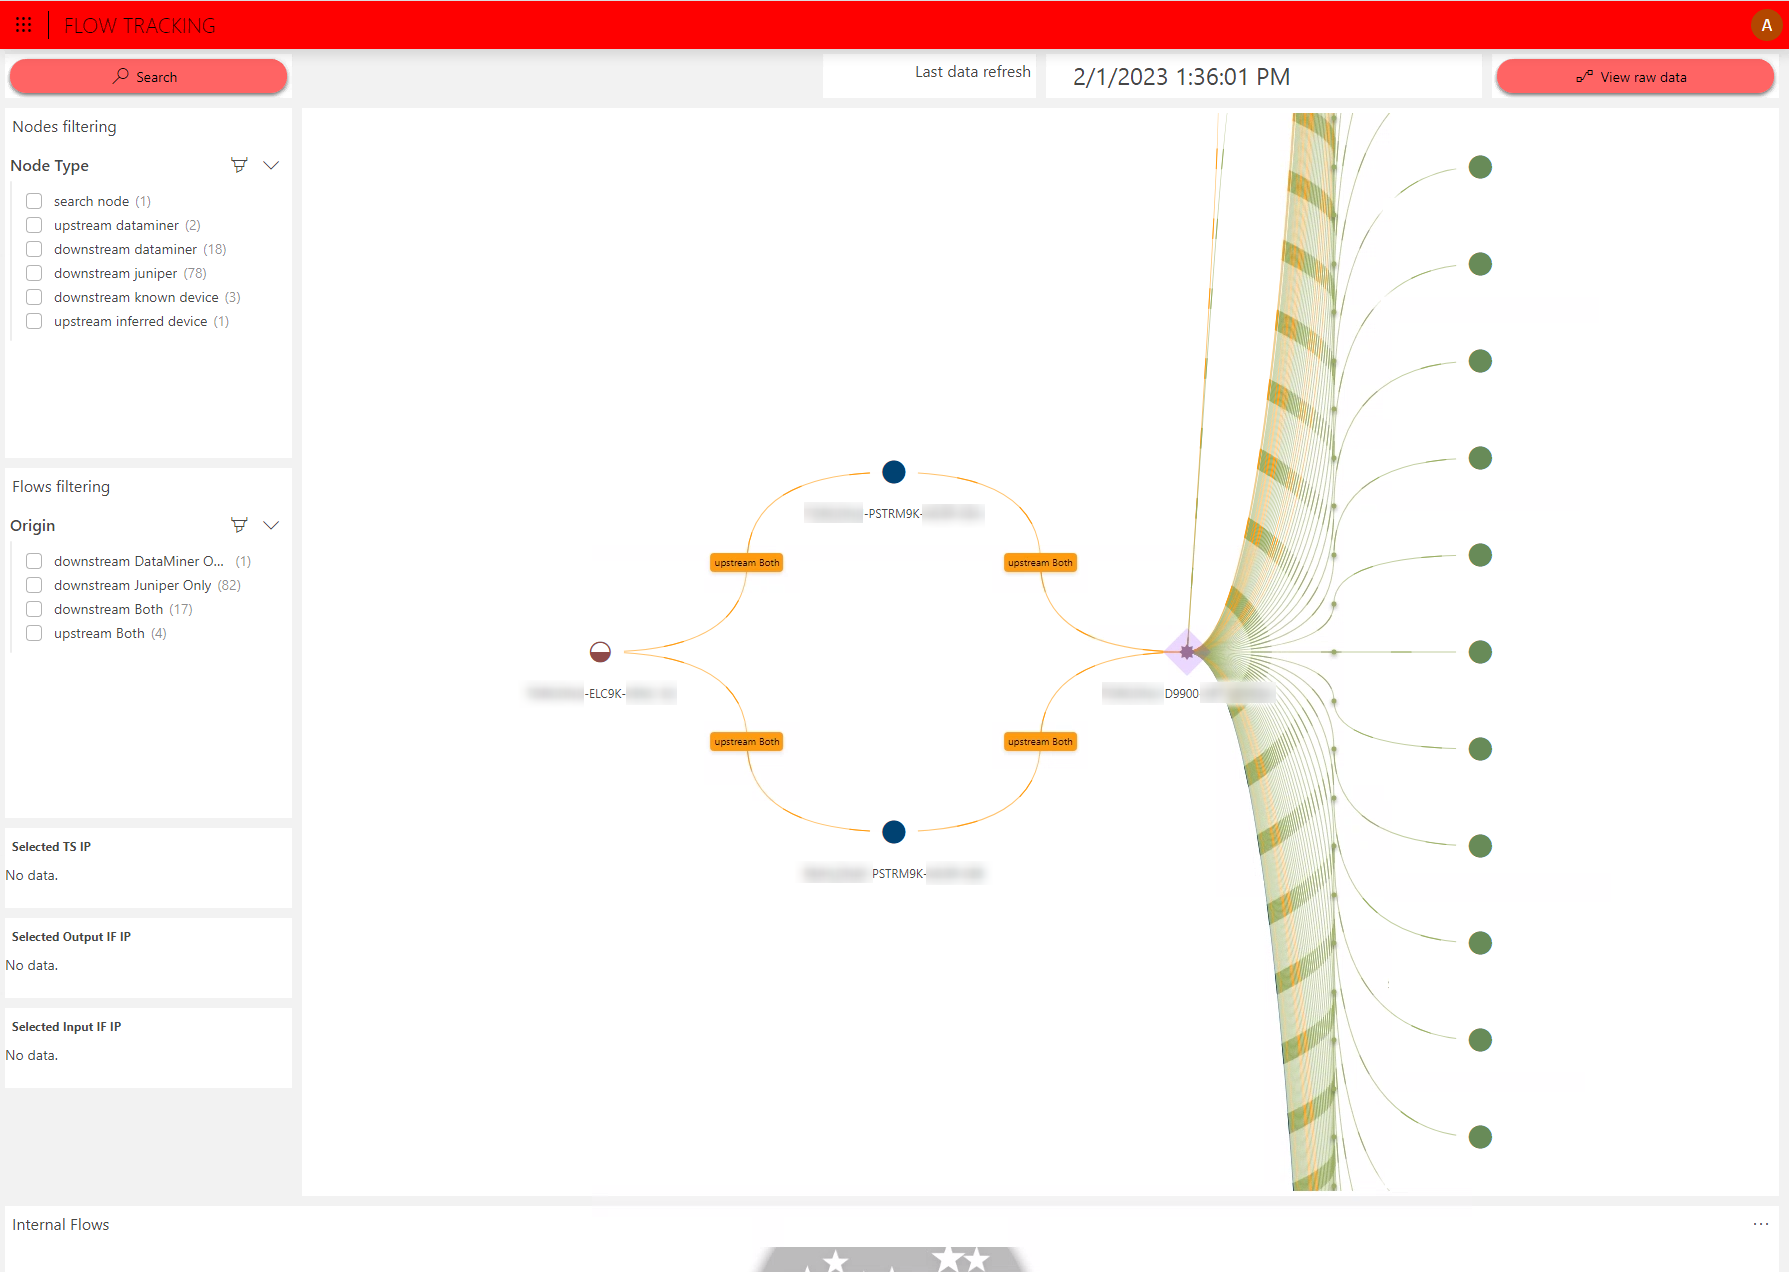 When the search is finished, DataMiner will show and categorize the different devices that are part of the multicast flow.
The categories are based on the provision state of the devices in DataMiner. If a device is provisioned, DataMiner can review the different transformations that streams suffer within that device. But if it is not, DataMiner can only tell that the device is part of the flow.
For operators, this is a good indication of which elements are still not created and monitored in DataMiner.
When the search is finished, DataMiner will show and categorize the different devices that are part of the multicast flow.
The categories are based on the provision state of the devices in DataMiner. If a device is provisioned, DataMiner can review the different transformations that streams suffer within that device. But if it is not, DataMiner can only tell that the device is part of the flow.
For operators, this is a good indication of which elements are still not created and monitored in DataMiner.
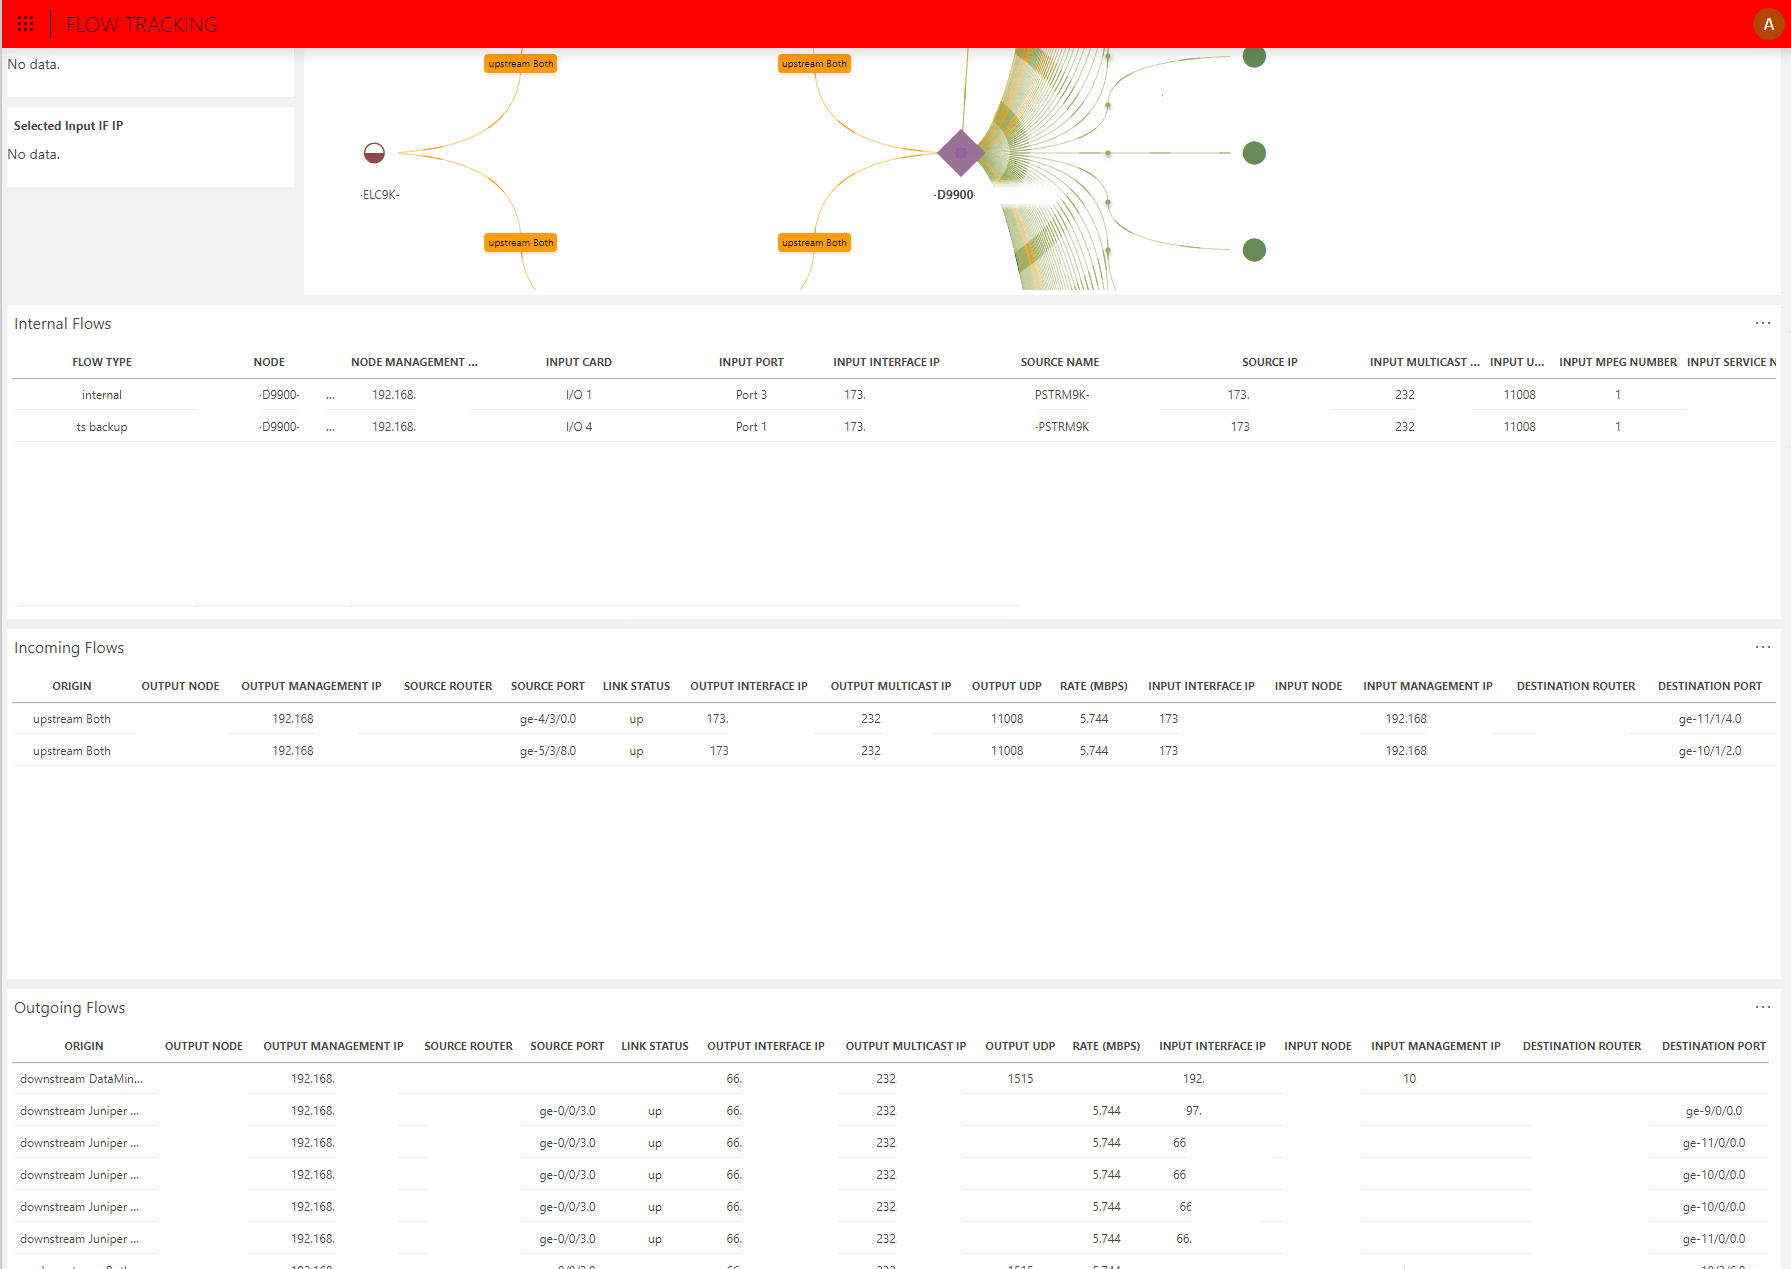 You can start the review of the presented flows by clicking on the different nodes (devices). The application has tables that provide information on:
1. Upstream flows: define the incoming flows and detail the device source.
2. Internal flows: define the transformations that devices perform over the flows, e.g. backups, change of resolutions, mirroring interfaces.
3. Downstream flows: define the outgoing flows that the device is communicating to other nodes.
-
All these features provide different advantages, like planning for new feeds or services in the network, or understanding the impact of retiring or adding equipment.
You can start the review of the presented flows by clicking on the different nodes (devices). The application has tables that provide information on:
1. Upstream flows: define the incoming flows and detail the device source.
2. Internal flows: define the transformations that devices perform over the flows, e.g. backups, change of resolutions, mirroring interfaces.
3. Downstream flows: define the outgoing flows that the device is communicating to other nodes.
-
All these features provide different advantages, like planning for new feeds or services in the network, or understanding the impact of retiring or adding equipment.
1 thought on “Flow Monitoring – Custom search”
Leave a Reply
You must be logged in to post a comment.
Great work. A real-life example of a powerful DM implementation enabling the end-user to understand and map their multicast flows to track source, origin and services running in the flows.
Additionally, it enables accurate documentation of the systems and their uses to guide operational procedures and planning for future expansions of the switcher fabric.