example Use Case
EPM for management of DOCSIS based broadband delivery
docsis
Arris
Commscope
ArcGIS
Cisco
Management of a network for DOCSIS based broadband delivery featuring a mix of Commscope C4 and E6000 cable modem termination systems.
USE CASE DETAILS
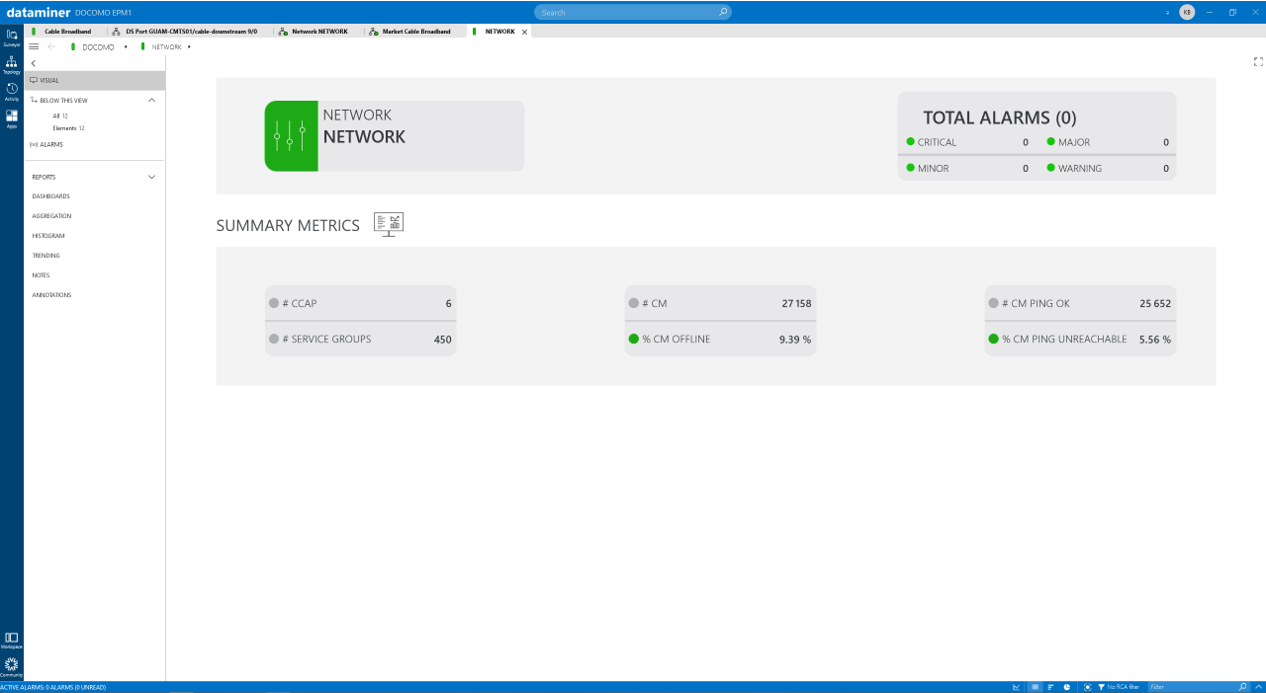 Visual with key data and status info for the overall network
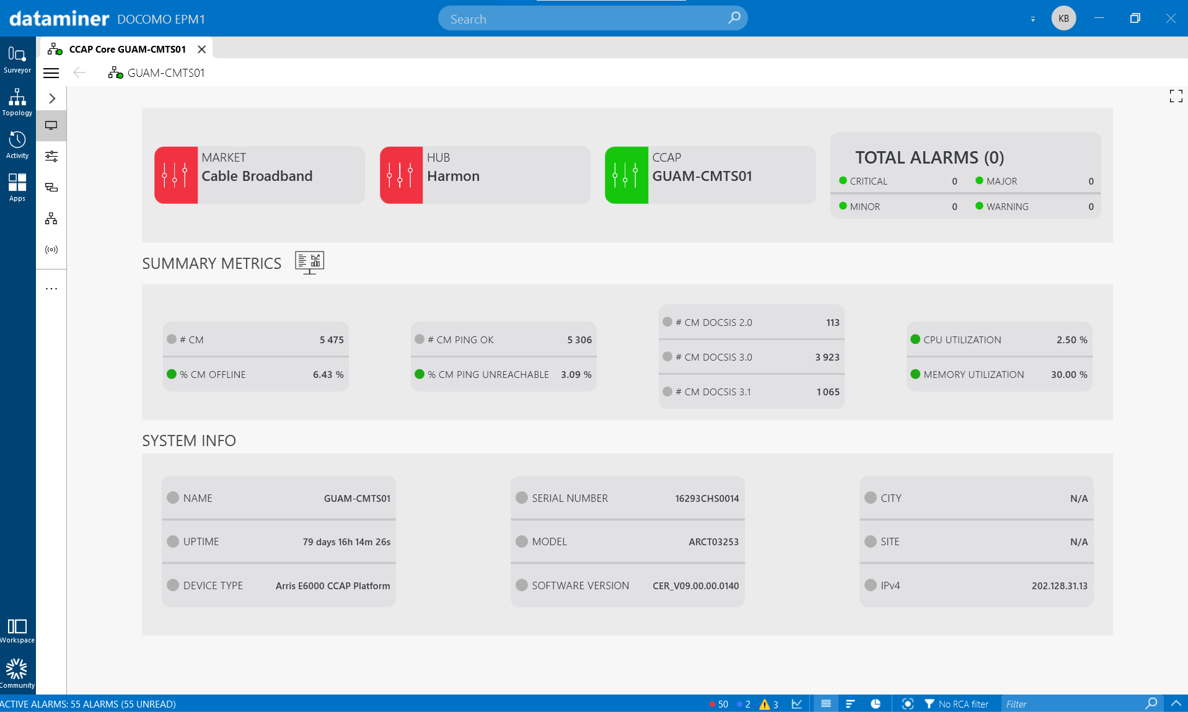 Visual with key data and status info for a DOCSIS core
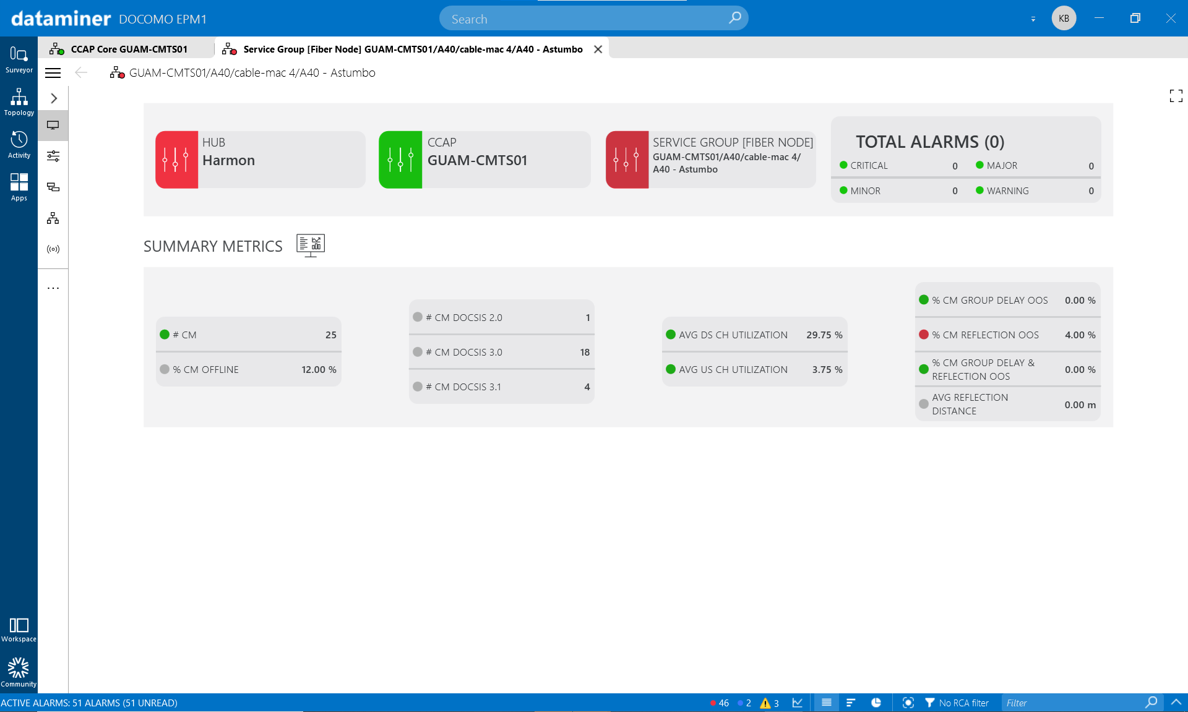 Visual with key data and status info for a specific service group
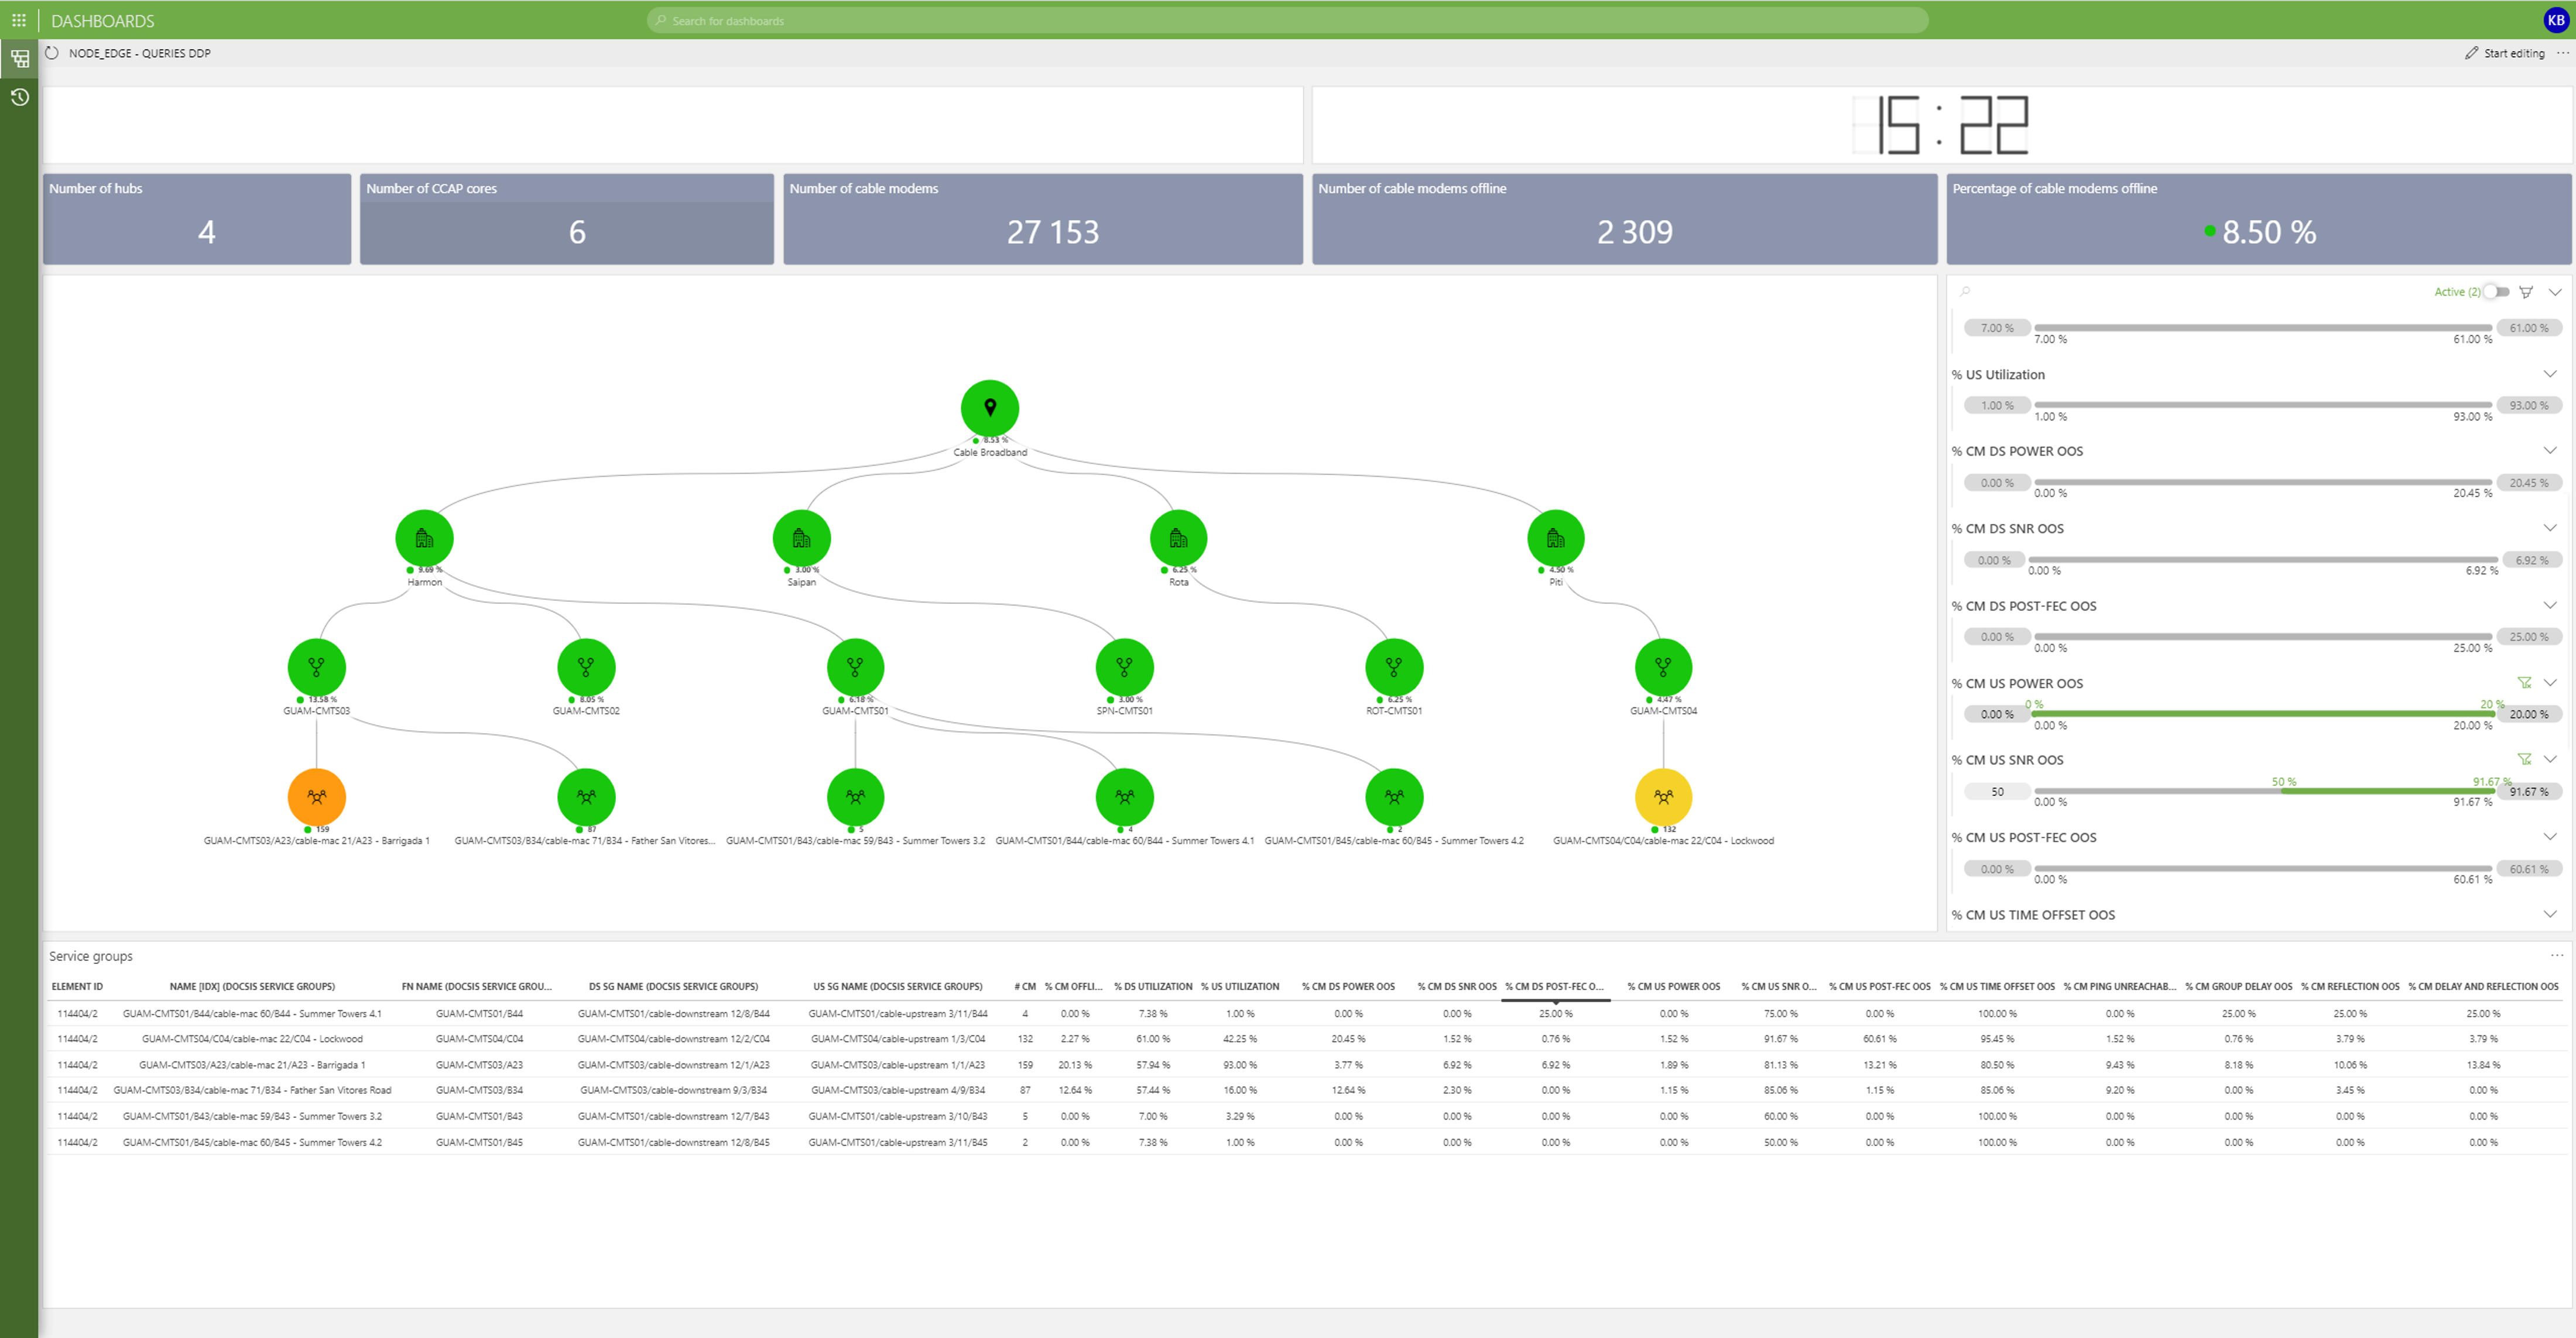
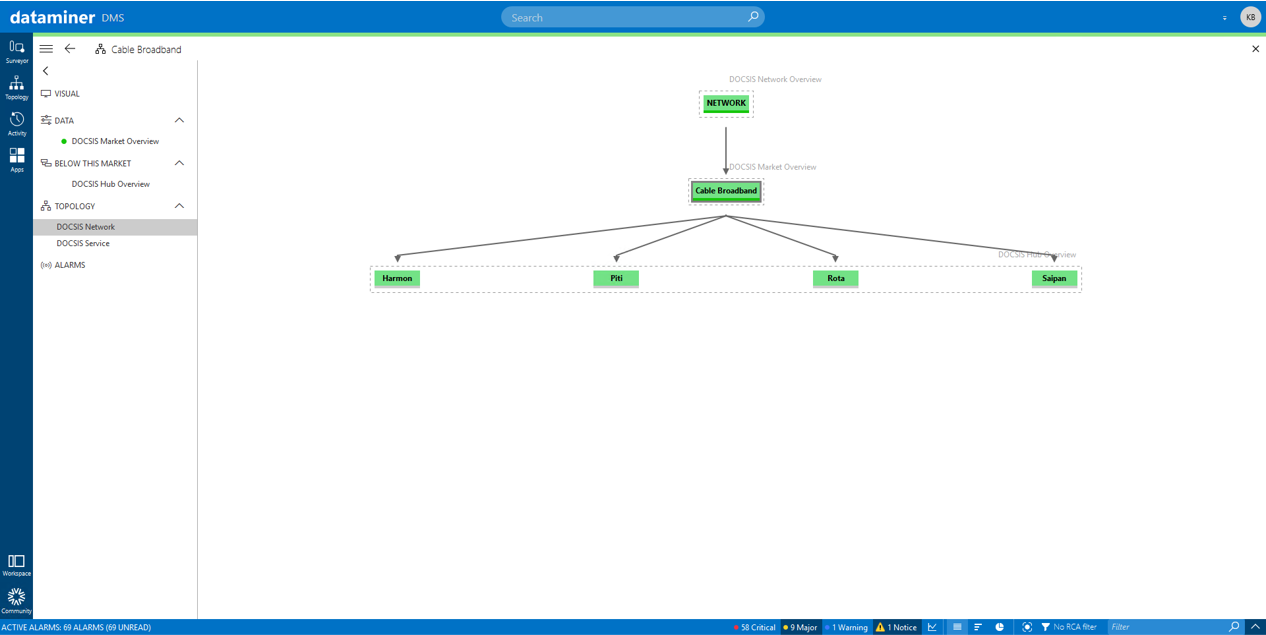 Network topology view visualizing the different network PoP's as well as their health status
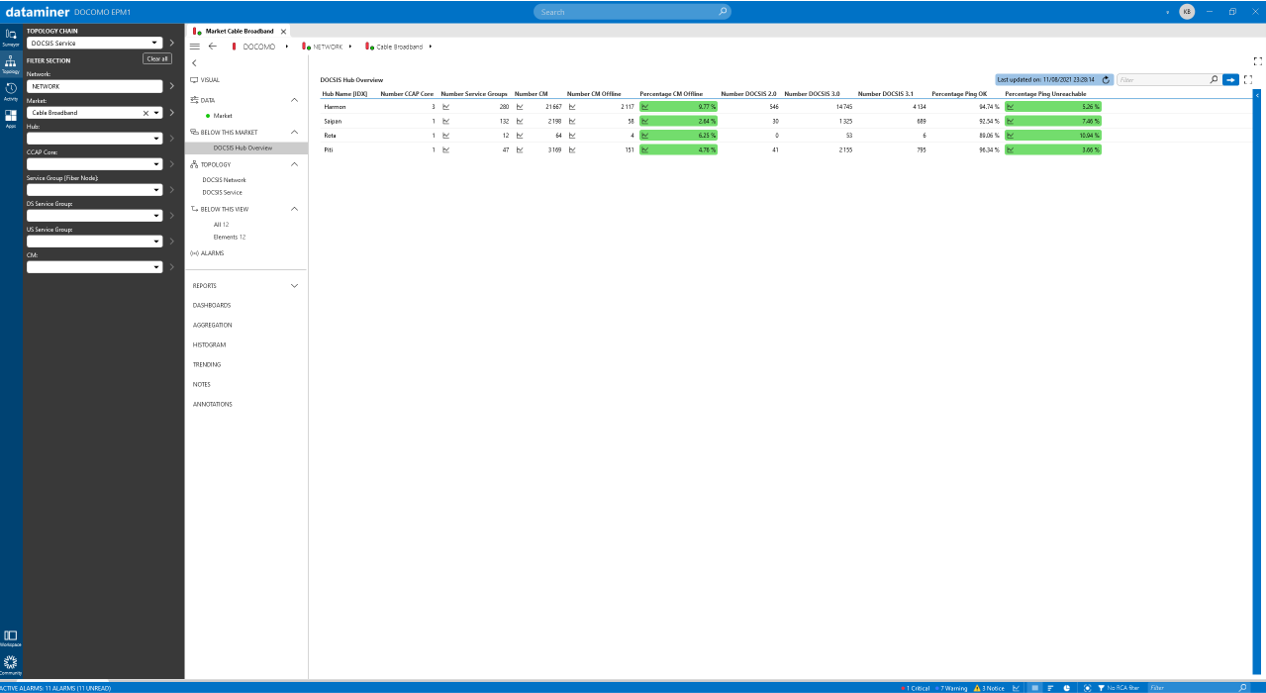 Network hub overview list with added detail related to the quantities of associated cores and modems including information on the percentages of modems that are offline and unreachable by ping.
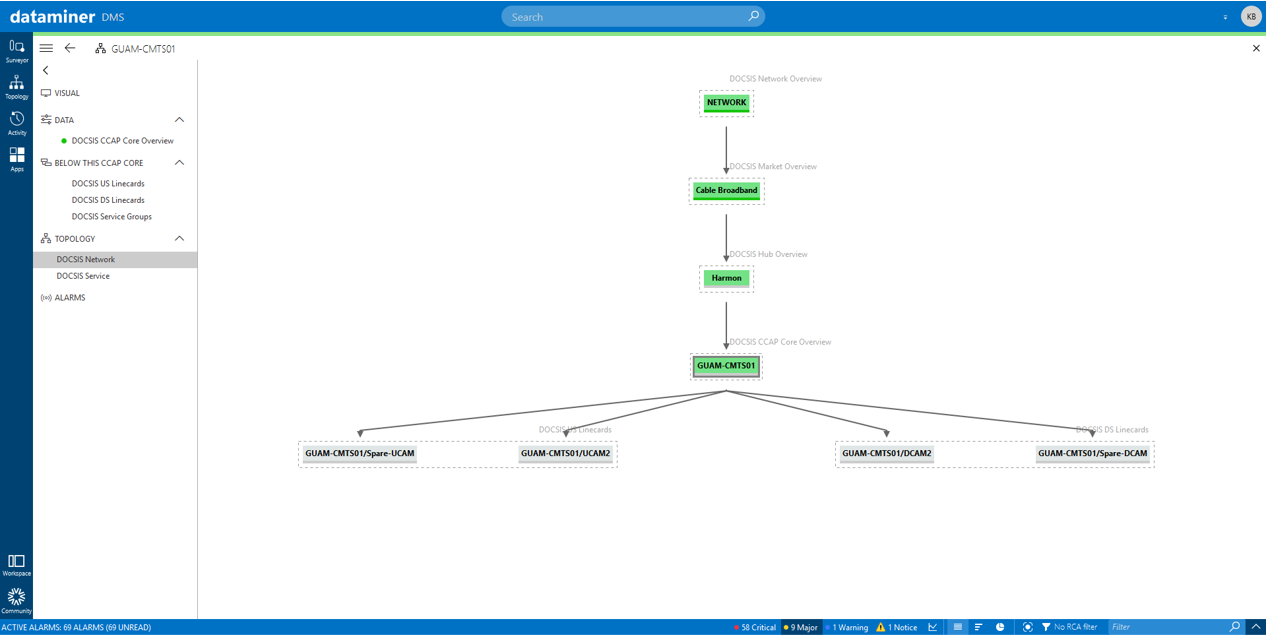
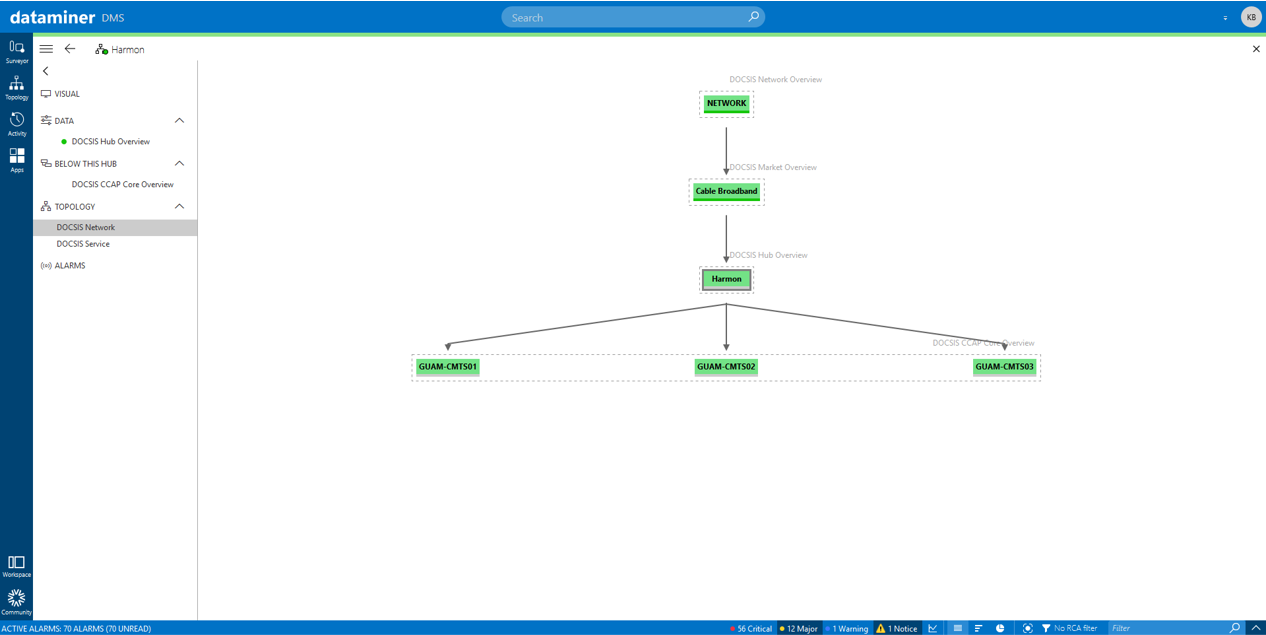 Network topology view visualizing for a given PoP the cable modem termination systems as it holds
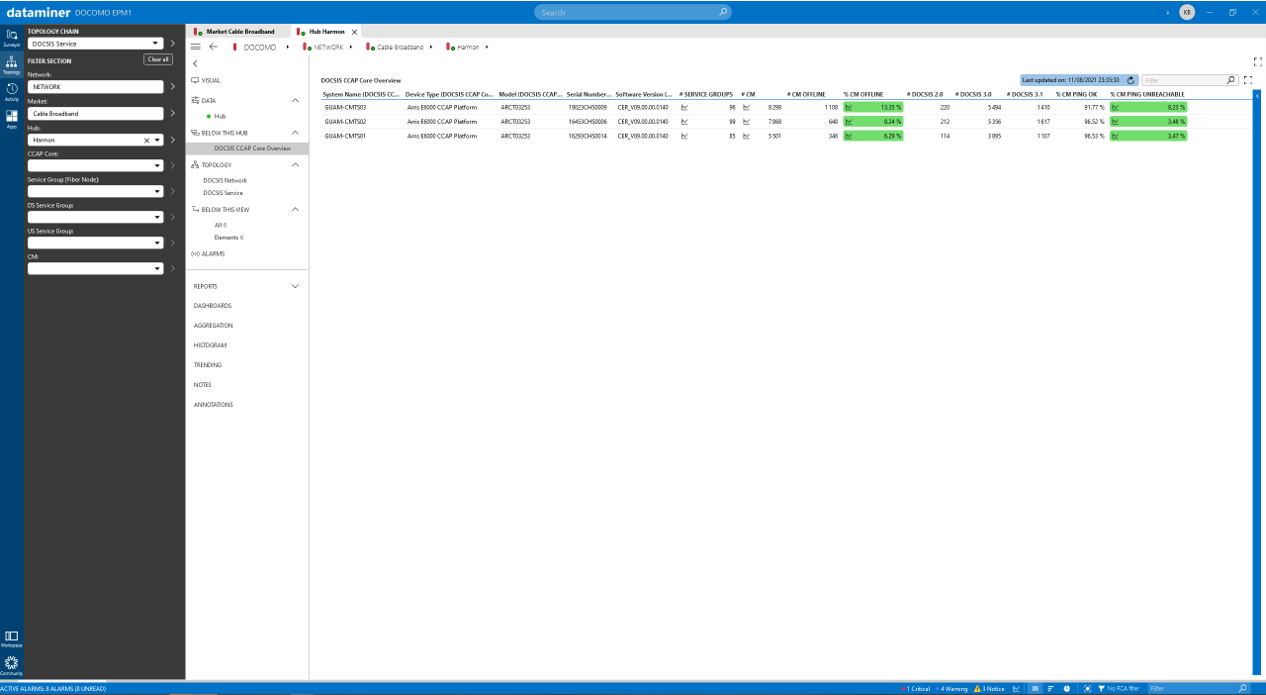 Hub service core overview with added detail related to the quantities of associated modems including information on the percentages that are offline and unreachable by ping.
 Topology visual with overview of the different downstream (DS) and upstream (US) line cards as present in a given cable modem termination system.
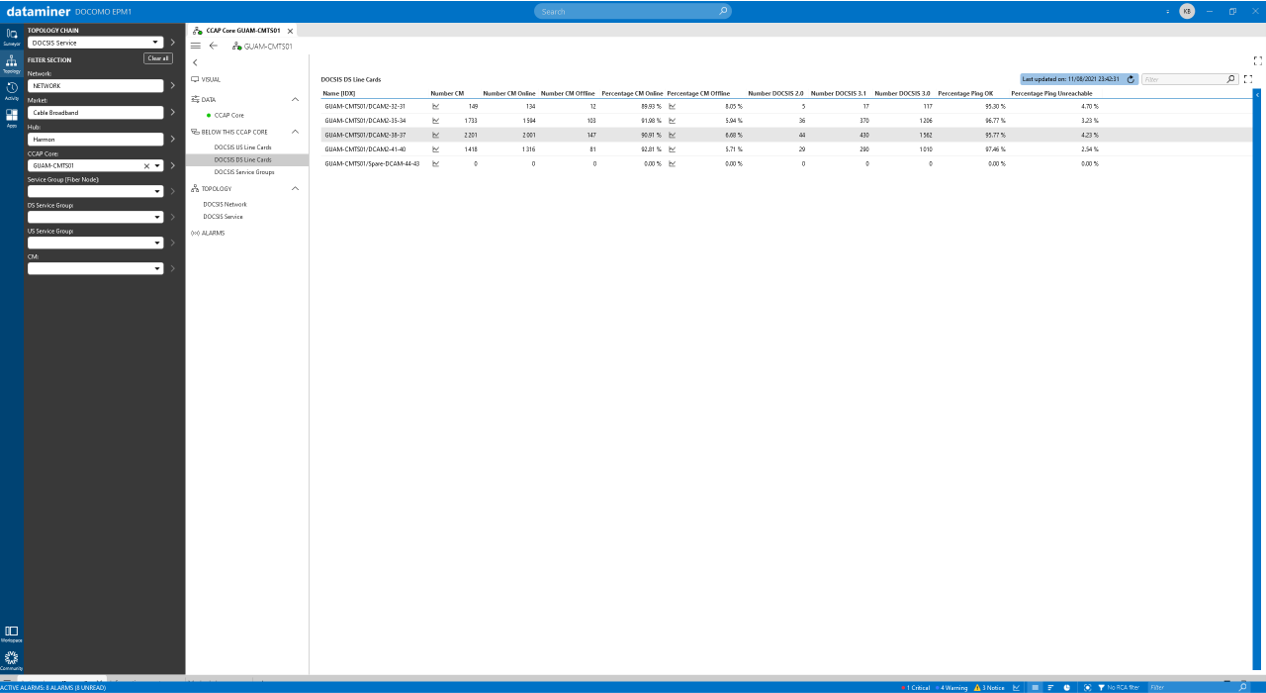 Service core downstream line card inventory
 Service core upstream line card inventory
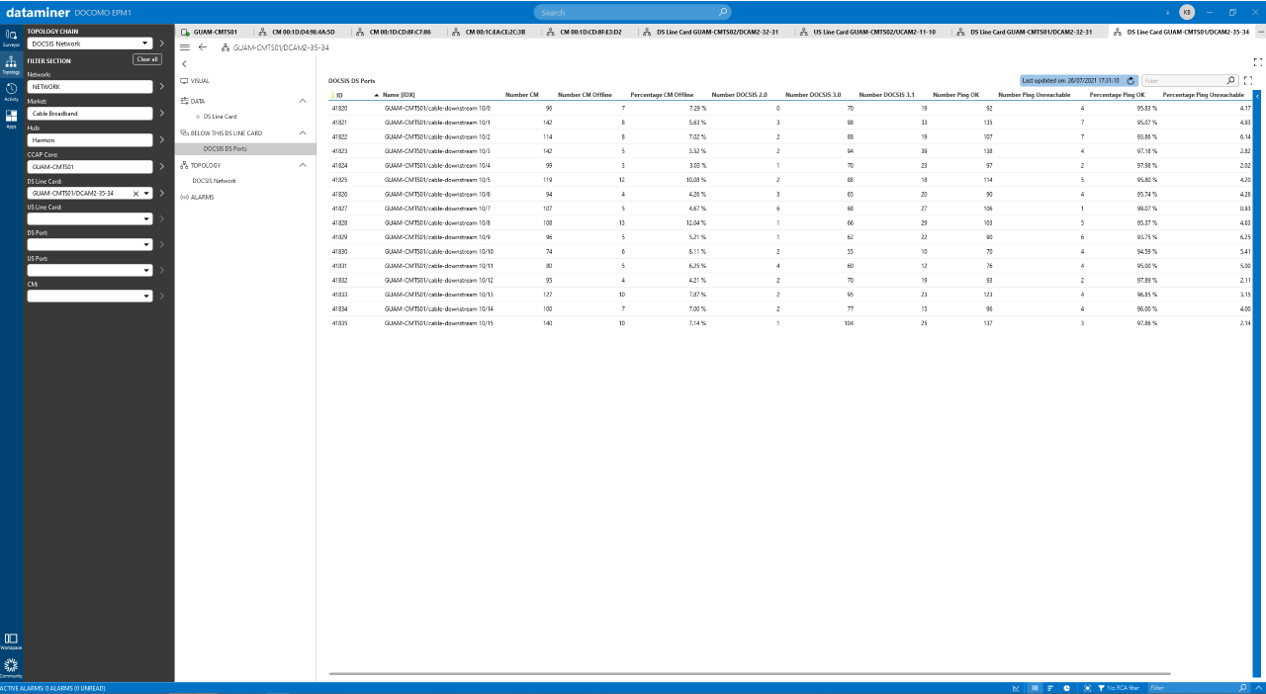 Overview of cable modem groups as associated with every port of a given CMTS DS line card
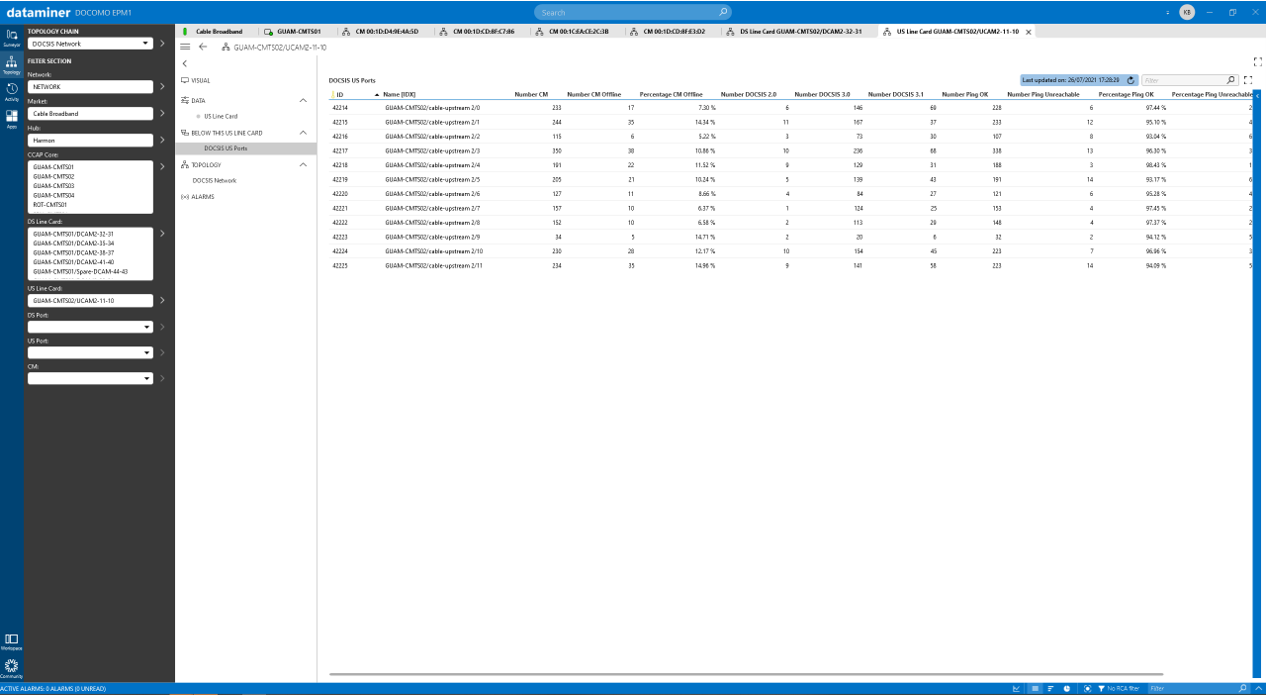 Overview of cable modem groups as associated with every port of a given CMTS US line card
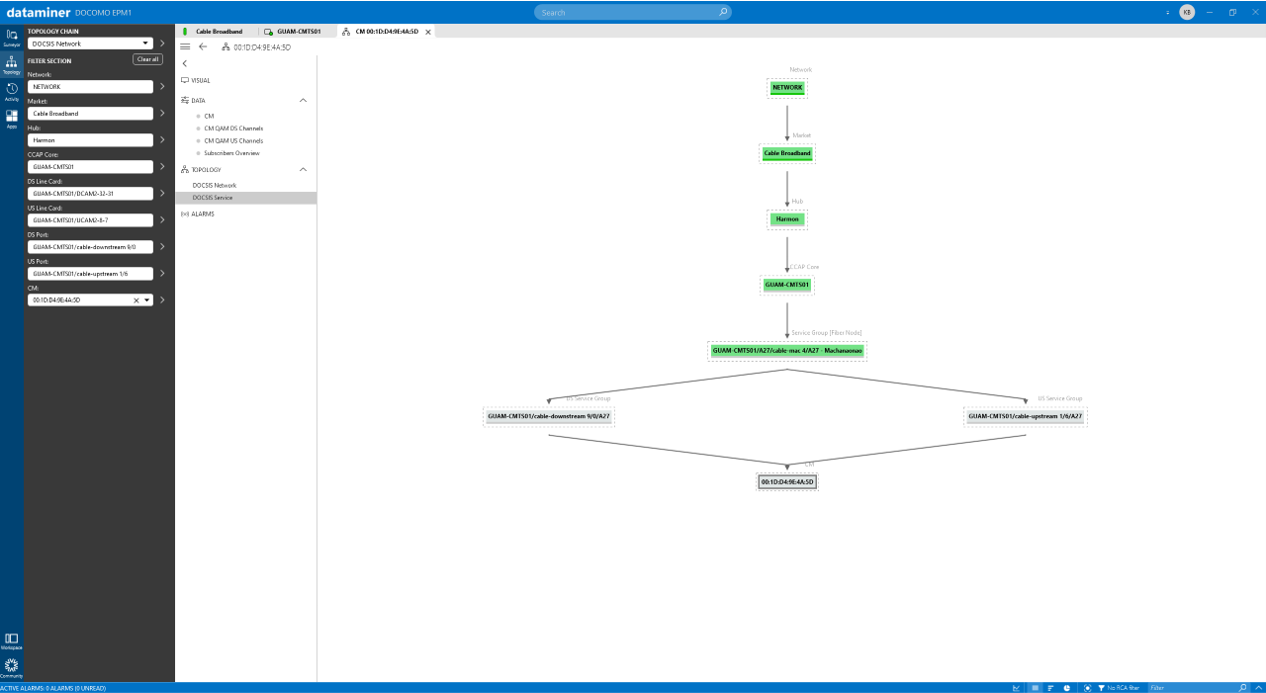
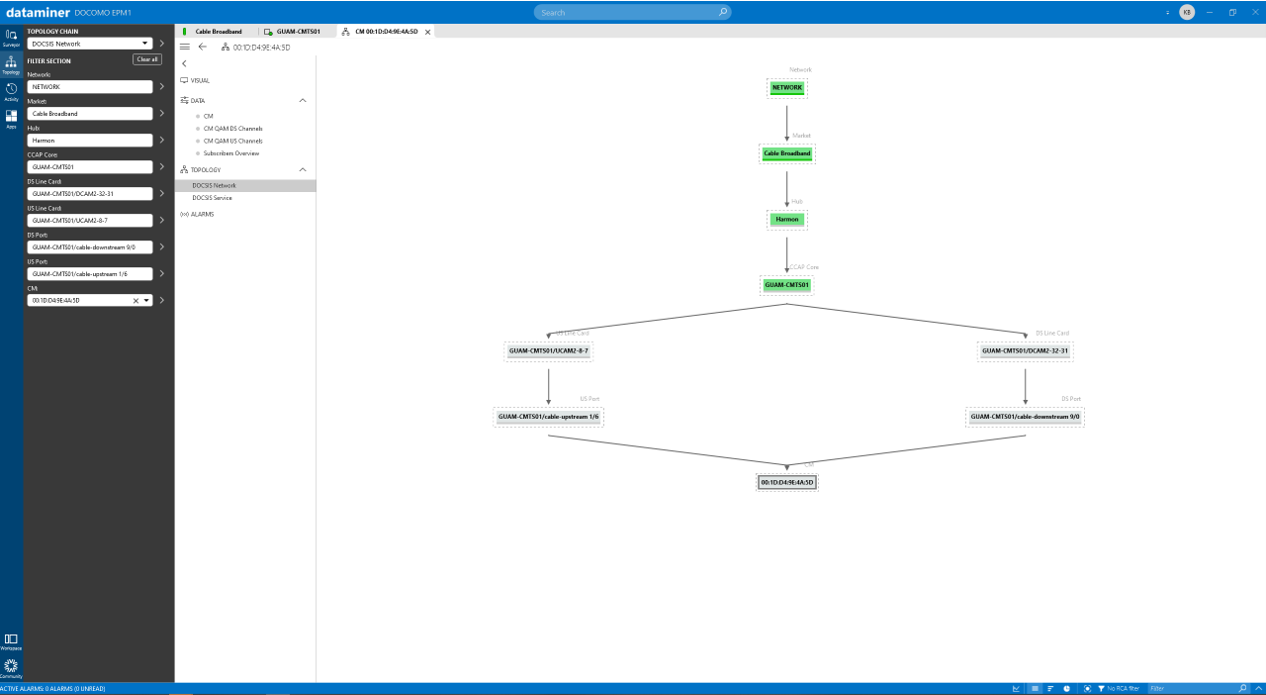 Network topology as applies to given cable modem/subscriber
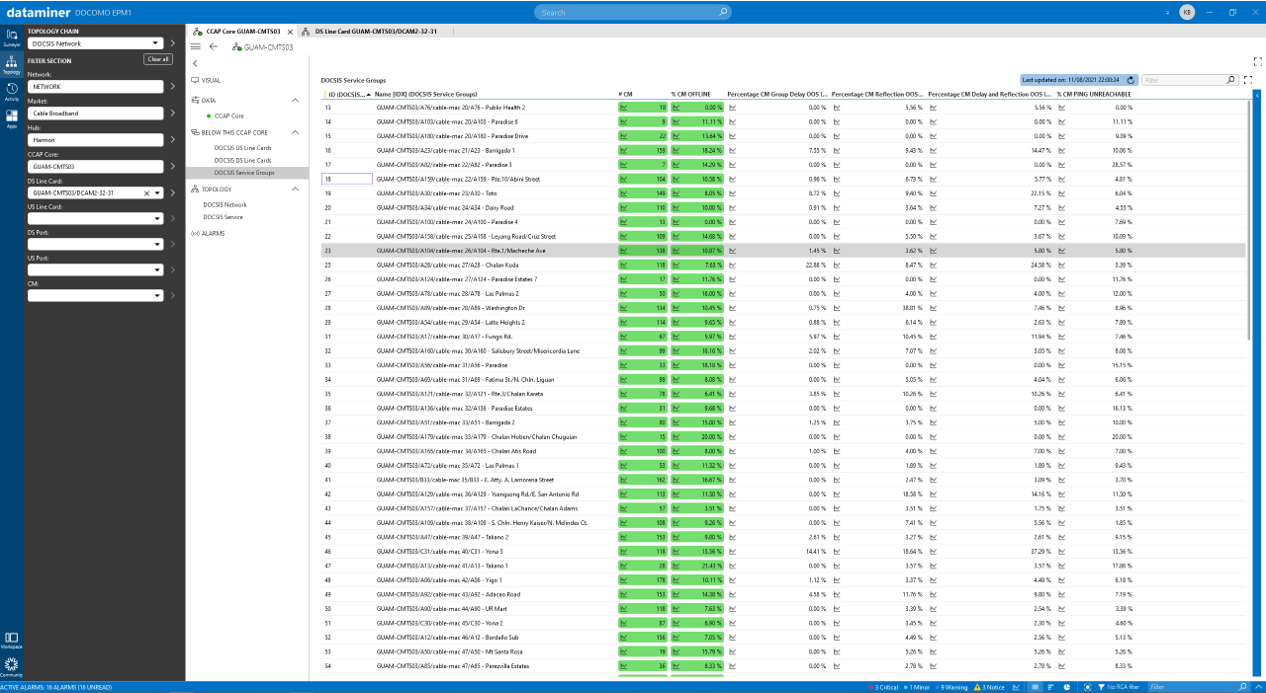 List of service groups associated with a port of a data core downstream line card, set up for visualization of added detail related to modem count, percentage offline and impact by group delay or reflection (DOCSIS 3.0 PNM)
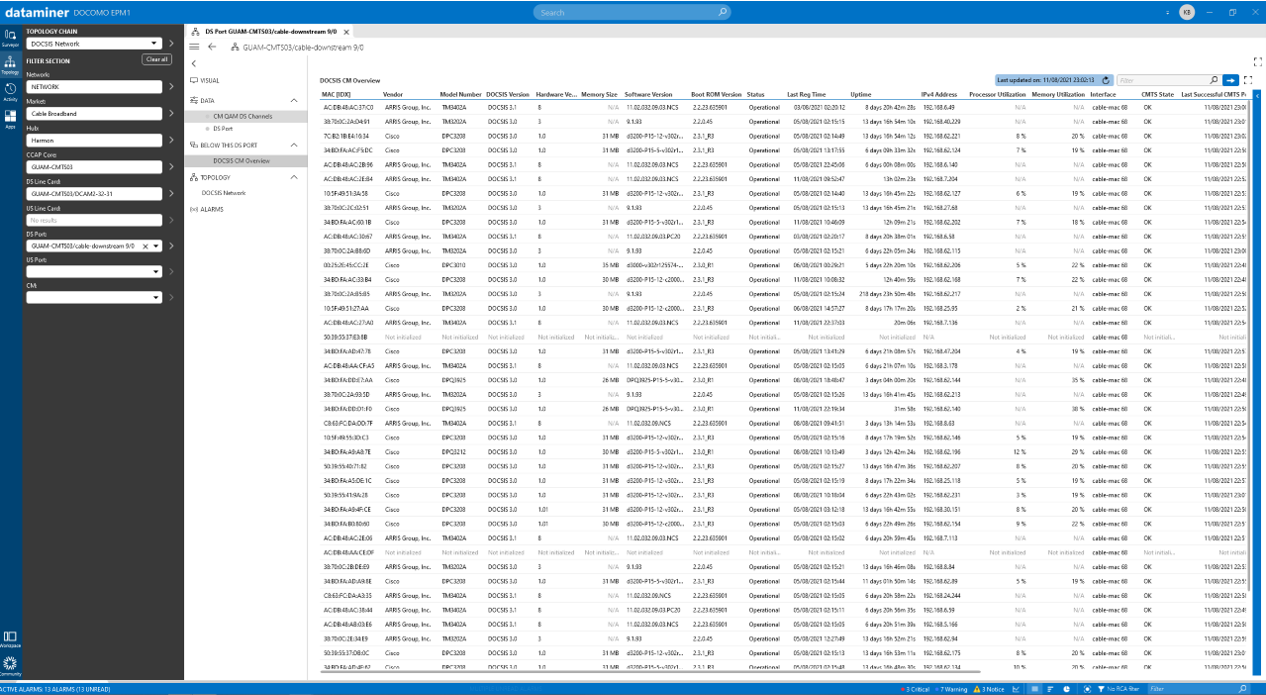 Overview of the cable modems registered under a port of specific downstream line card.
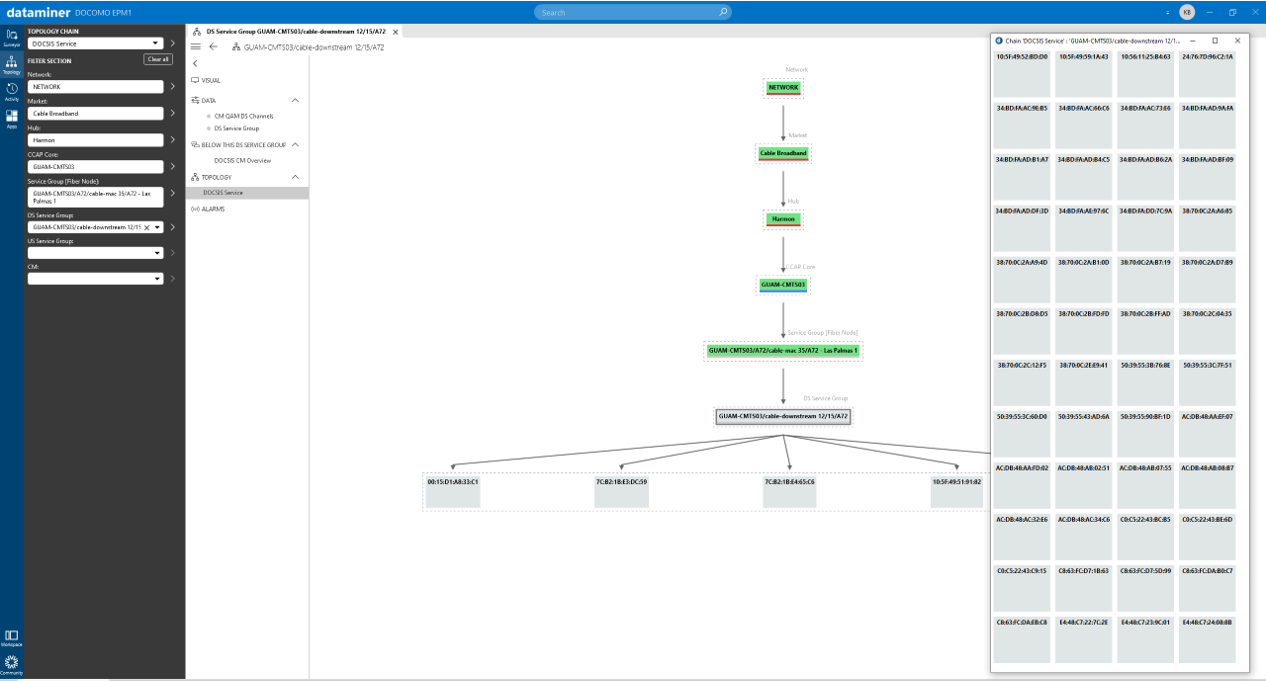
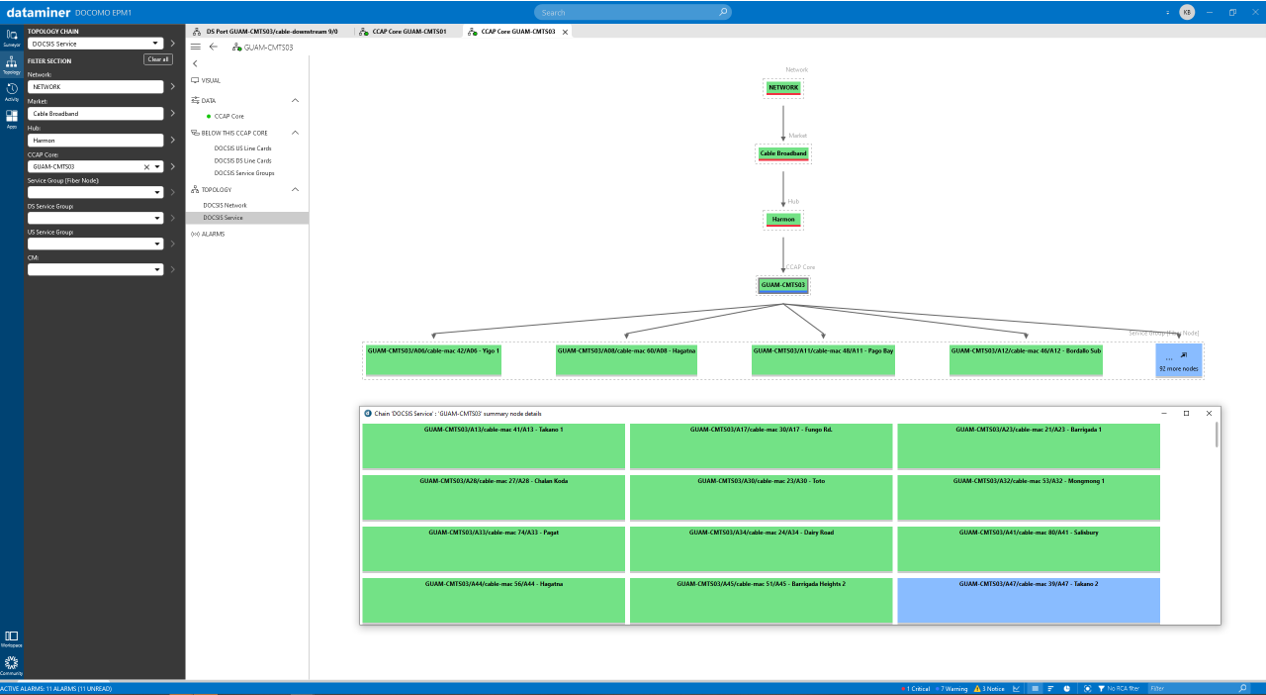 Service topology with visualization of the service groups associated with a specific site and core.
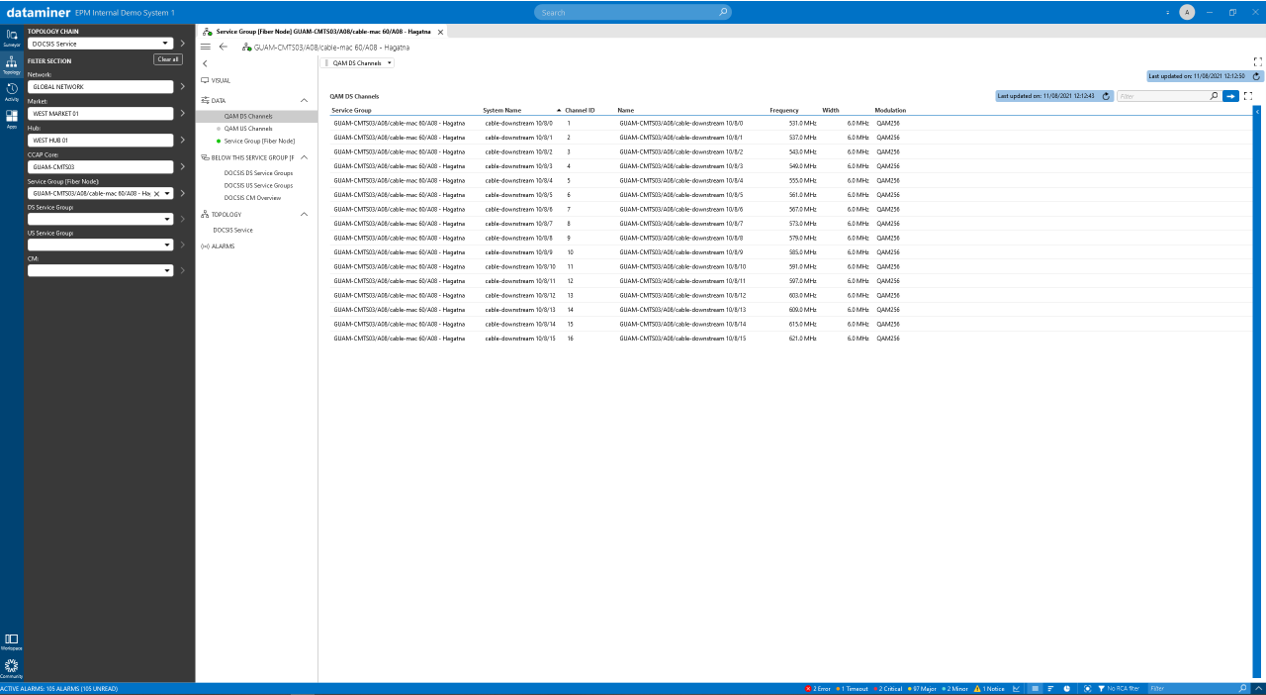 Visualization of the downstream QAM channels associated with a given data service group
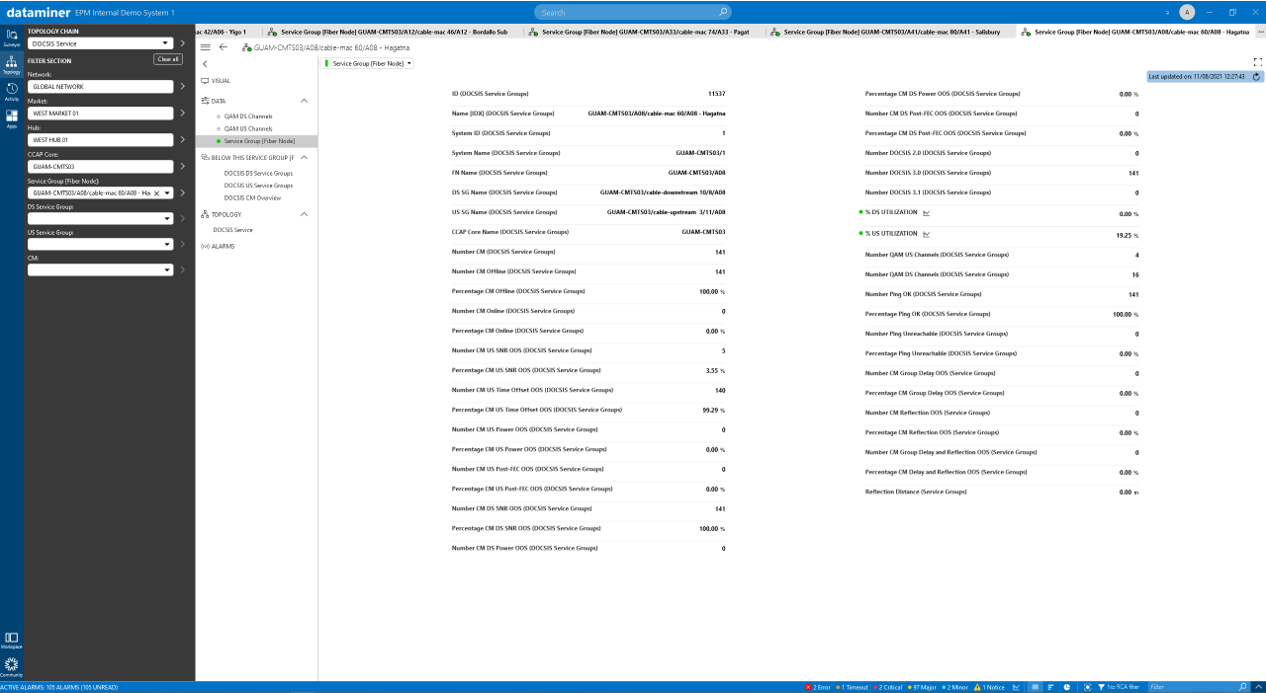 Service group KPI summary view
 Service topology for visualization of the list of modems as included in a given downstream service group
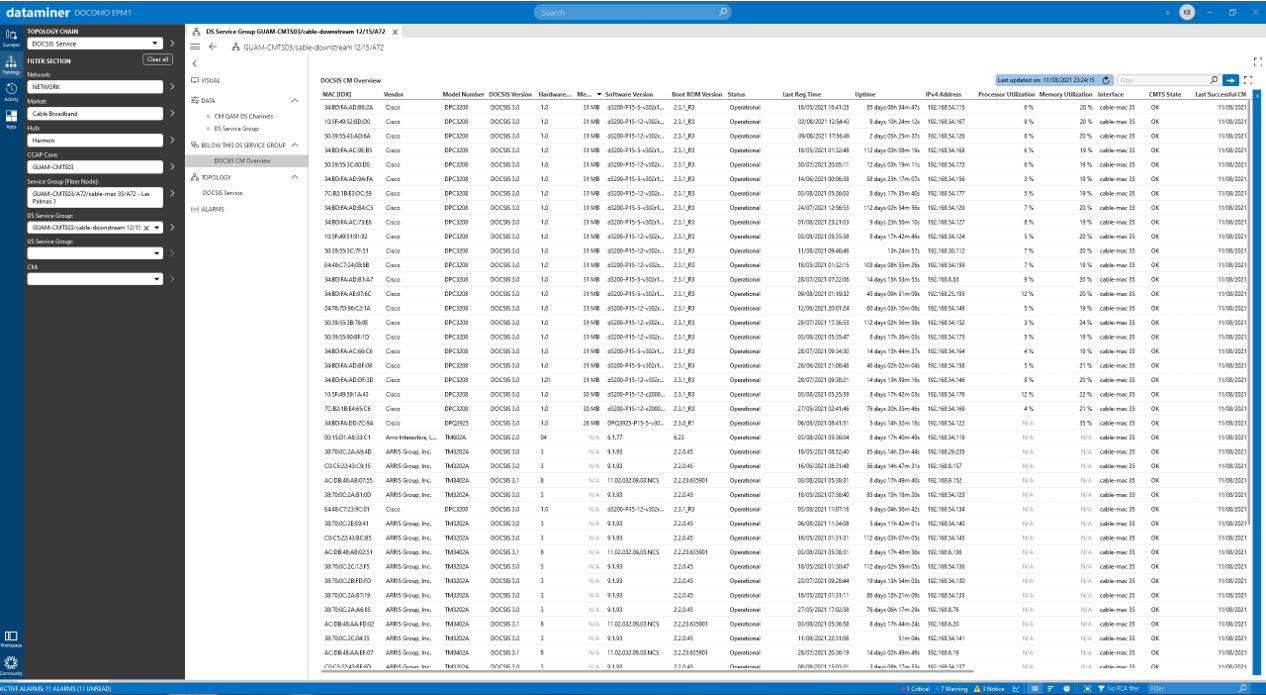 List view for visualization of modems as included in a given downstream service group
 Service topology as applies to given cable modem/subscriber
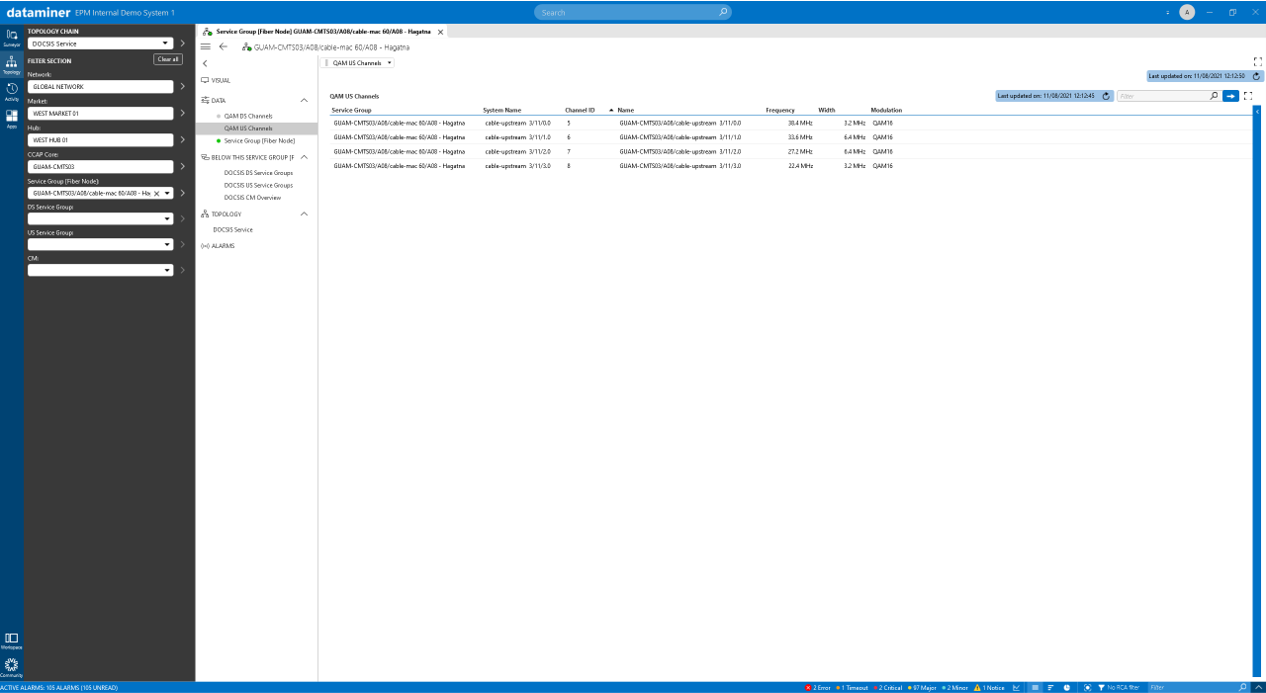 Visualization of the upstream QAM channels associated with a given data service group
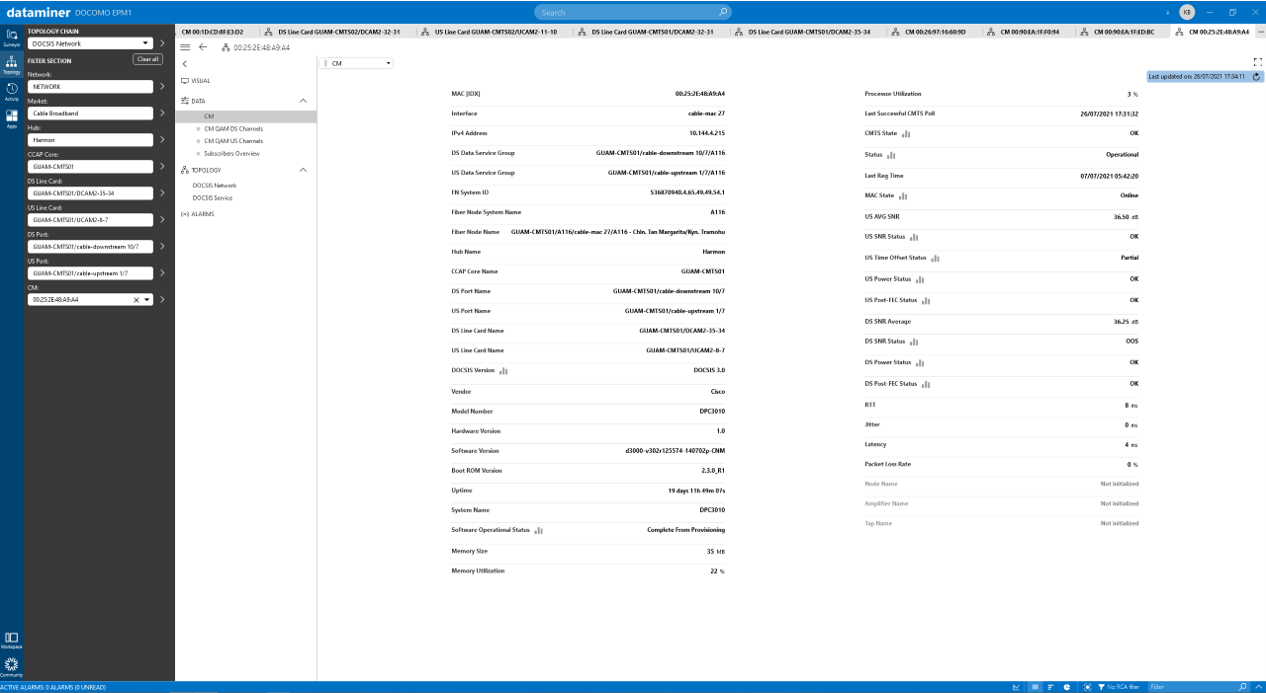 Cable modem overview visual including information related to the vendor, type, firmware version of the device itself, its memory and cpu utilization, its CMTS connectivity as well as e.g. ping latency and jitter status
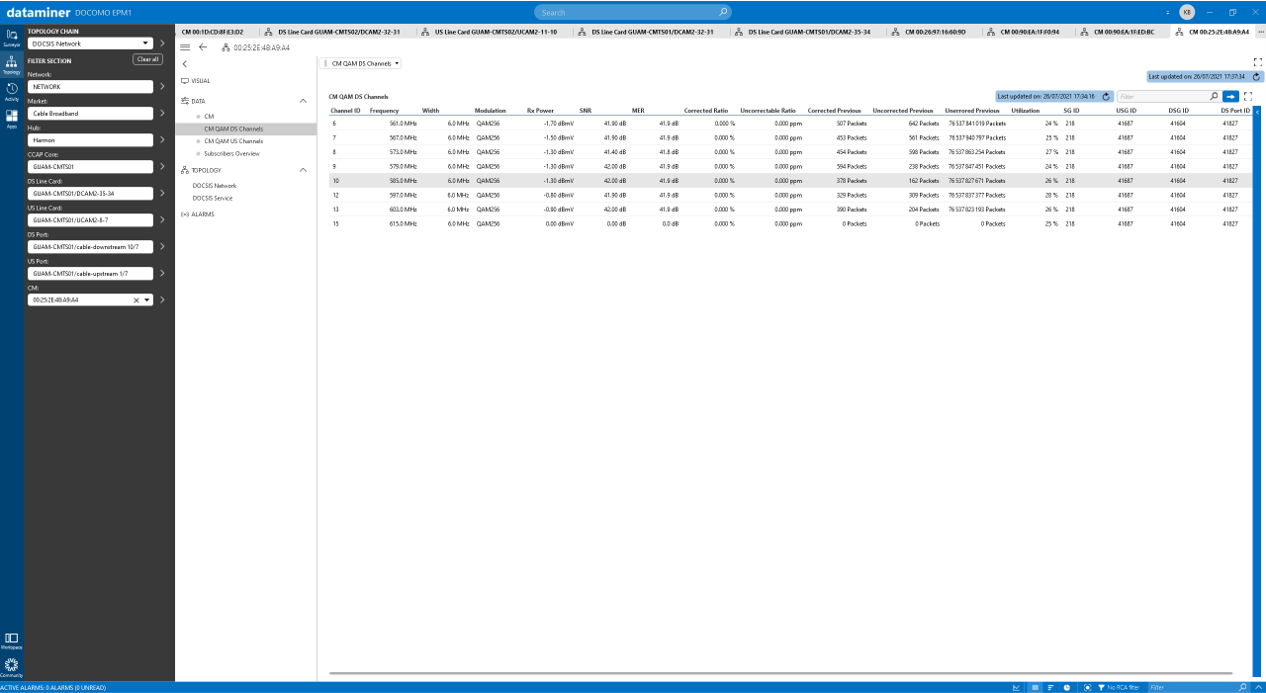 Overview of the downstream channels as associated with a given cable modem added all relevant KPI's related to the characteristics (e.g. RX level) , quality (e.g. MER) , integrity (corrected packets, uncorrectable packets) and utilisation (in %) of each of these.
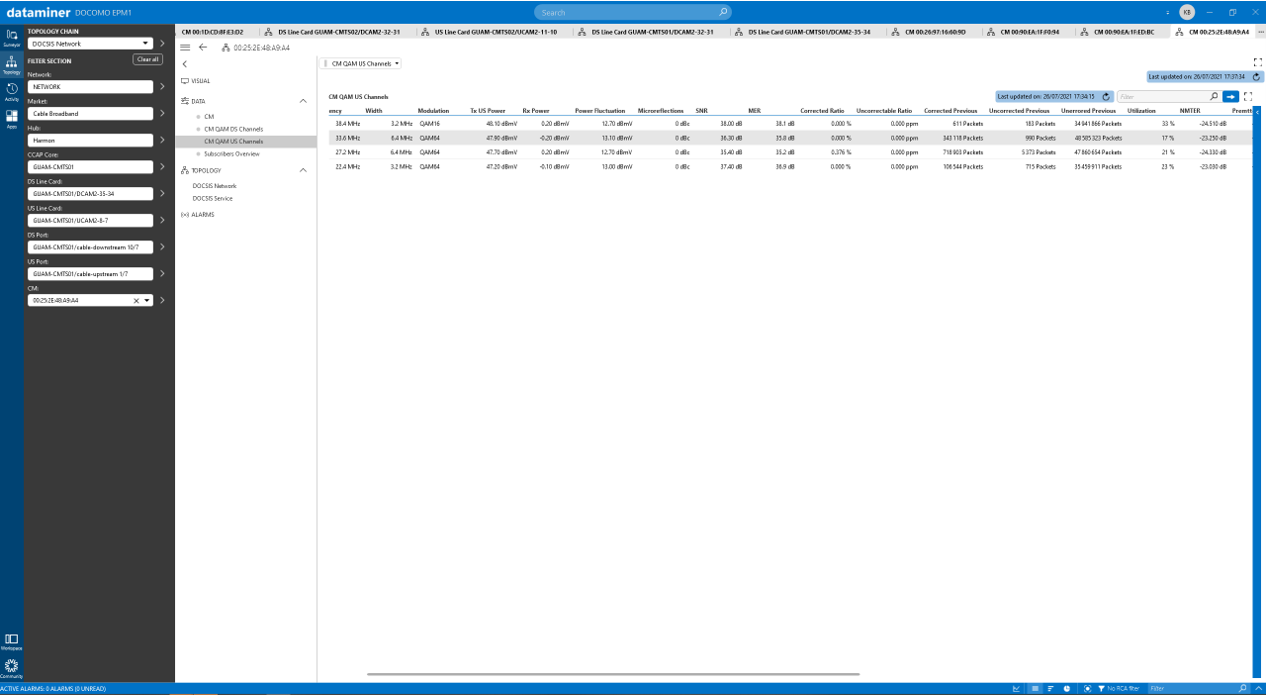 Overview of the upstream channels as associated with a given cable modem added all relevant KPI's related to the characteristics (e.g. Tx/Rx level) , quality (e.g. MER) , integrity (corrected packets, uncorrectable packets) and utilization (in %) of each of these.
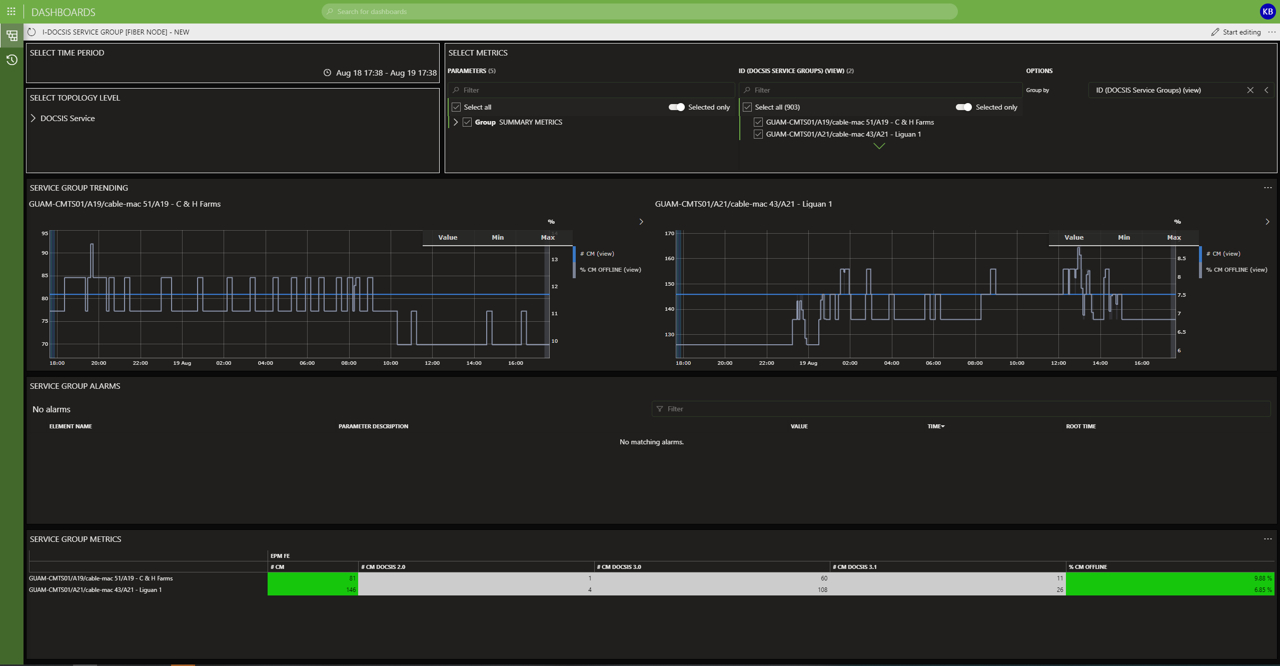 Service group dashboard
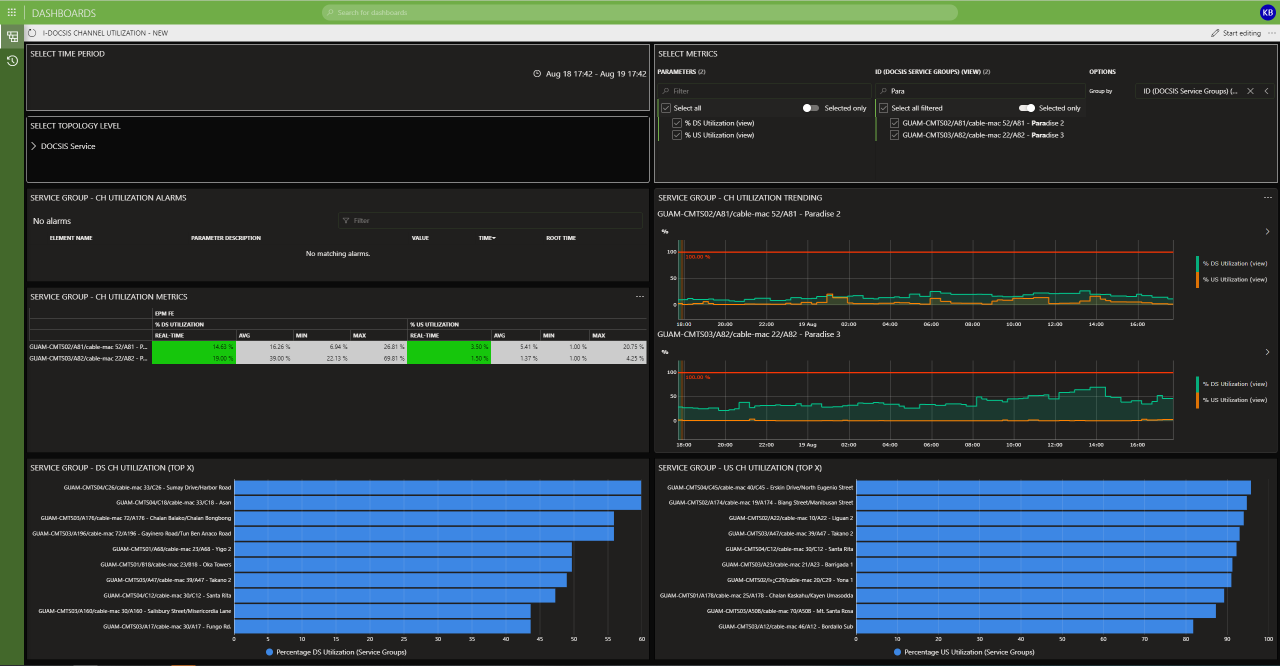 Service group channel utilization dashboard incl. Top-X overview of service groups with highest channel utilization.
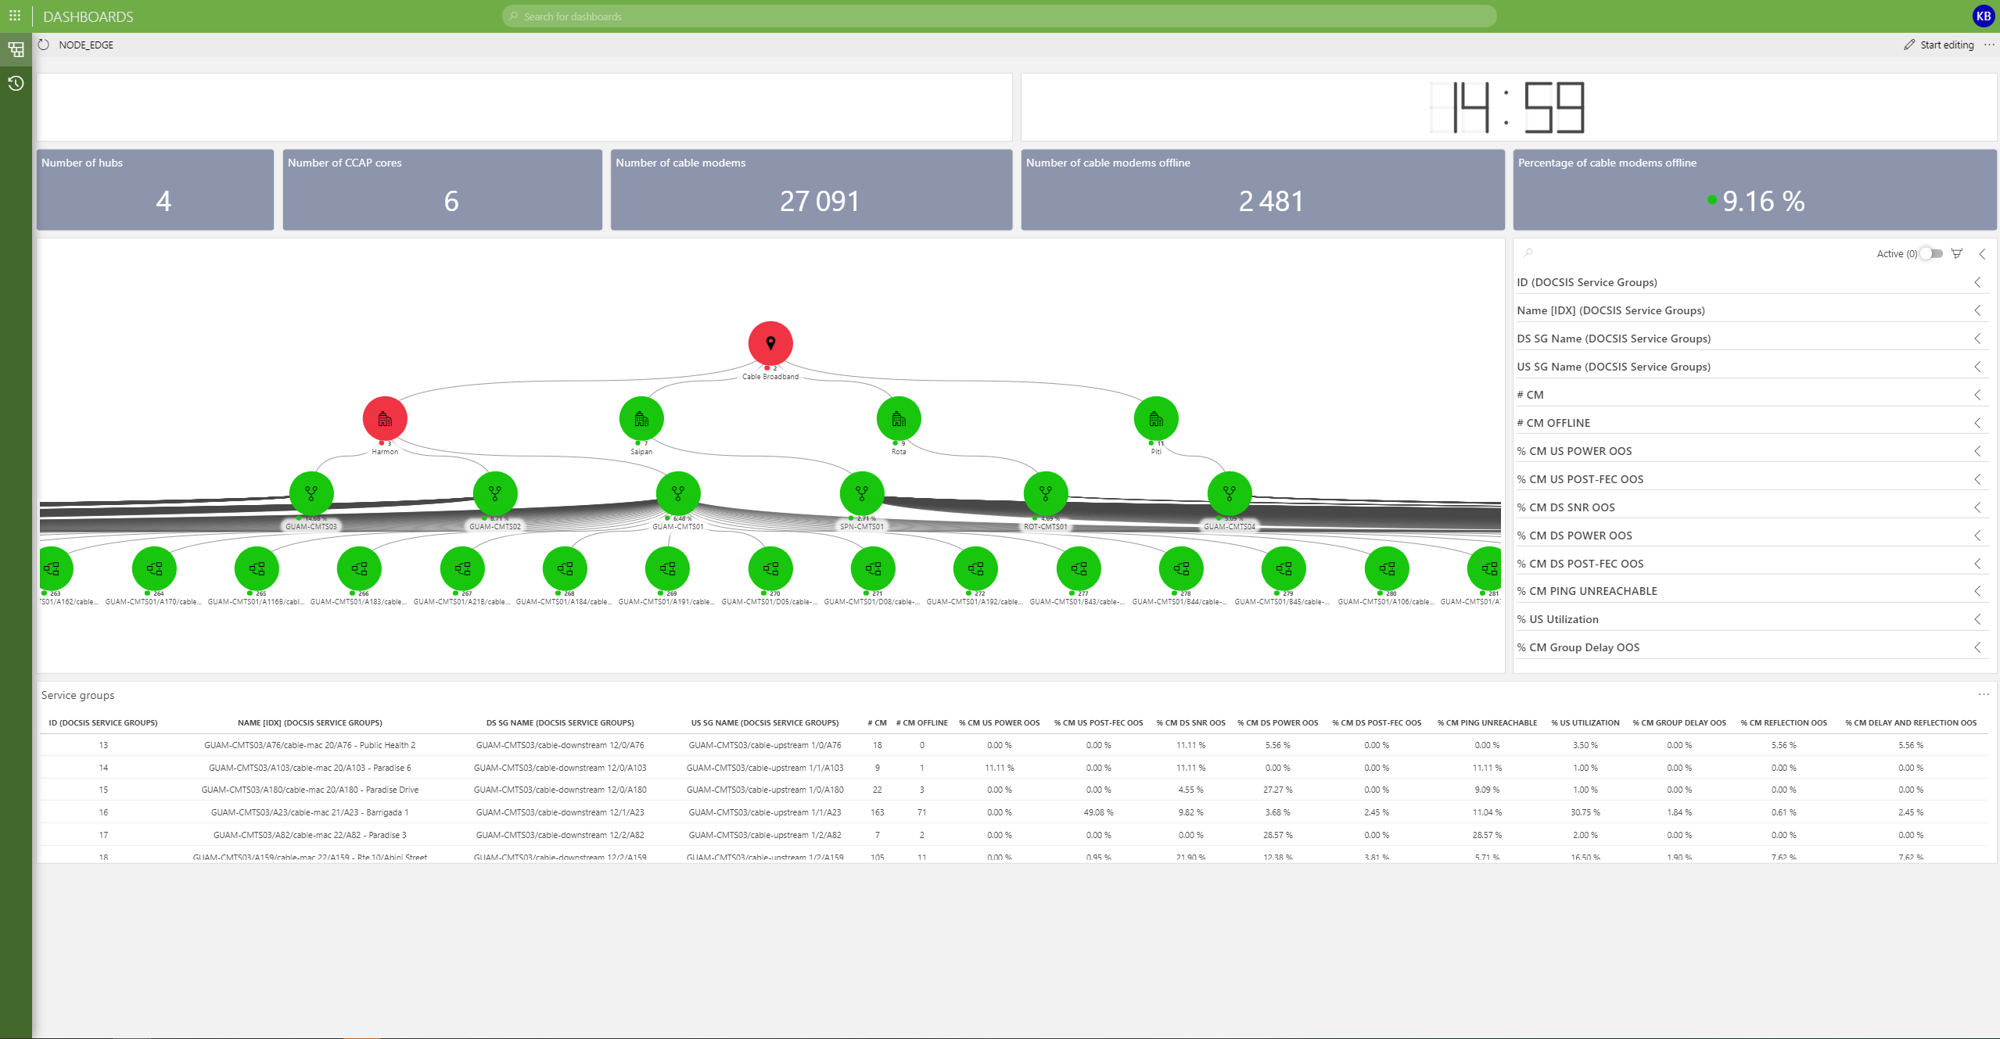
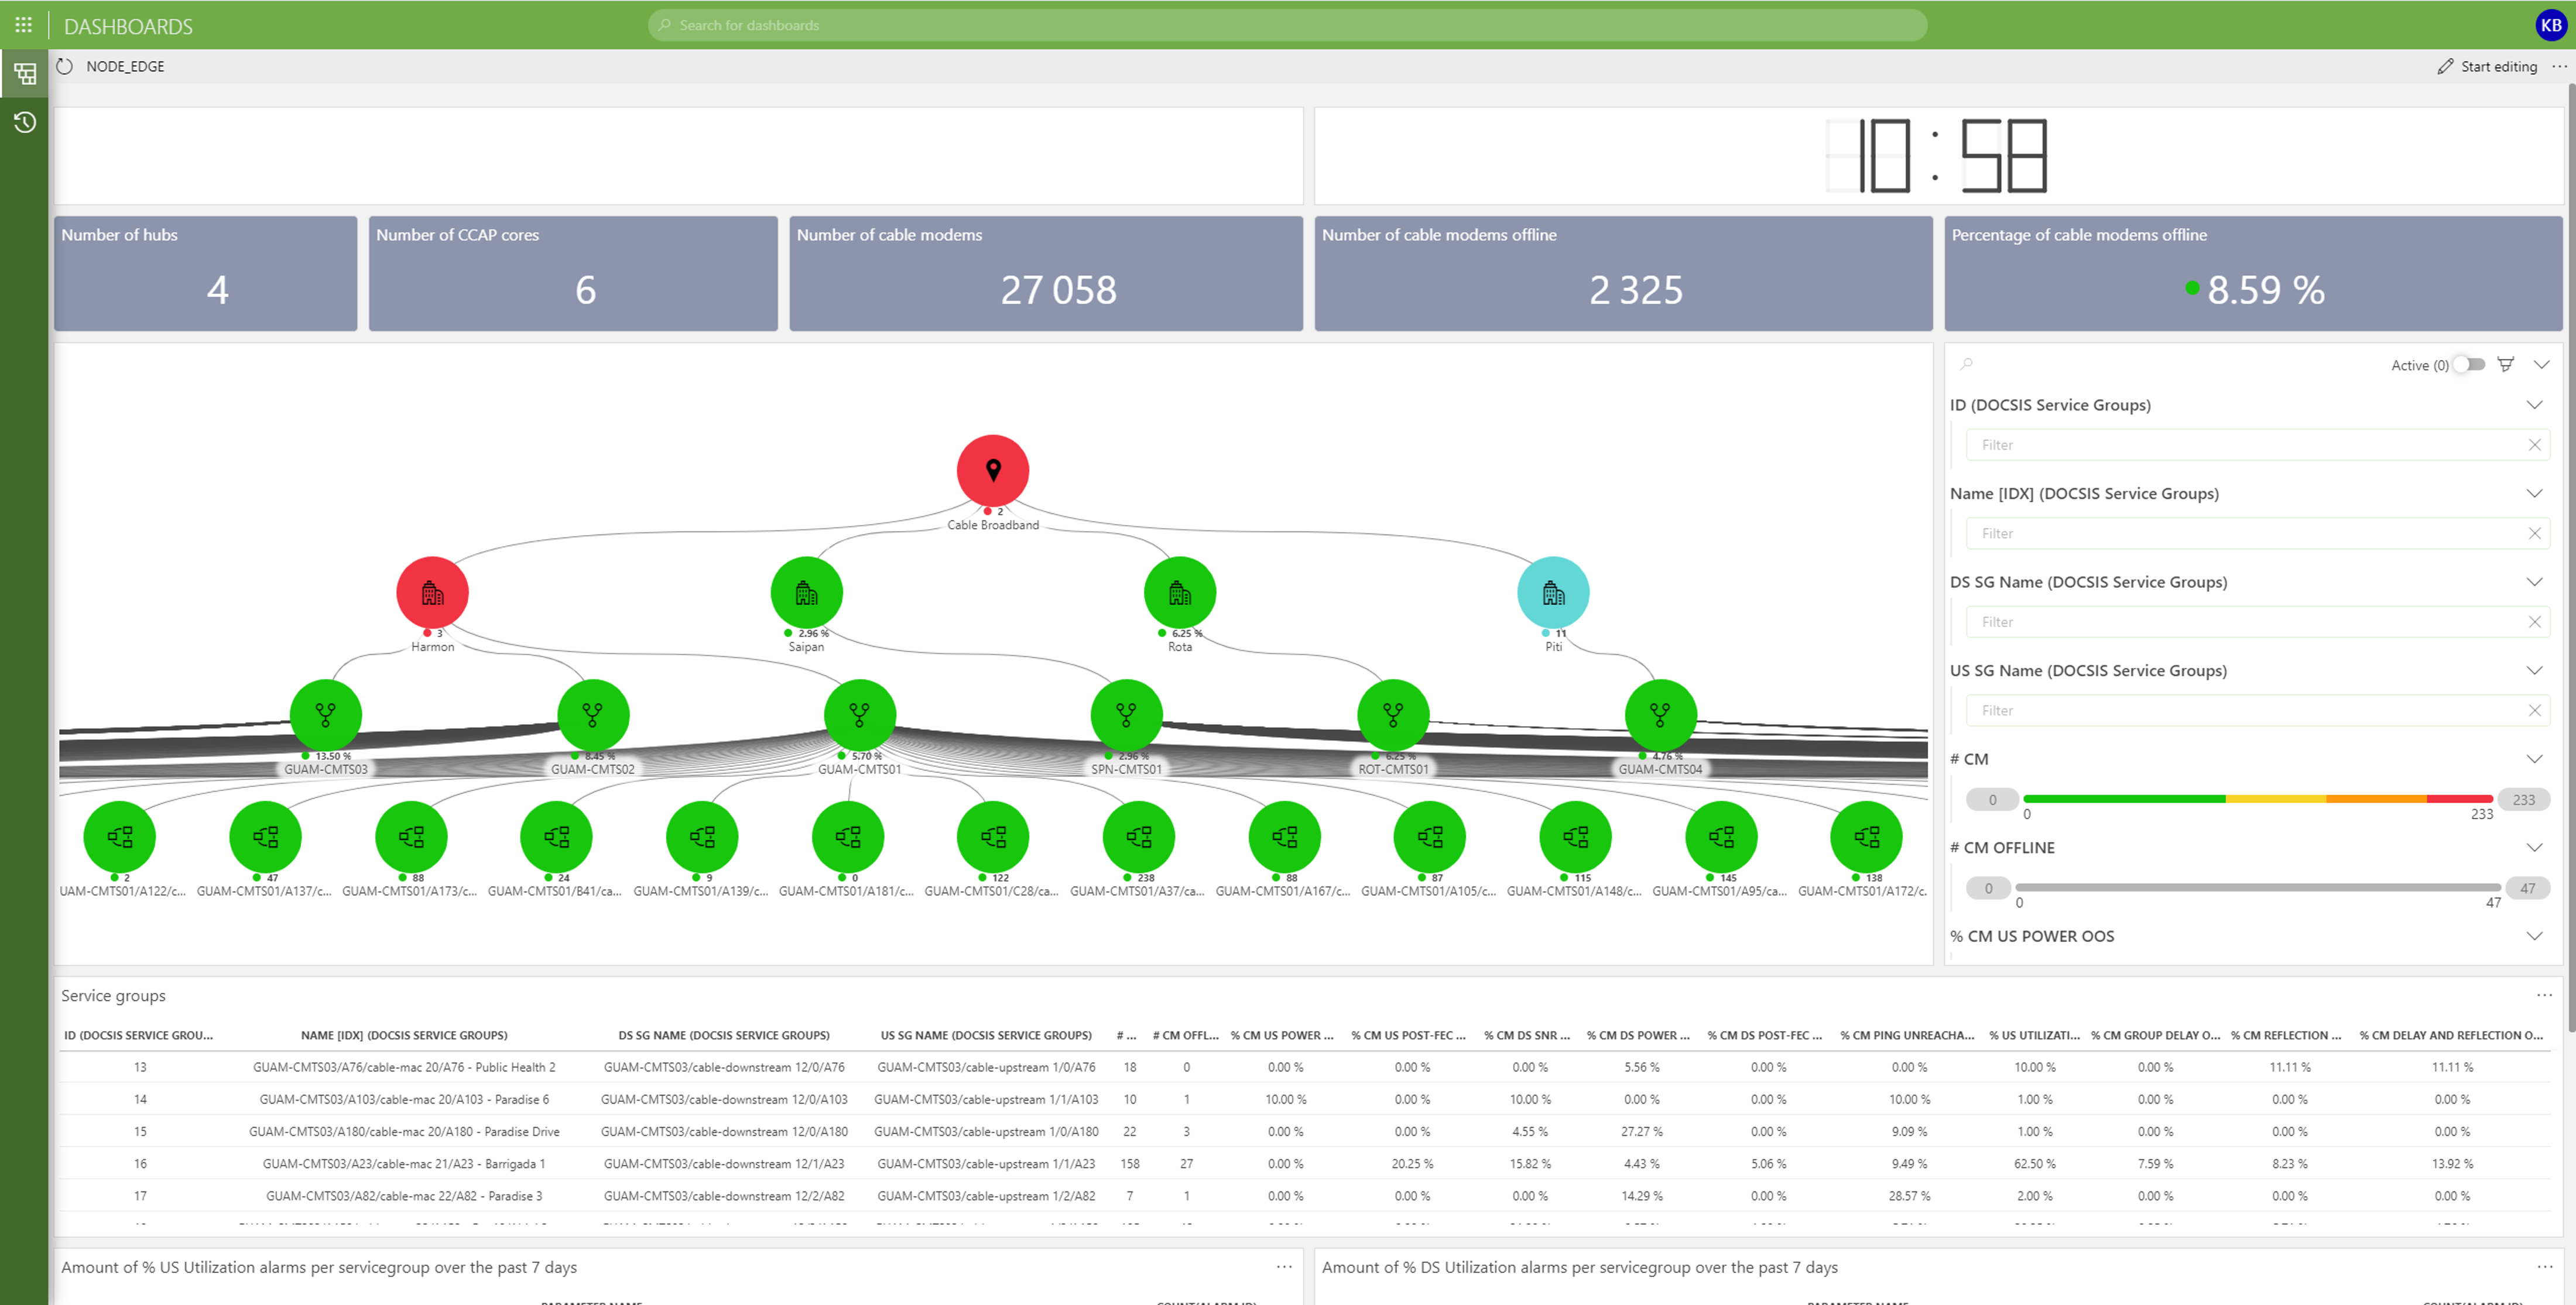 Visualization of the entire network using interactive dashboard. Default presenting information like structure, status, number of sites/cores/service groups/subs, service segments, etc. . Additional filtering using Generic Query Interface (GQI) component supporting visualization of e.g. service segments with modem quantity or channel utilization exceeding an arbitrary threshold, impacted by group delay, reflection or …. Supporting key workflows associated with network segmentation, capacity planning, plant realignment or proactive network maintenance.
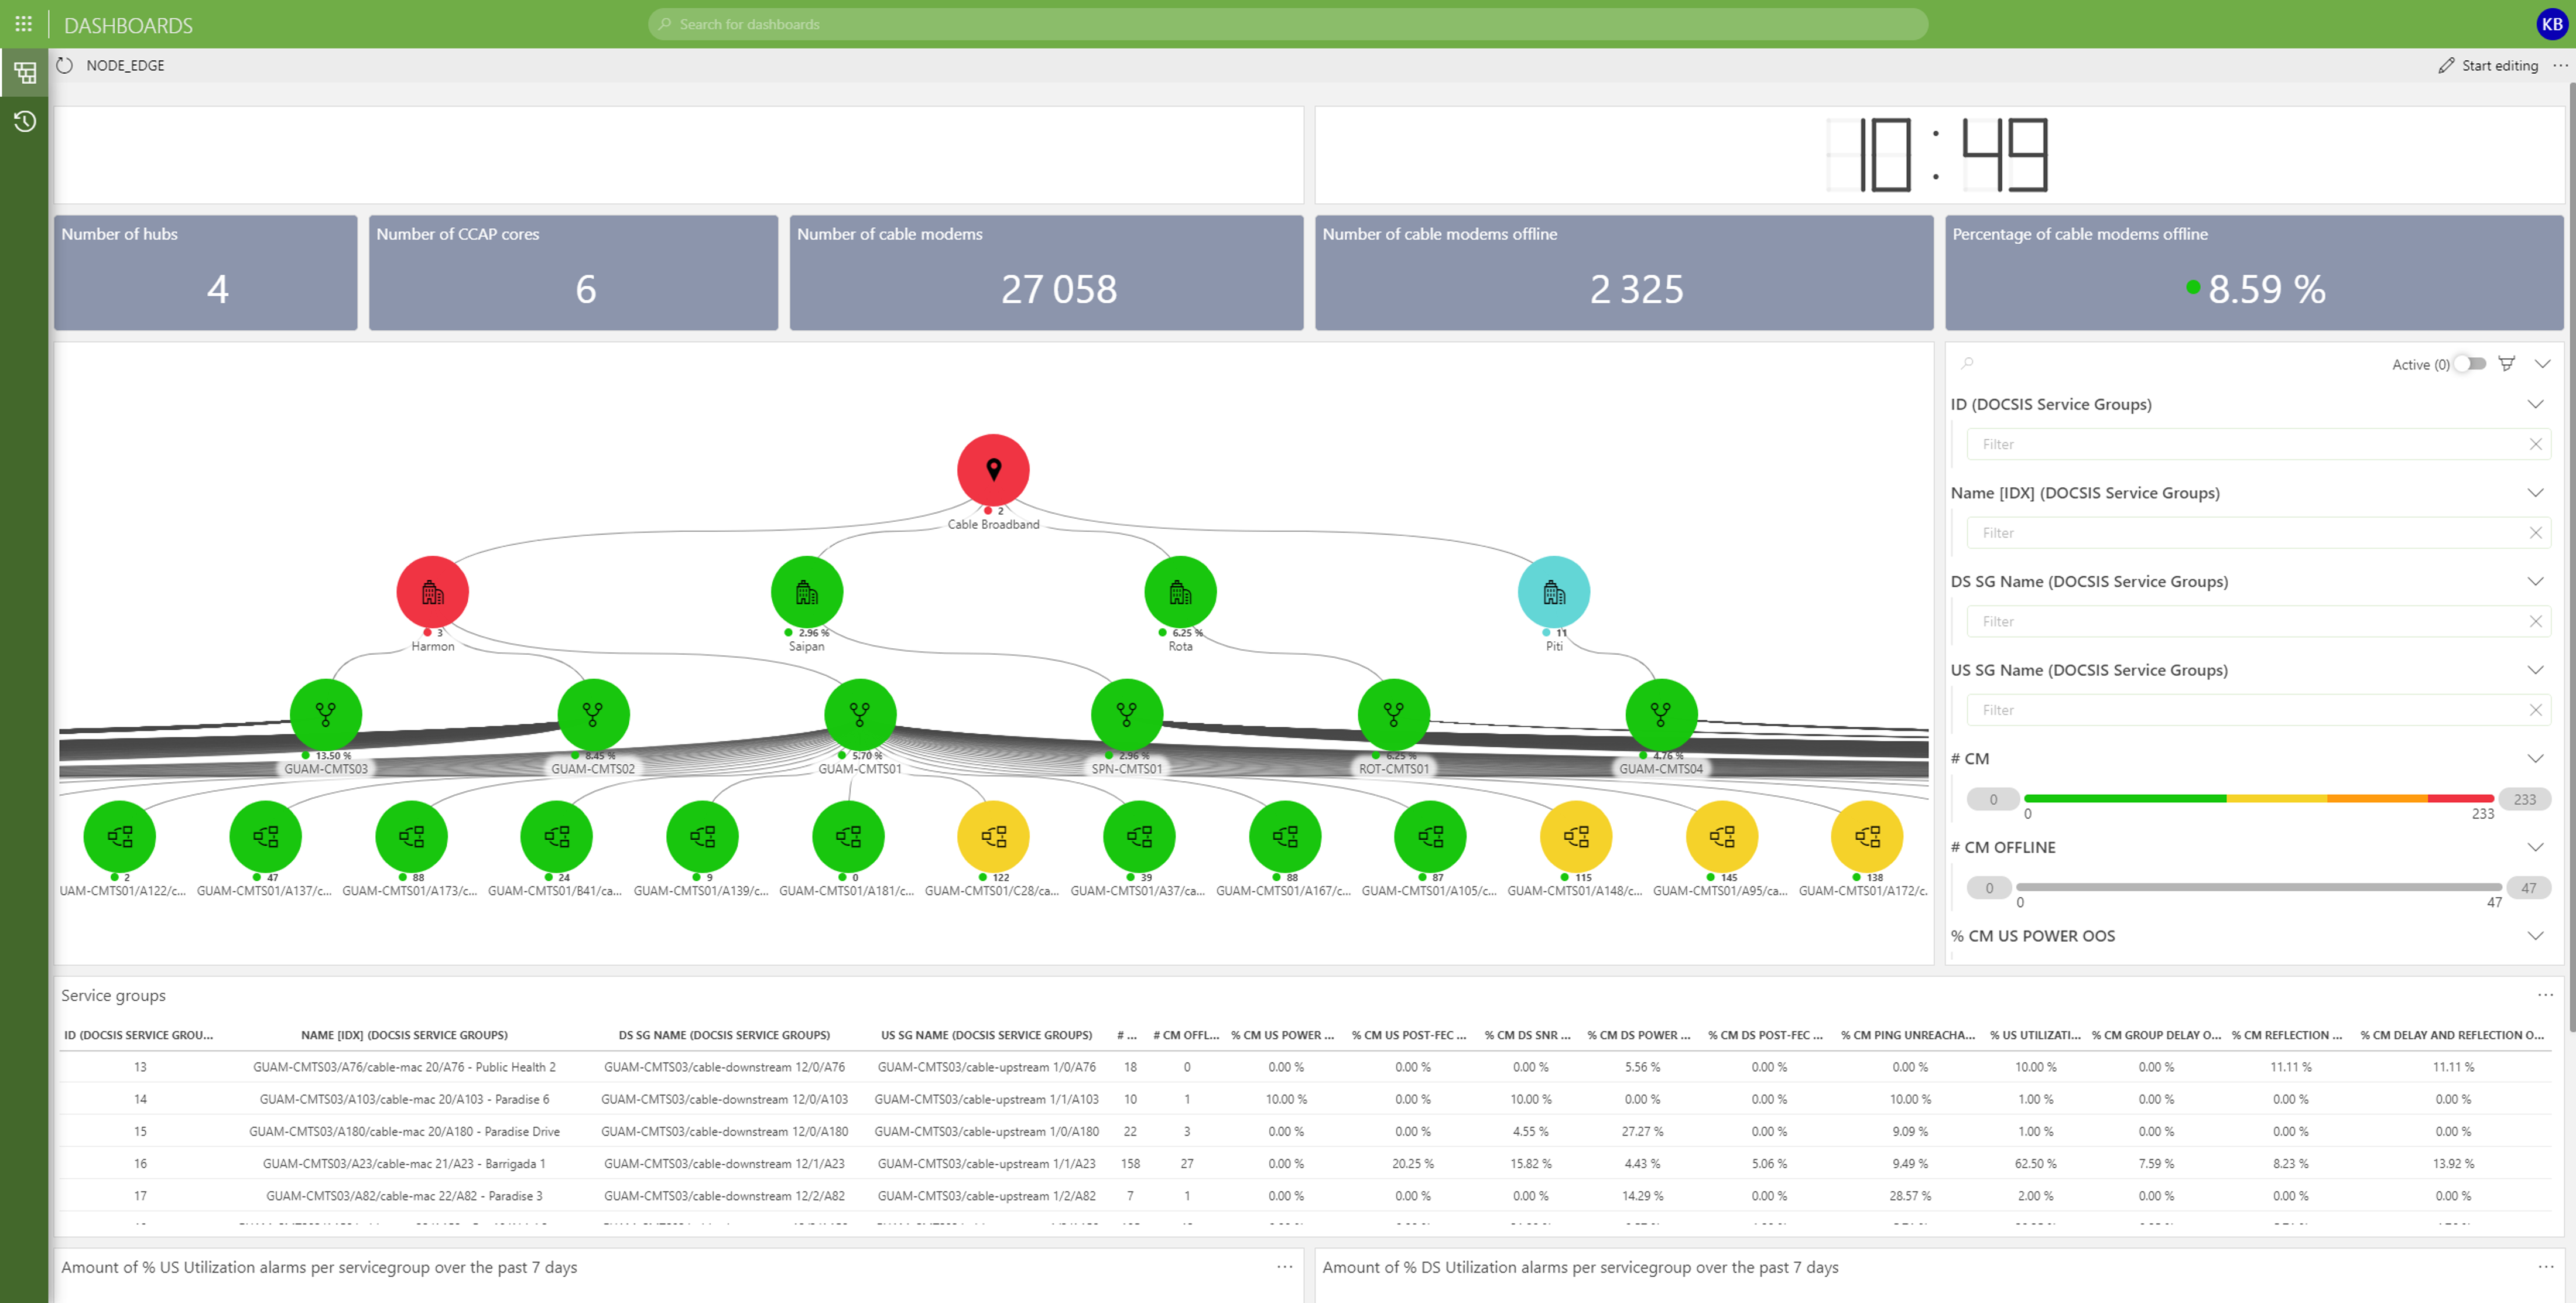 Visualization of the entire network using interactive dashboard, applied on the service group level analytical coloring linked to modem count.
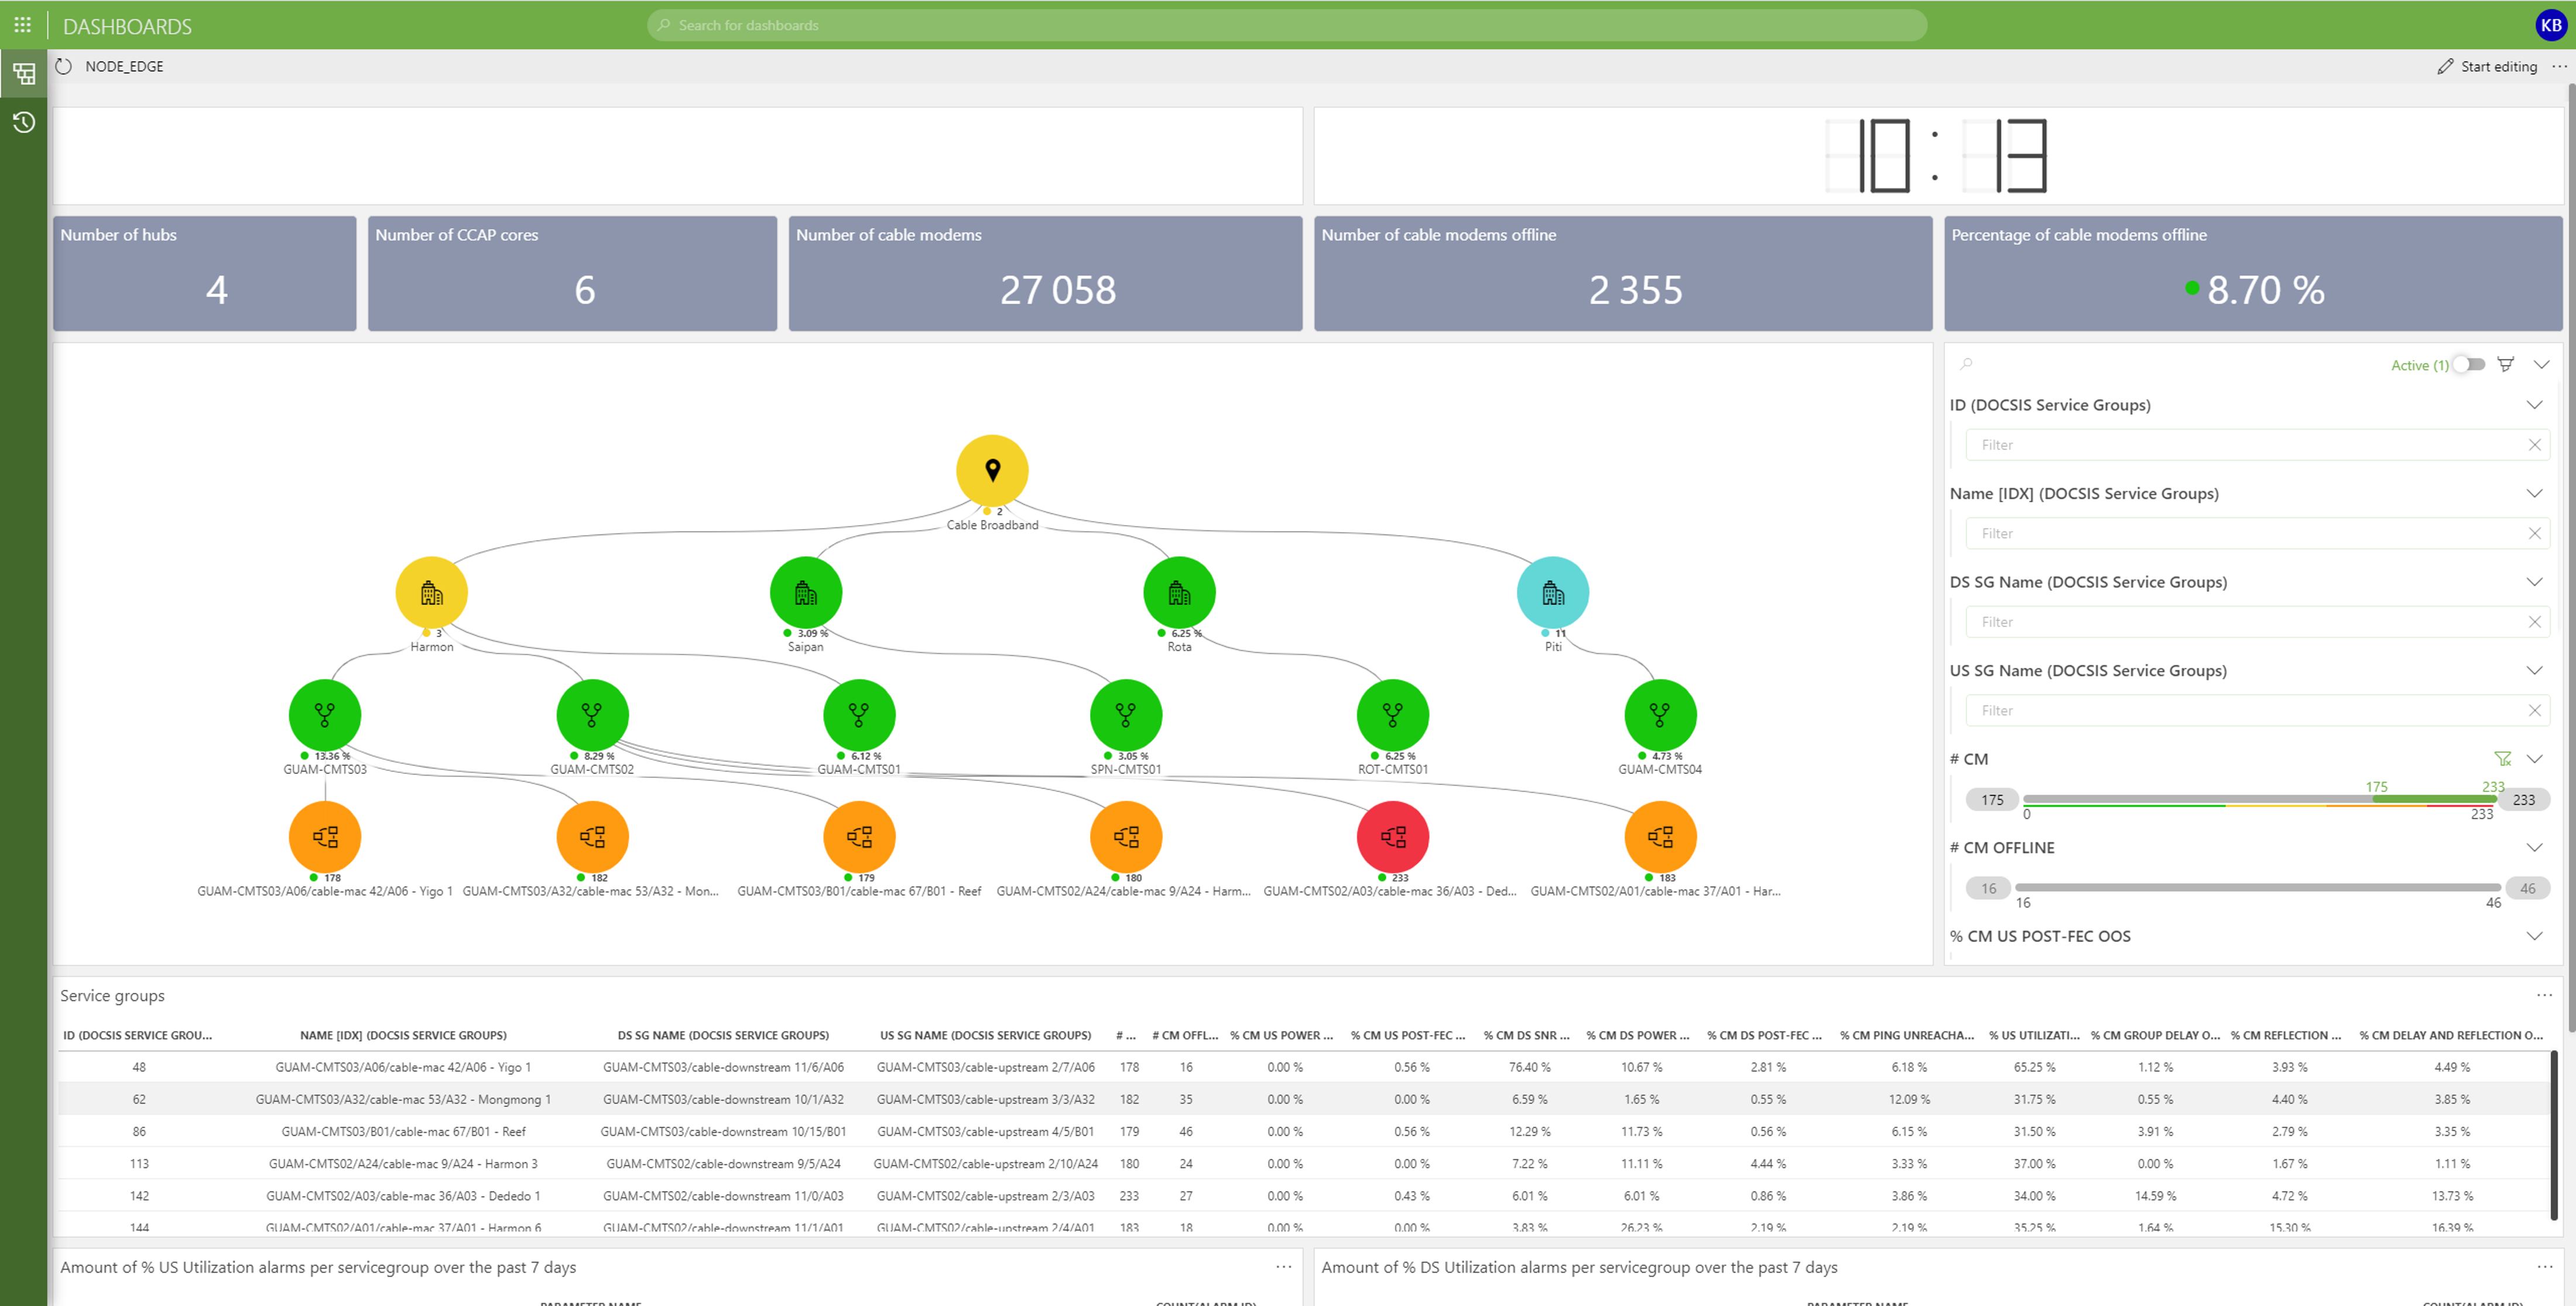 Visualization of the network using interactive dashboard, applied on the service group level analytical coloring linked to modem count as well as filtered the visualization of the service groups to show only these with a modem count of 175 or higher.
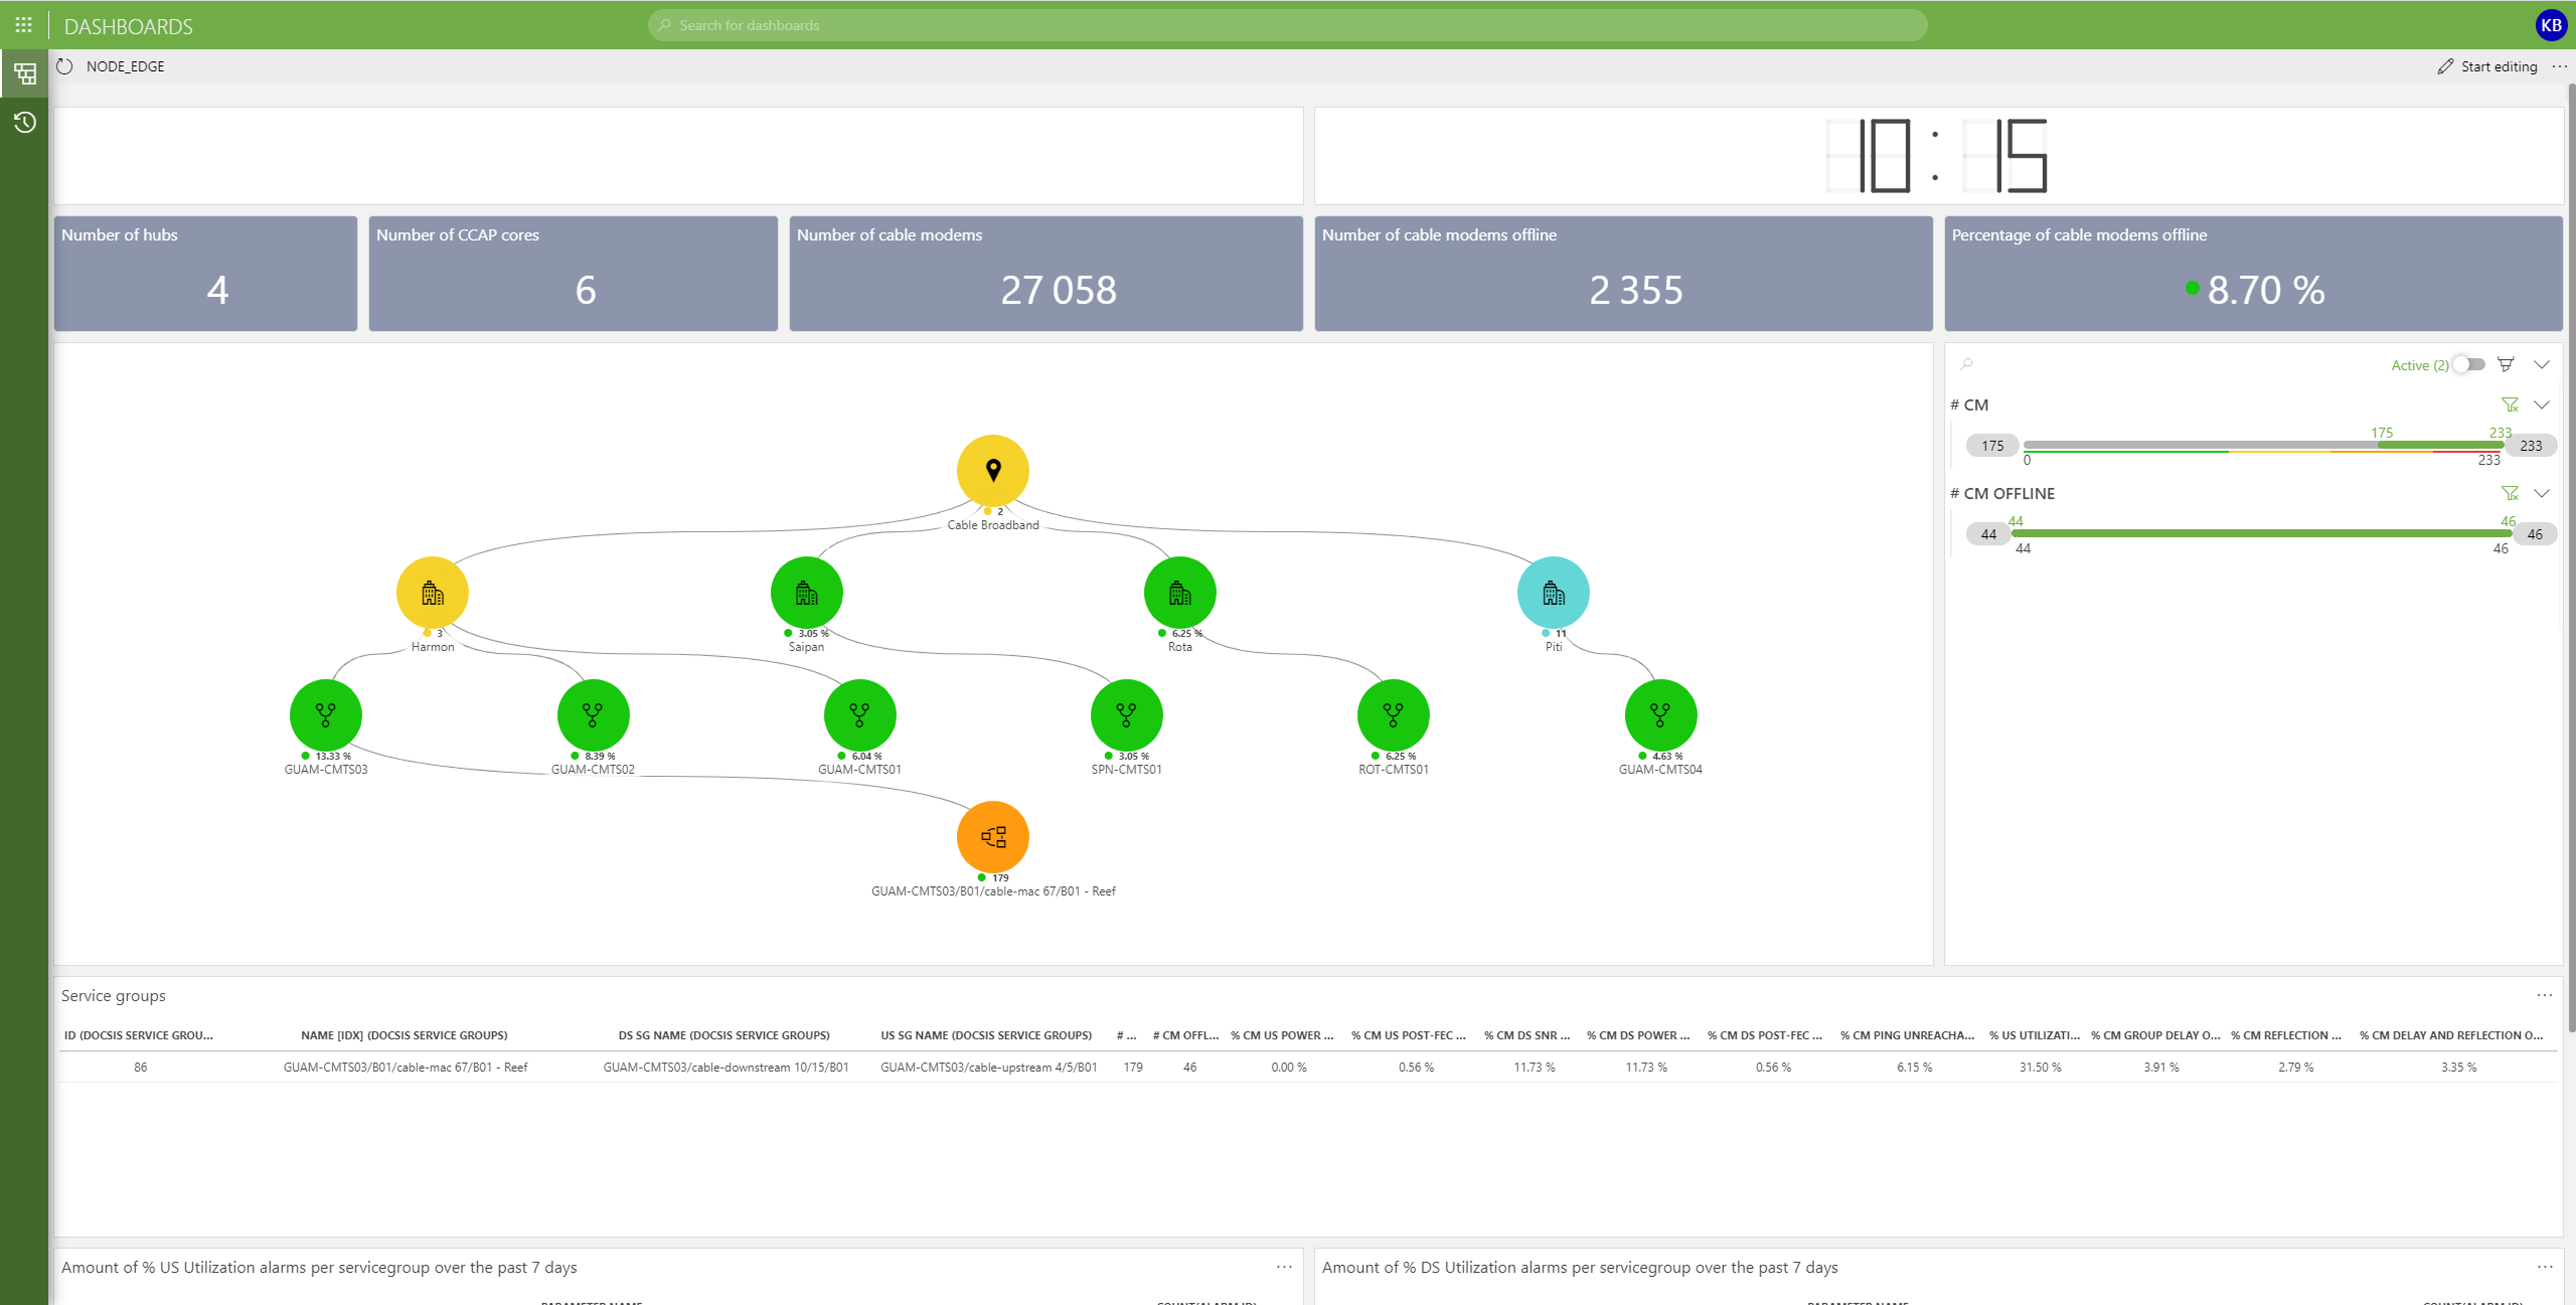 Visualization of the network using interactive dashboard, applied on the service group level analytical coloring linked to modem count as well as filtered the visualization of the service groups to show only these with a modem count of 175 or higher and an offline modem count higher of 44 or more.
 Concurrent filtering for segments with excessive share of modems operating outside of engineering spec for downstream SNR/MER
and featuring a low share of modems operating outside of engineering downstream Rx power pointing field operations directly towards segments impacted by faulty outside plant elements, loose connectors or shielding issues.
Concurrent filtering for segments with excessive share of modems operating outside of engineering spec for downstream SNR/MER
and featuring a low share of modems operating outside of engineering downstream Rx power pointing field operations directly towards segments impacted by faulty outside plant elements, loose connectors or shielding issues.
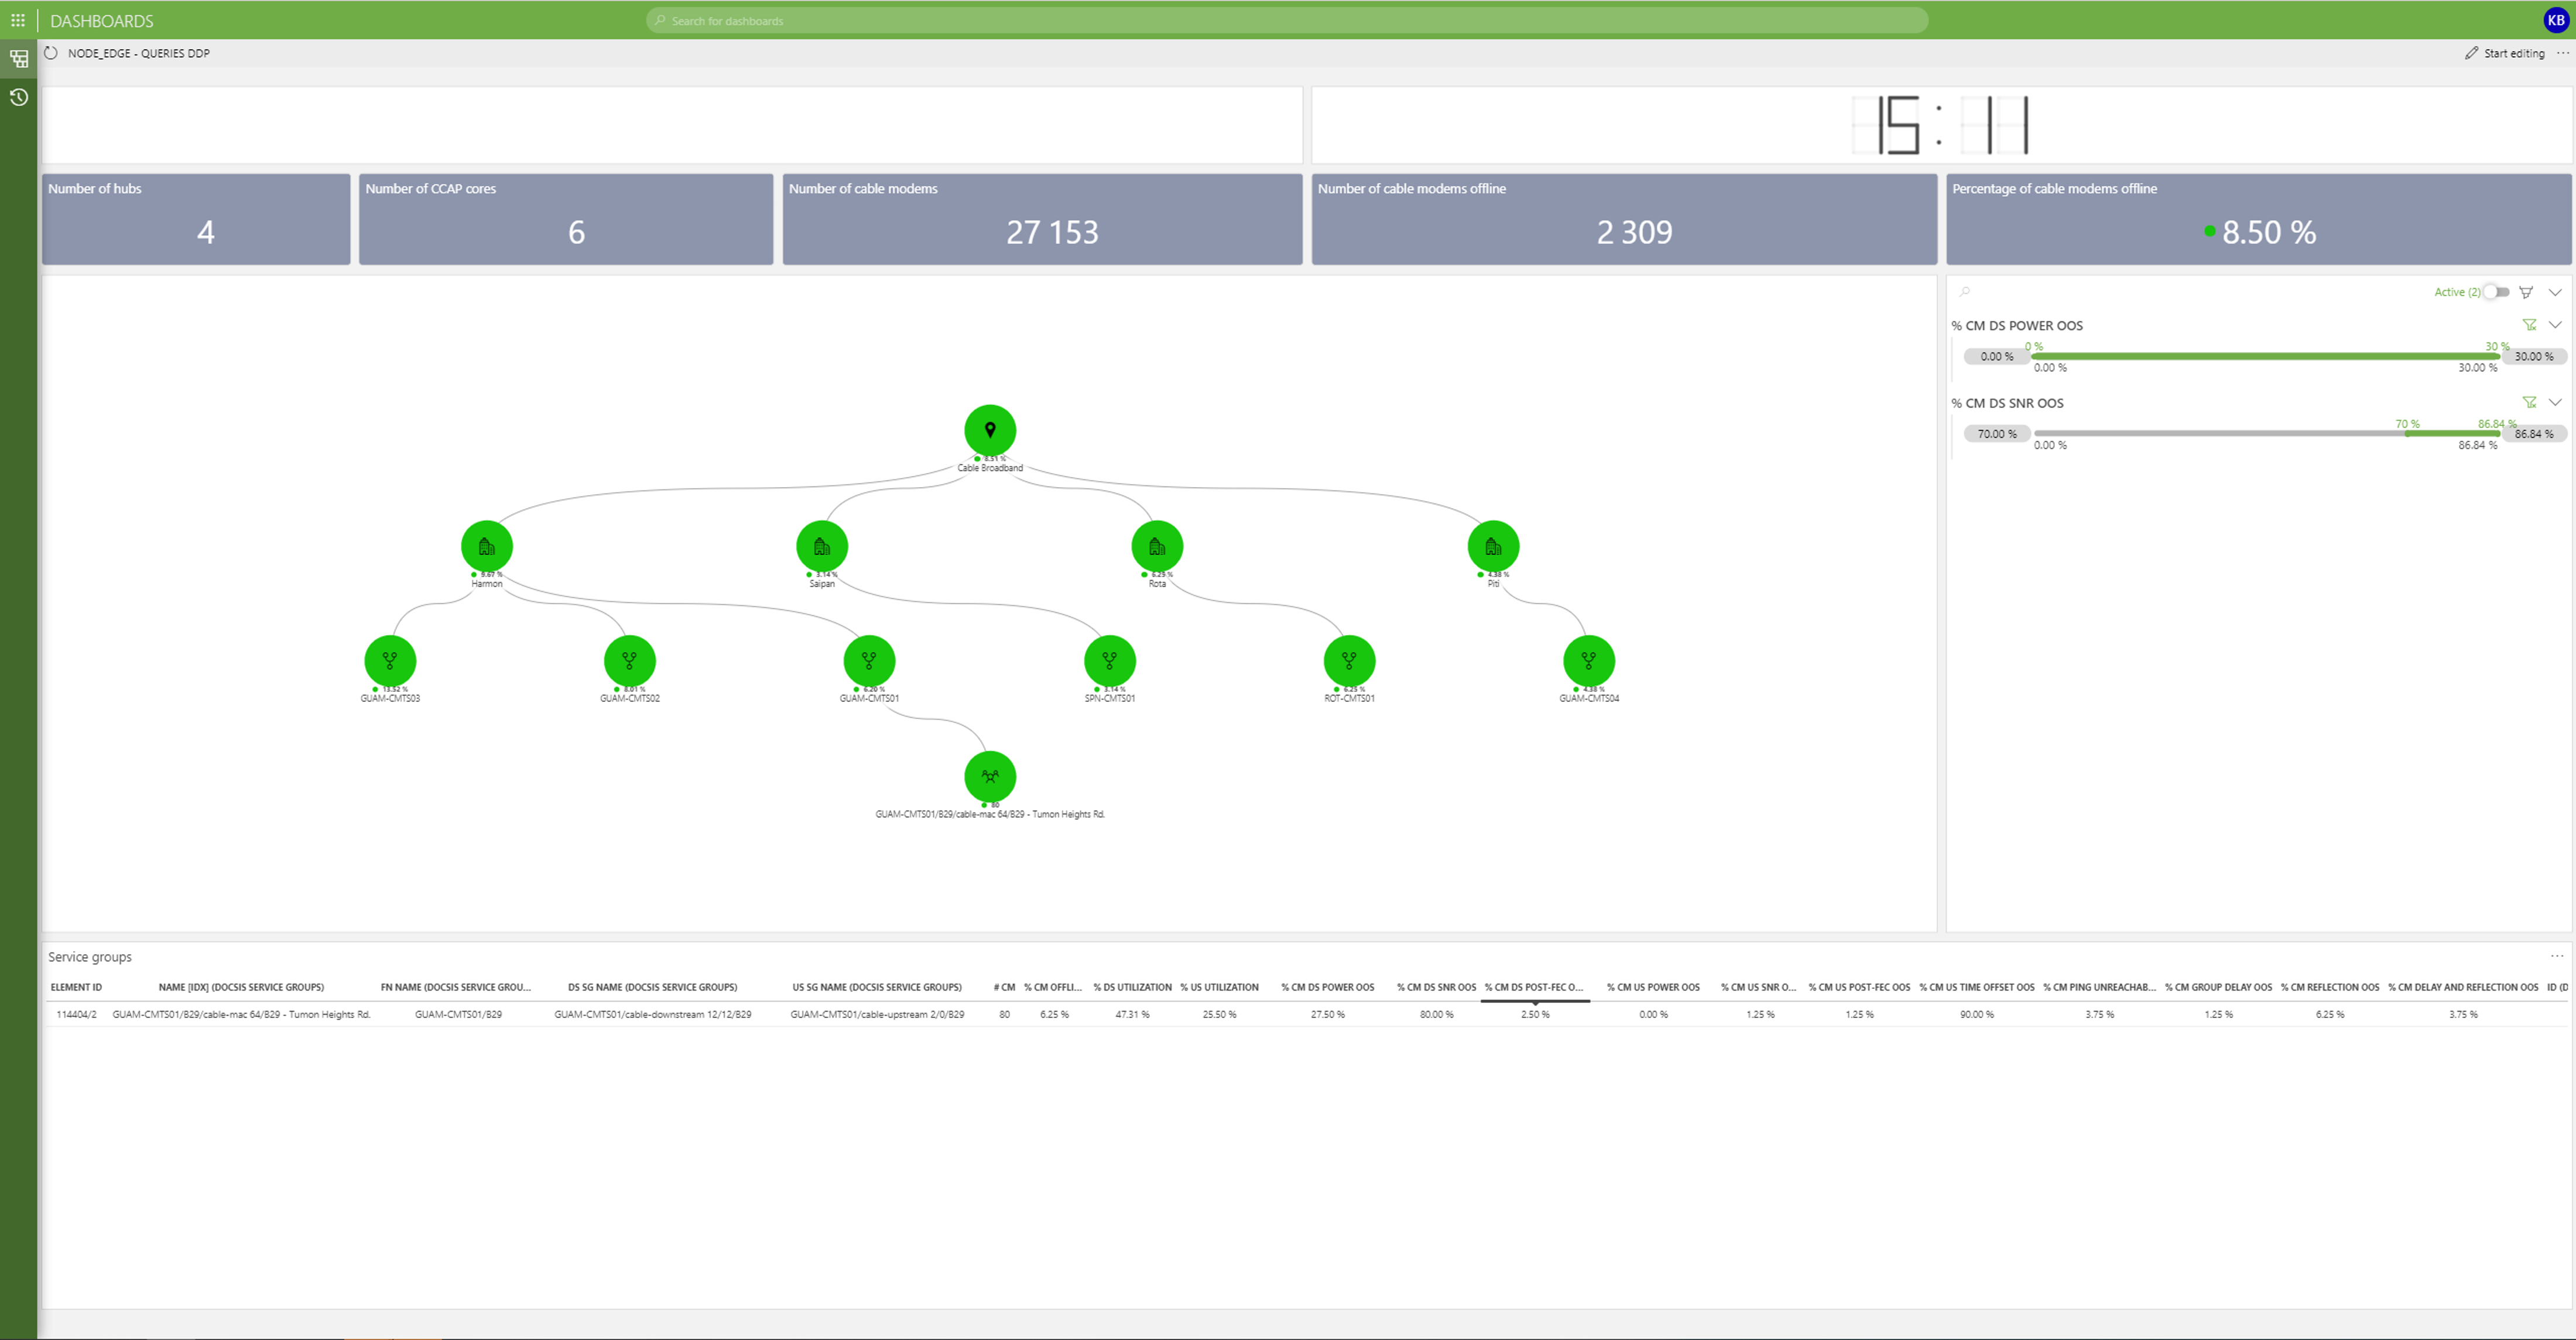
 Concurrent filtering for segments with excessive share of modems operating outside of engineering spec for upstream SNR/MER
and featuring a low share of modems operating outside of engineering upstream Rx power pointing field operations directly towards segments impacted by ingress noise.
Concurrent filtering for segments with excessive share of modems operating outside of engineering spec for upstream SNR/MER
and featuring a low share of modems operating outside of engineering upstream Rx power pointing field operations directly towards segments impacted by ingress noise.
2 thoughts on “EPM for management of DOCSIS based broadband delivery”
Leave a Reply
You must be logged in to post a comment.
Great use case buildup Dominique, this is awesome work !!
Thank you!