solution Use Case
DataMiner CityOps Waste Management
Smarter collections, cleaner streets, lower cost
The DataMiner CityOps Waste Management module enables cities to run efficient and sustainable waste operations across all zones, integrating asset intelligence, route optimization, and live sensor data. Working in sync with CityOps Asset Management, Planned Maintenance, and Work Orders, it gives municipalities full visibility from container status to collection fleet movement, transforming detections into data-driven actions.
The module maintains a complete digital inventory of all bins across the city, categorized by waste type and container size. It combines real-time fill level monitoring, visual detections, and truck route management in a single workspace, helping cities cut unnecessary trips, reduce emissions, and respond quickly to service demands.
USE CASE DETAILS
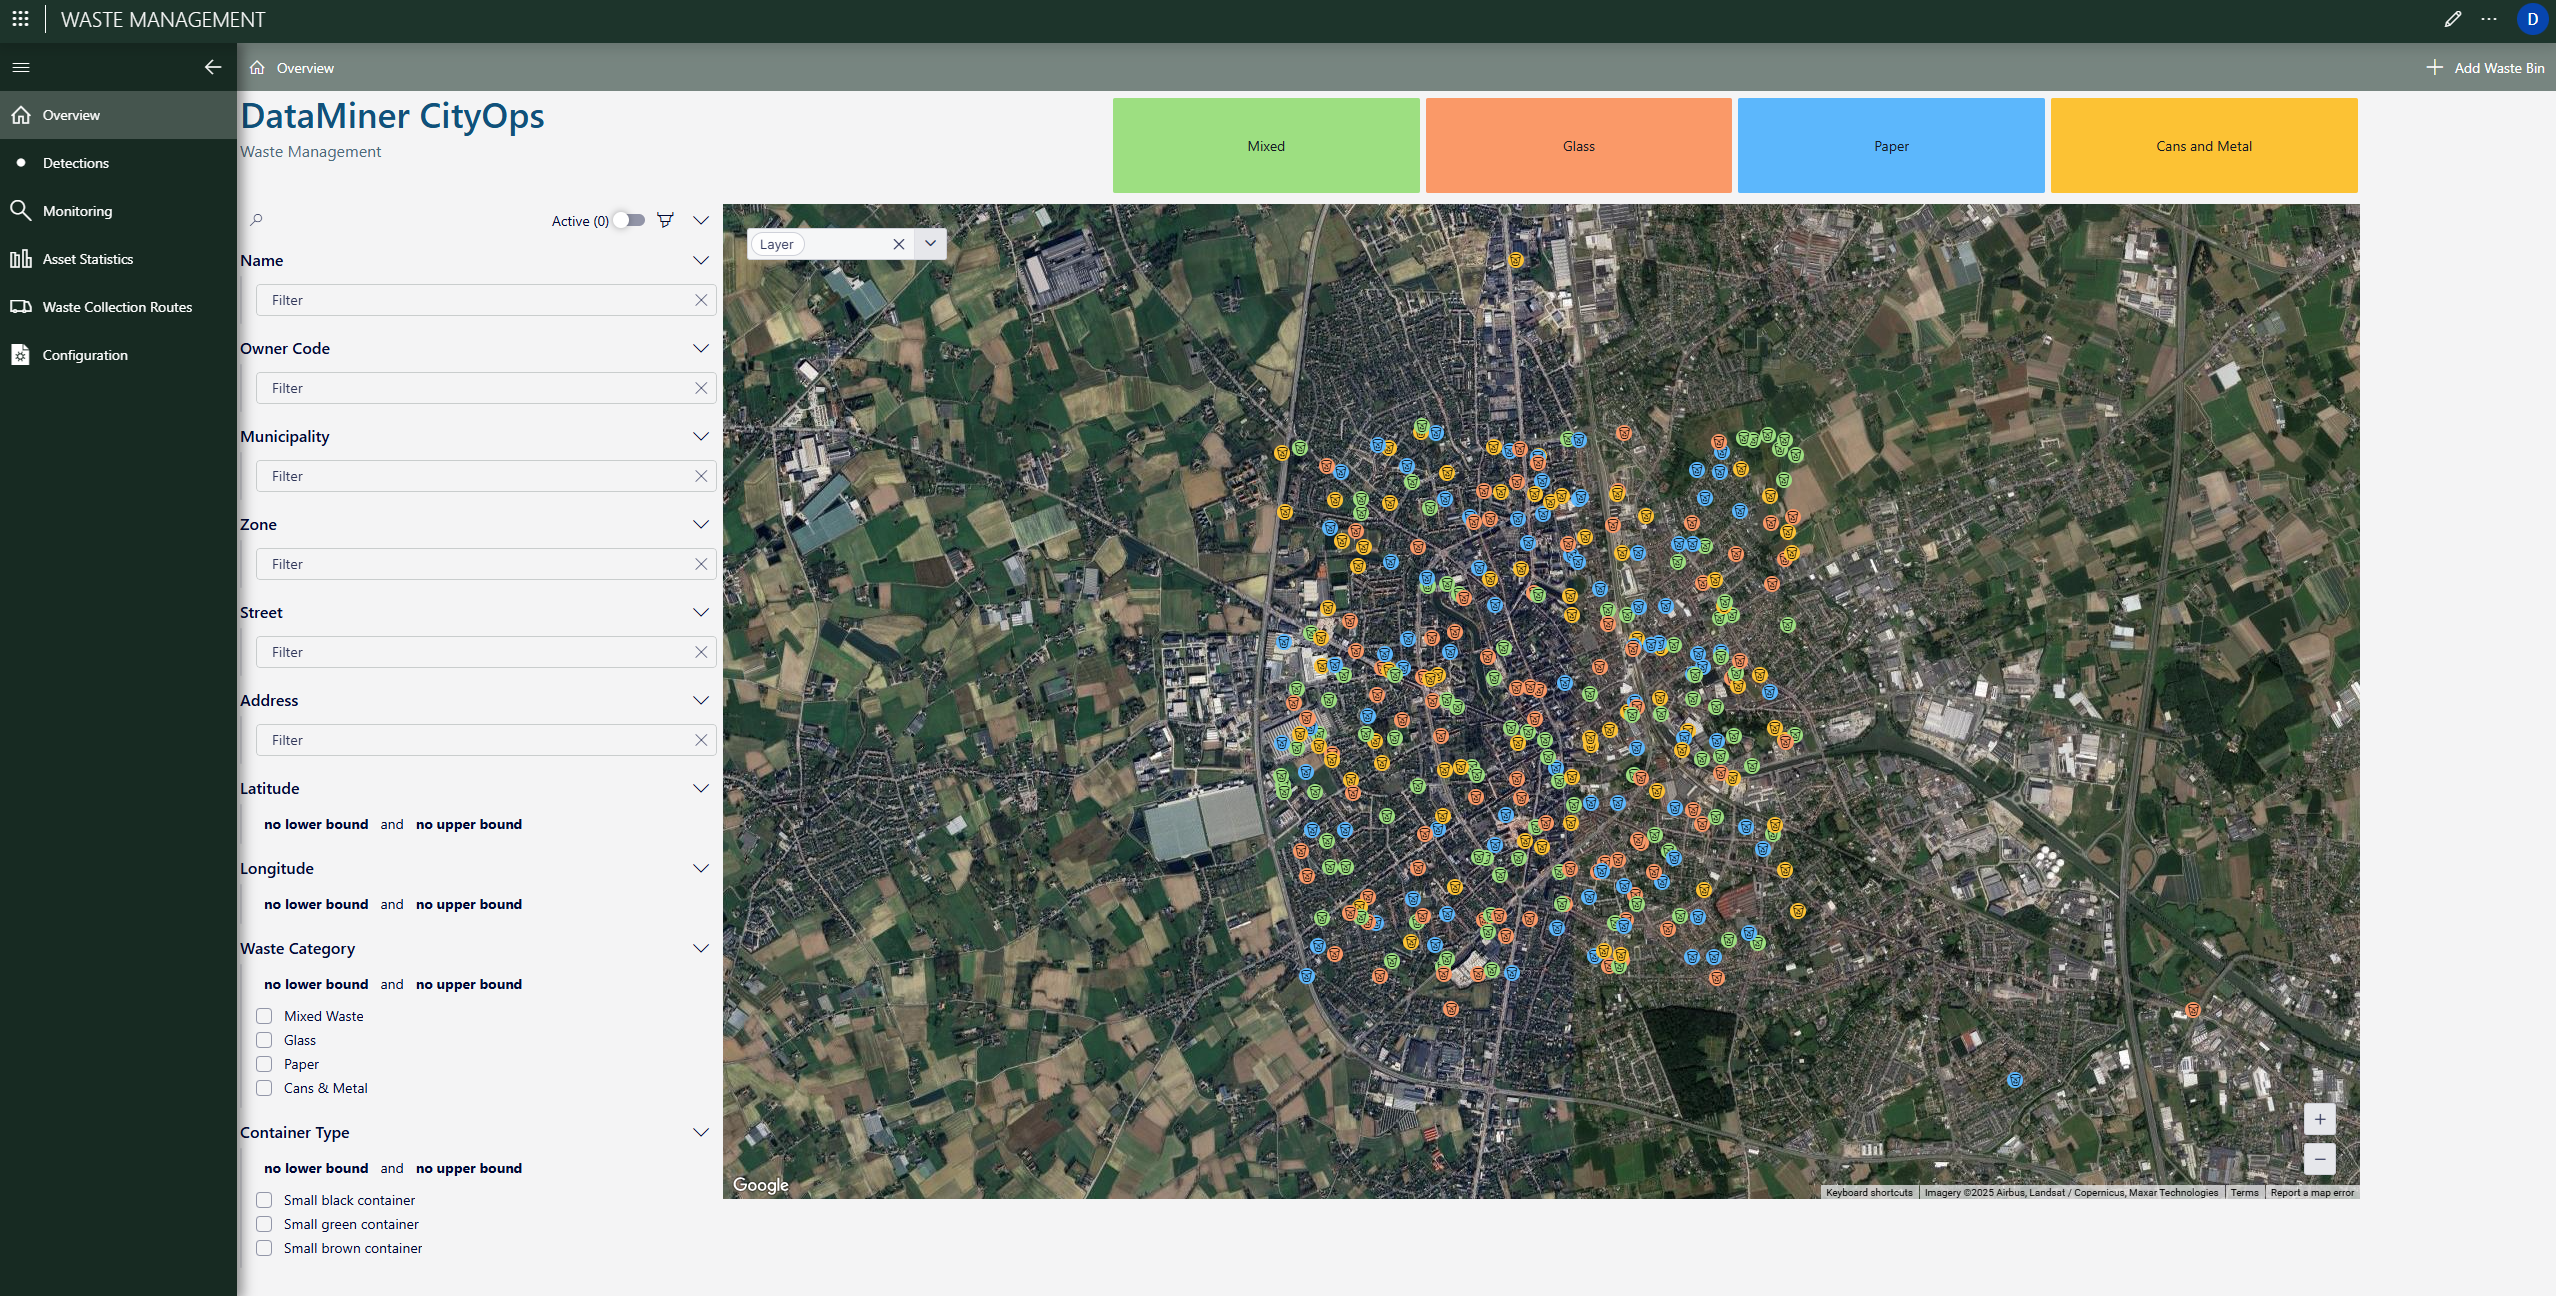
Waste Overview map
This view provides a full geographic overview of all city waste containers. Each colored icon represents a bin category: mixed, glass, paper, or cans and metal. Operators can filter bins by municipality, zone, or street, and toggle layers to focus on specific areas. This visualization helps city planners evaluate bin distribution and detect areas with coverage gaps or overflow patterns.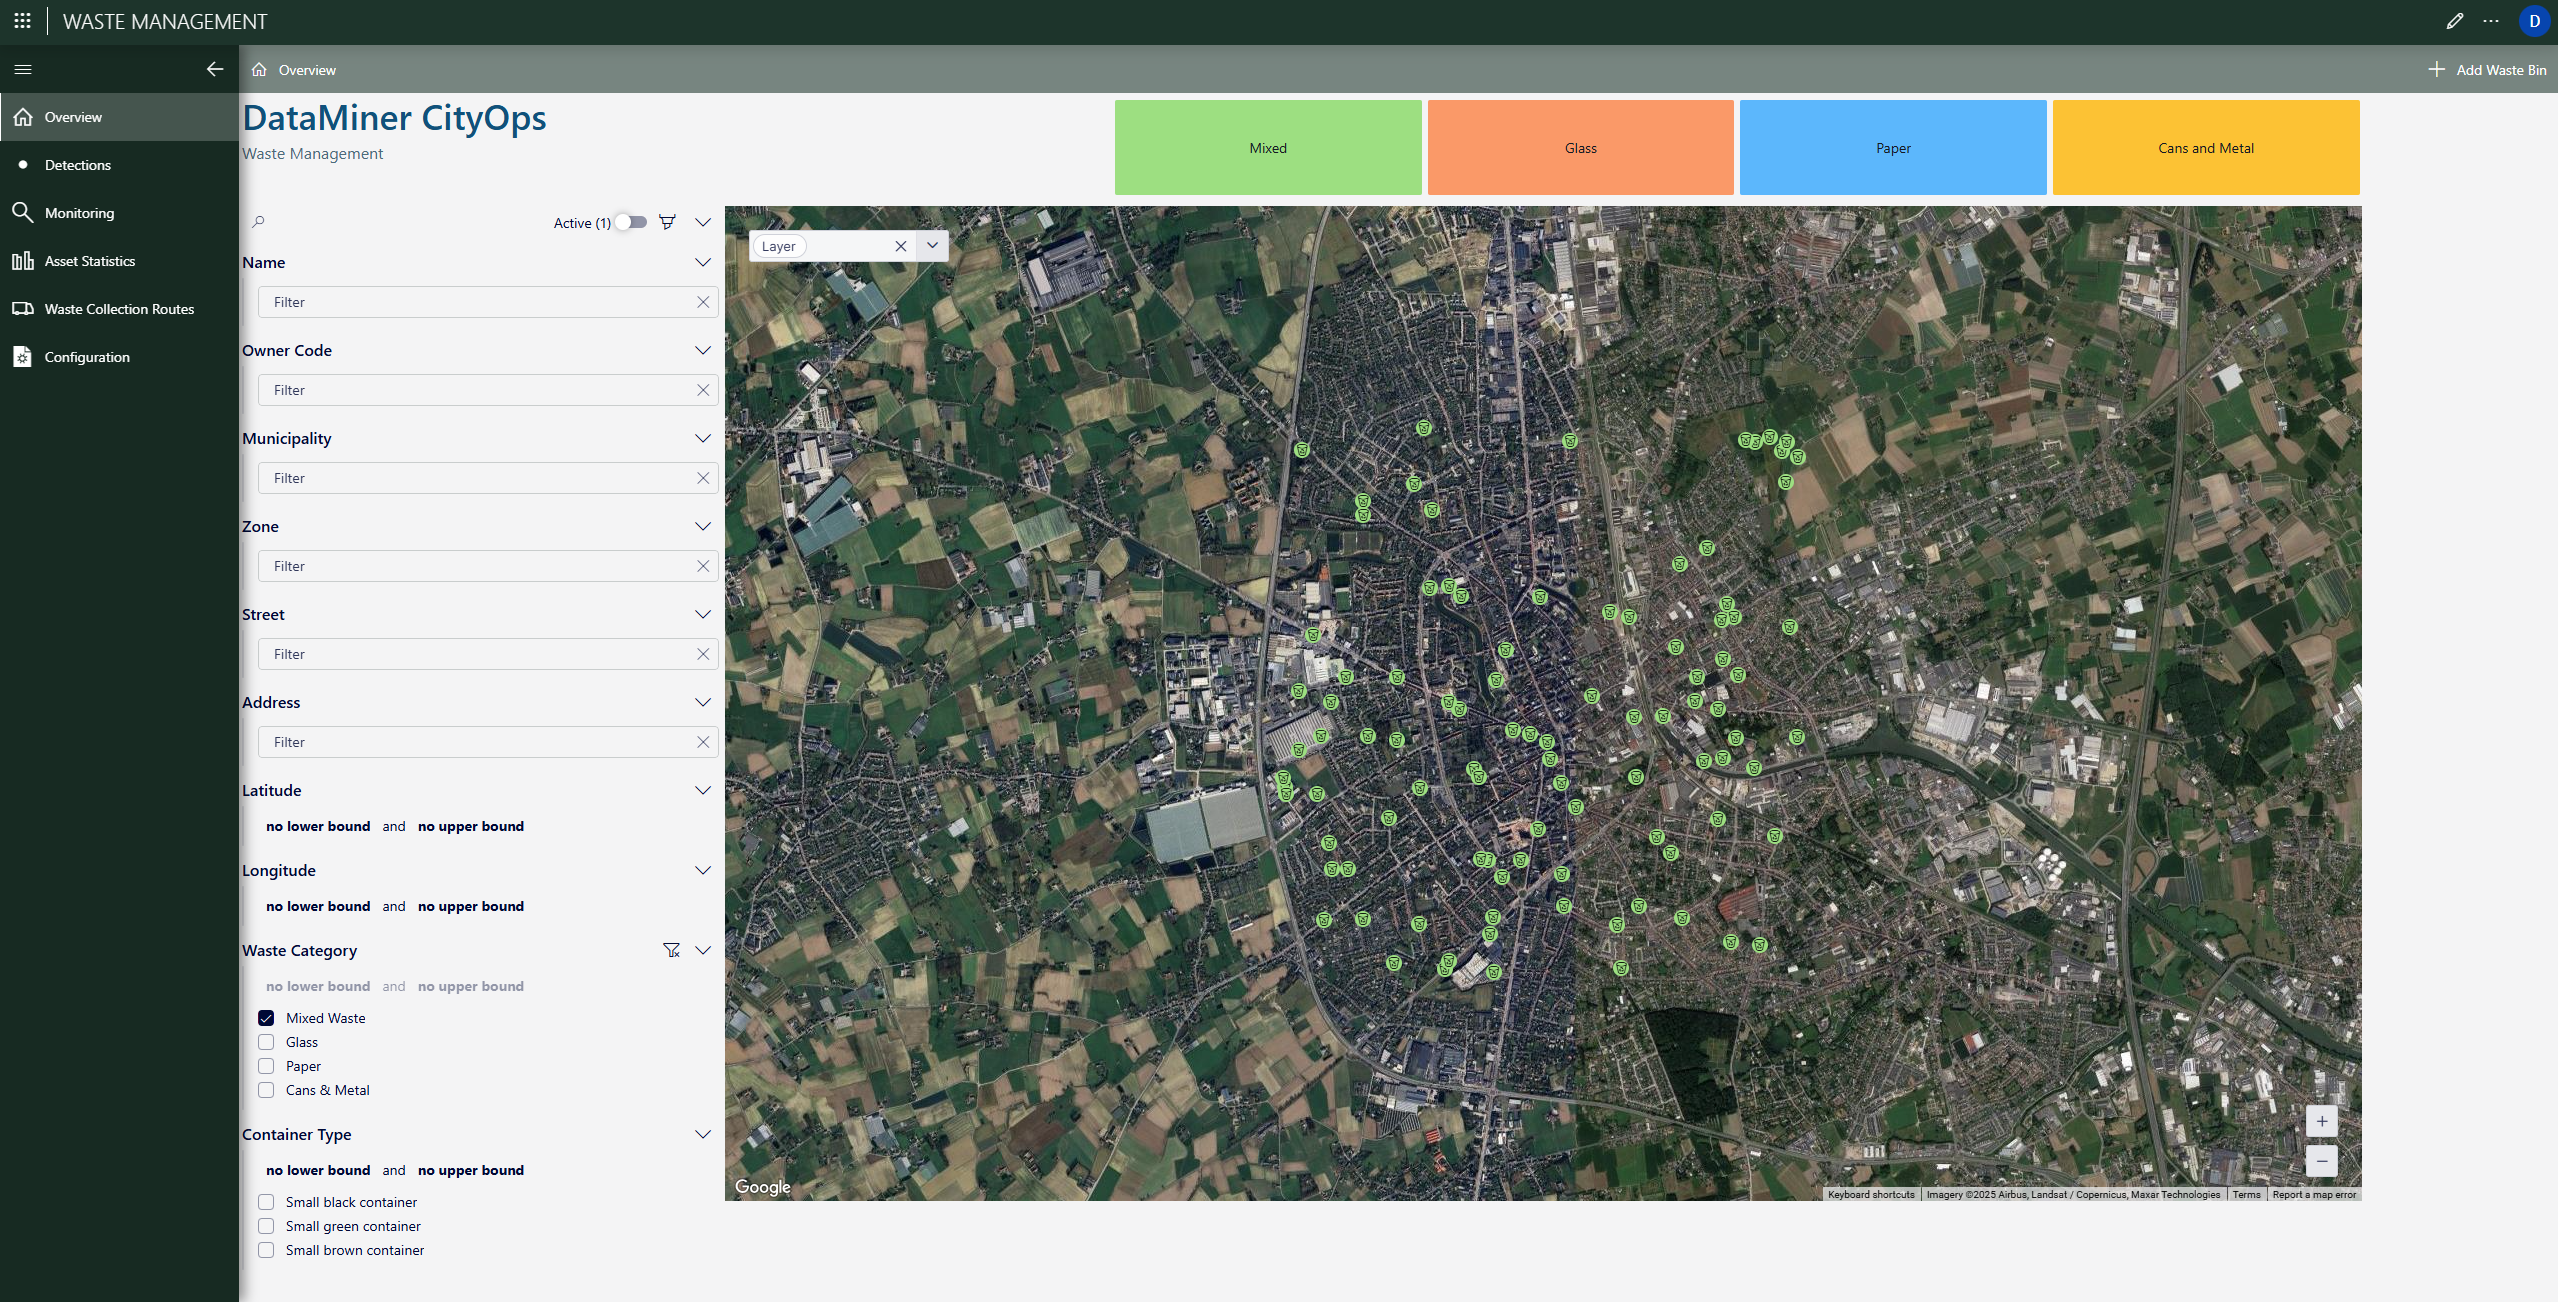
Category filtering
Here, only mixed waste containers are shown on the map. This filtering capability allows operators to isolate and monitor individual waste streams. It supports more targeted route planning and ensures the correct collection frequency for each category, improving recycling rates and operational efficiency.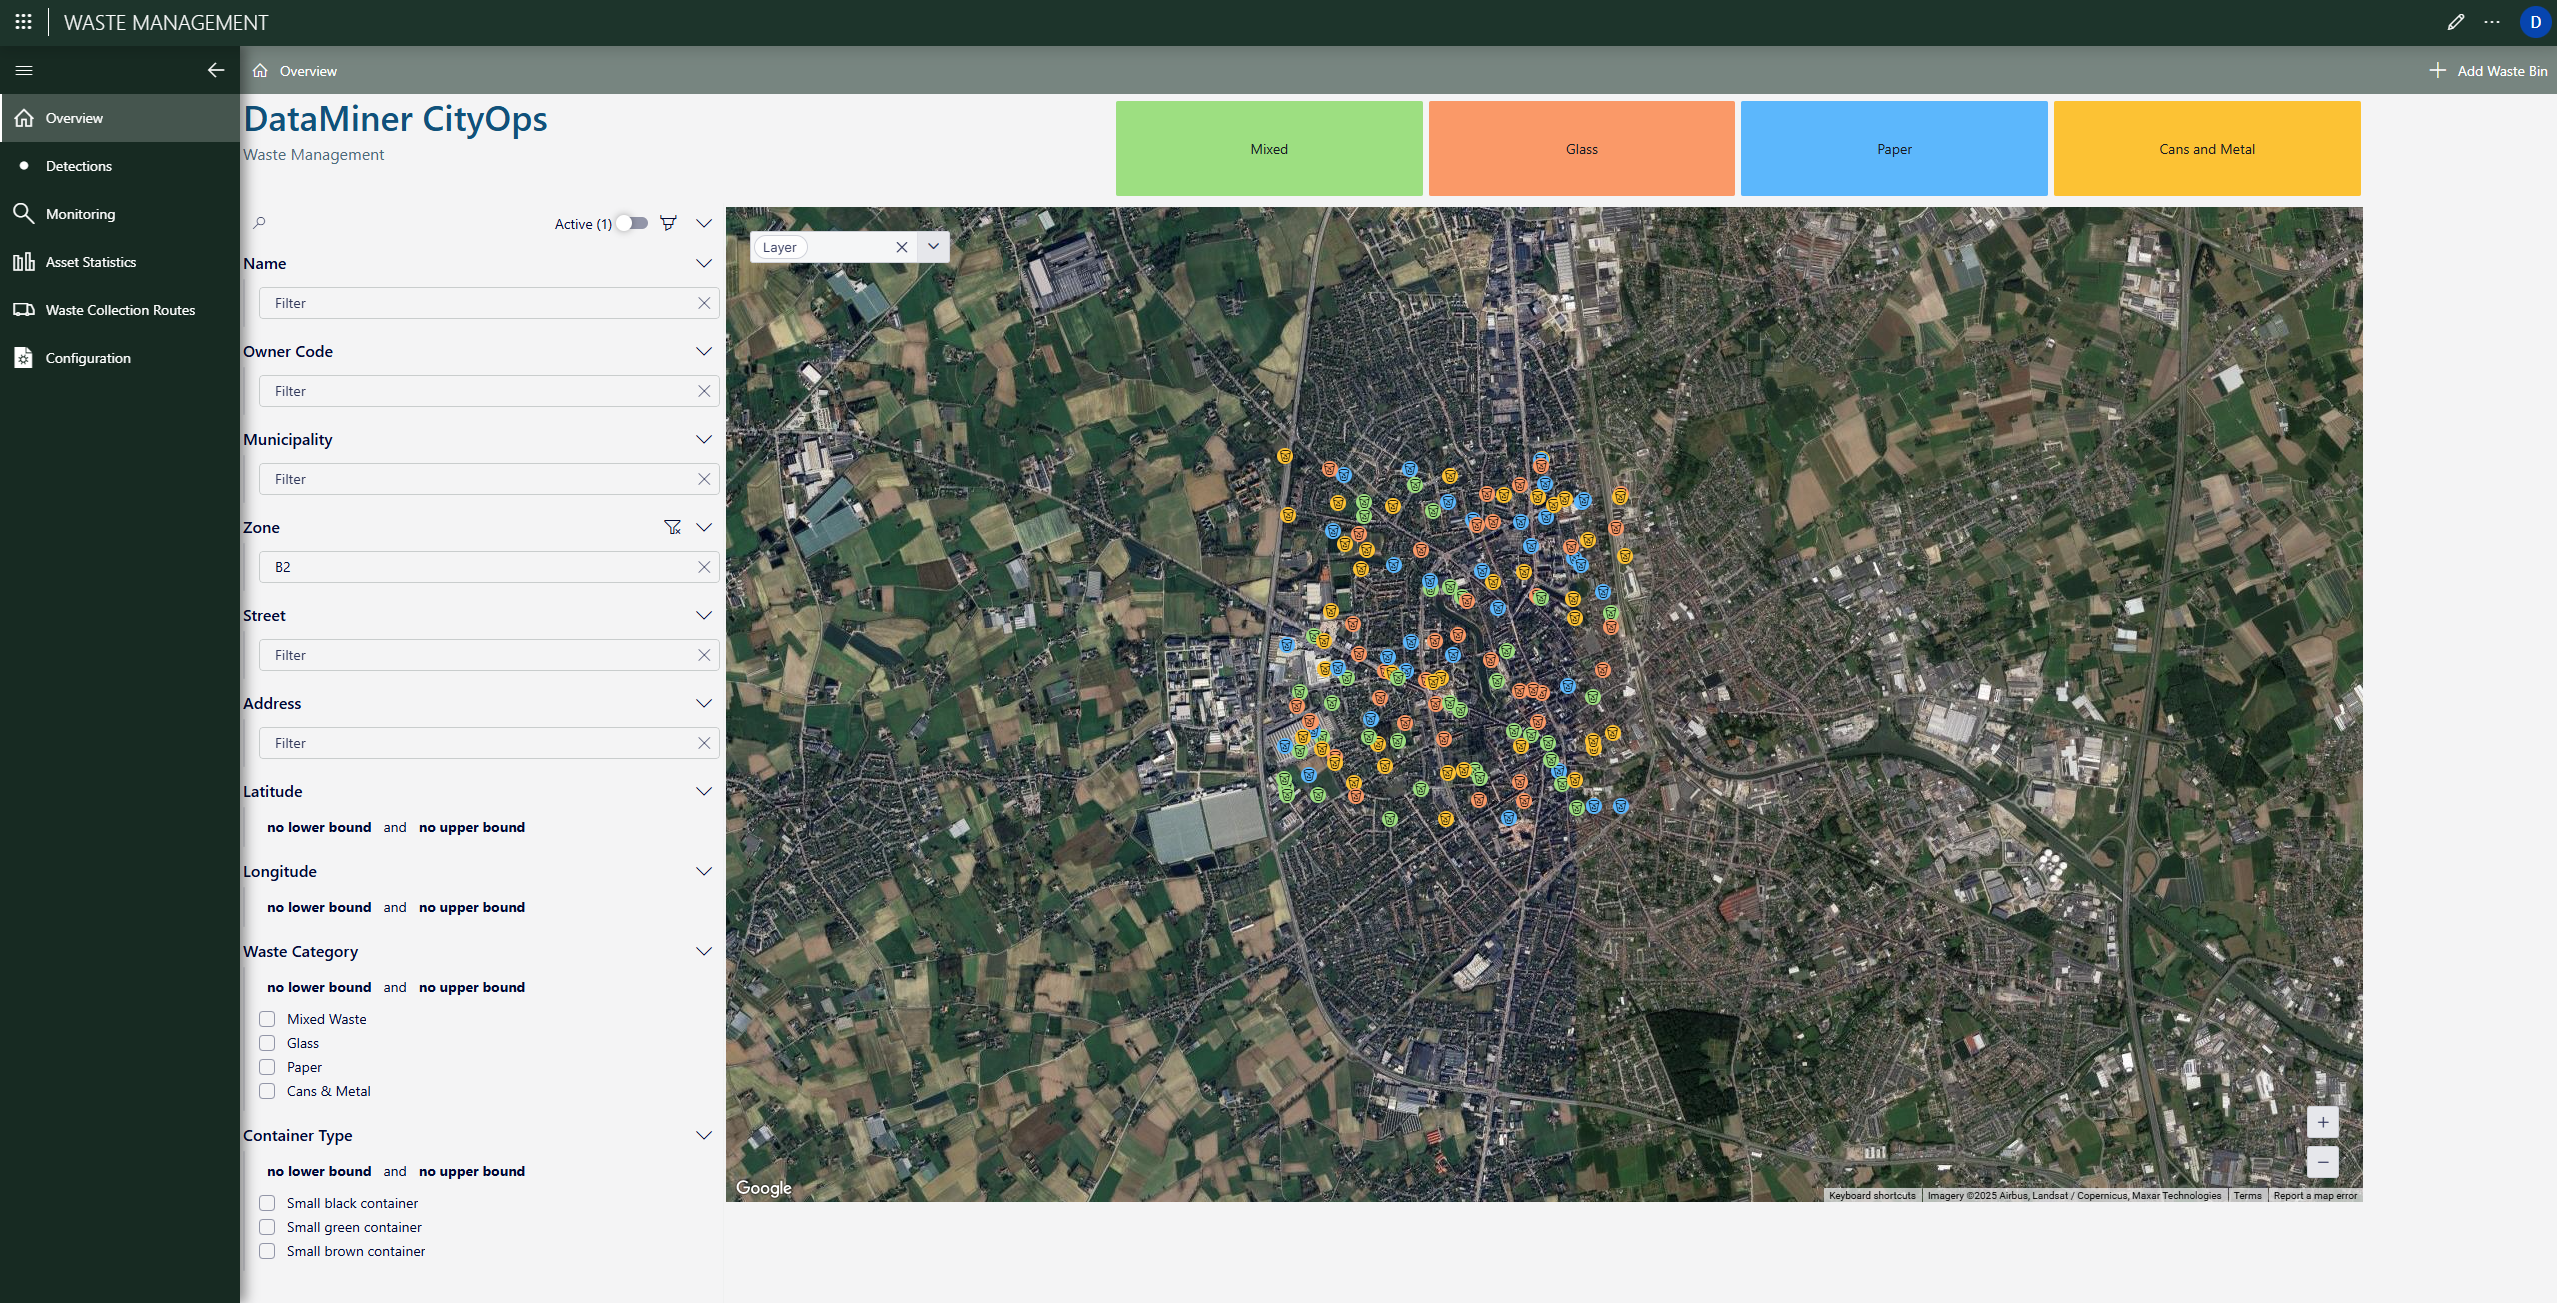
Zone filtering
This function allows users to narrow down the map display to a selected zone or neighborhood. Each zone can represent a district, operational area, or contractor territory. By visualizing assets within a zone, operators can monitor localized waste levels, assess workload distribution, and plan routes or maintenance tasks efficiently. The zone filter ensures that planners can manage both citywide and micro-regional operations seamlessly.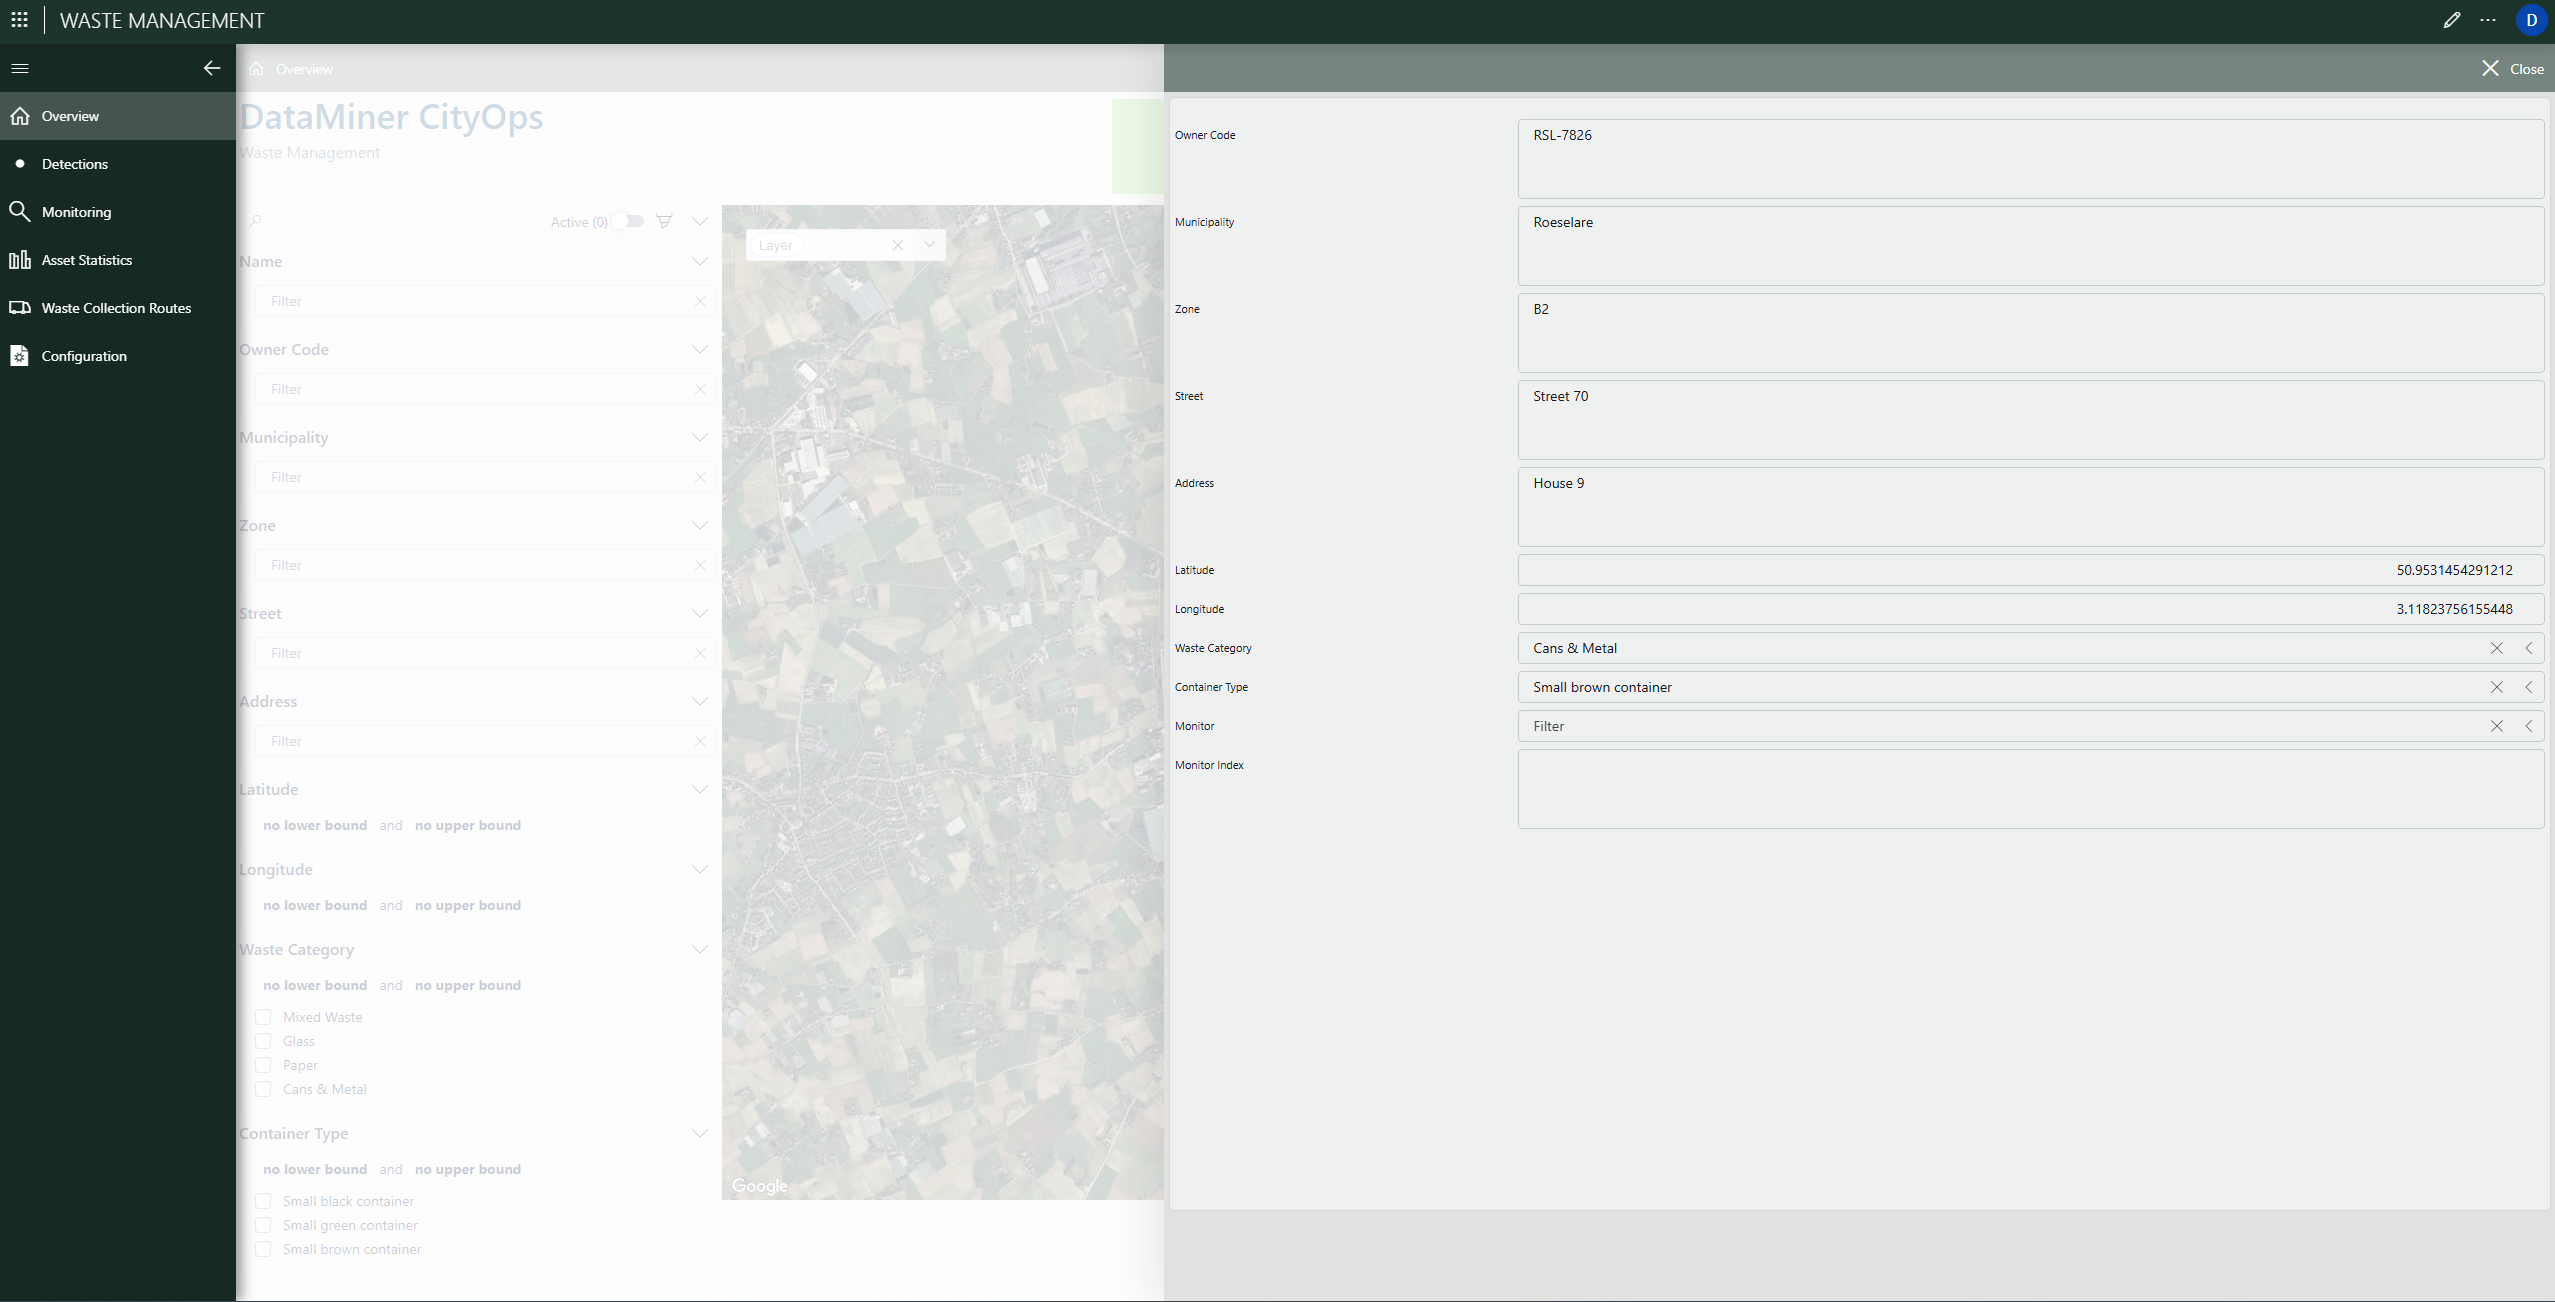
Bin Details view
Selecting a bin opens a detailed data panel containing its unique owner code, municipality, zone, street address, GPS coordinates, waste category, and container type. This view connects directly to Asset Management and Maintenance modules, allowing technicians to track condition, warranty status, and service history without switching systems.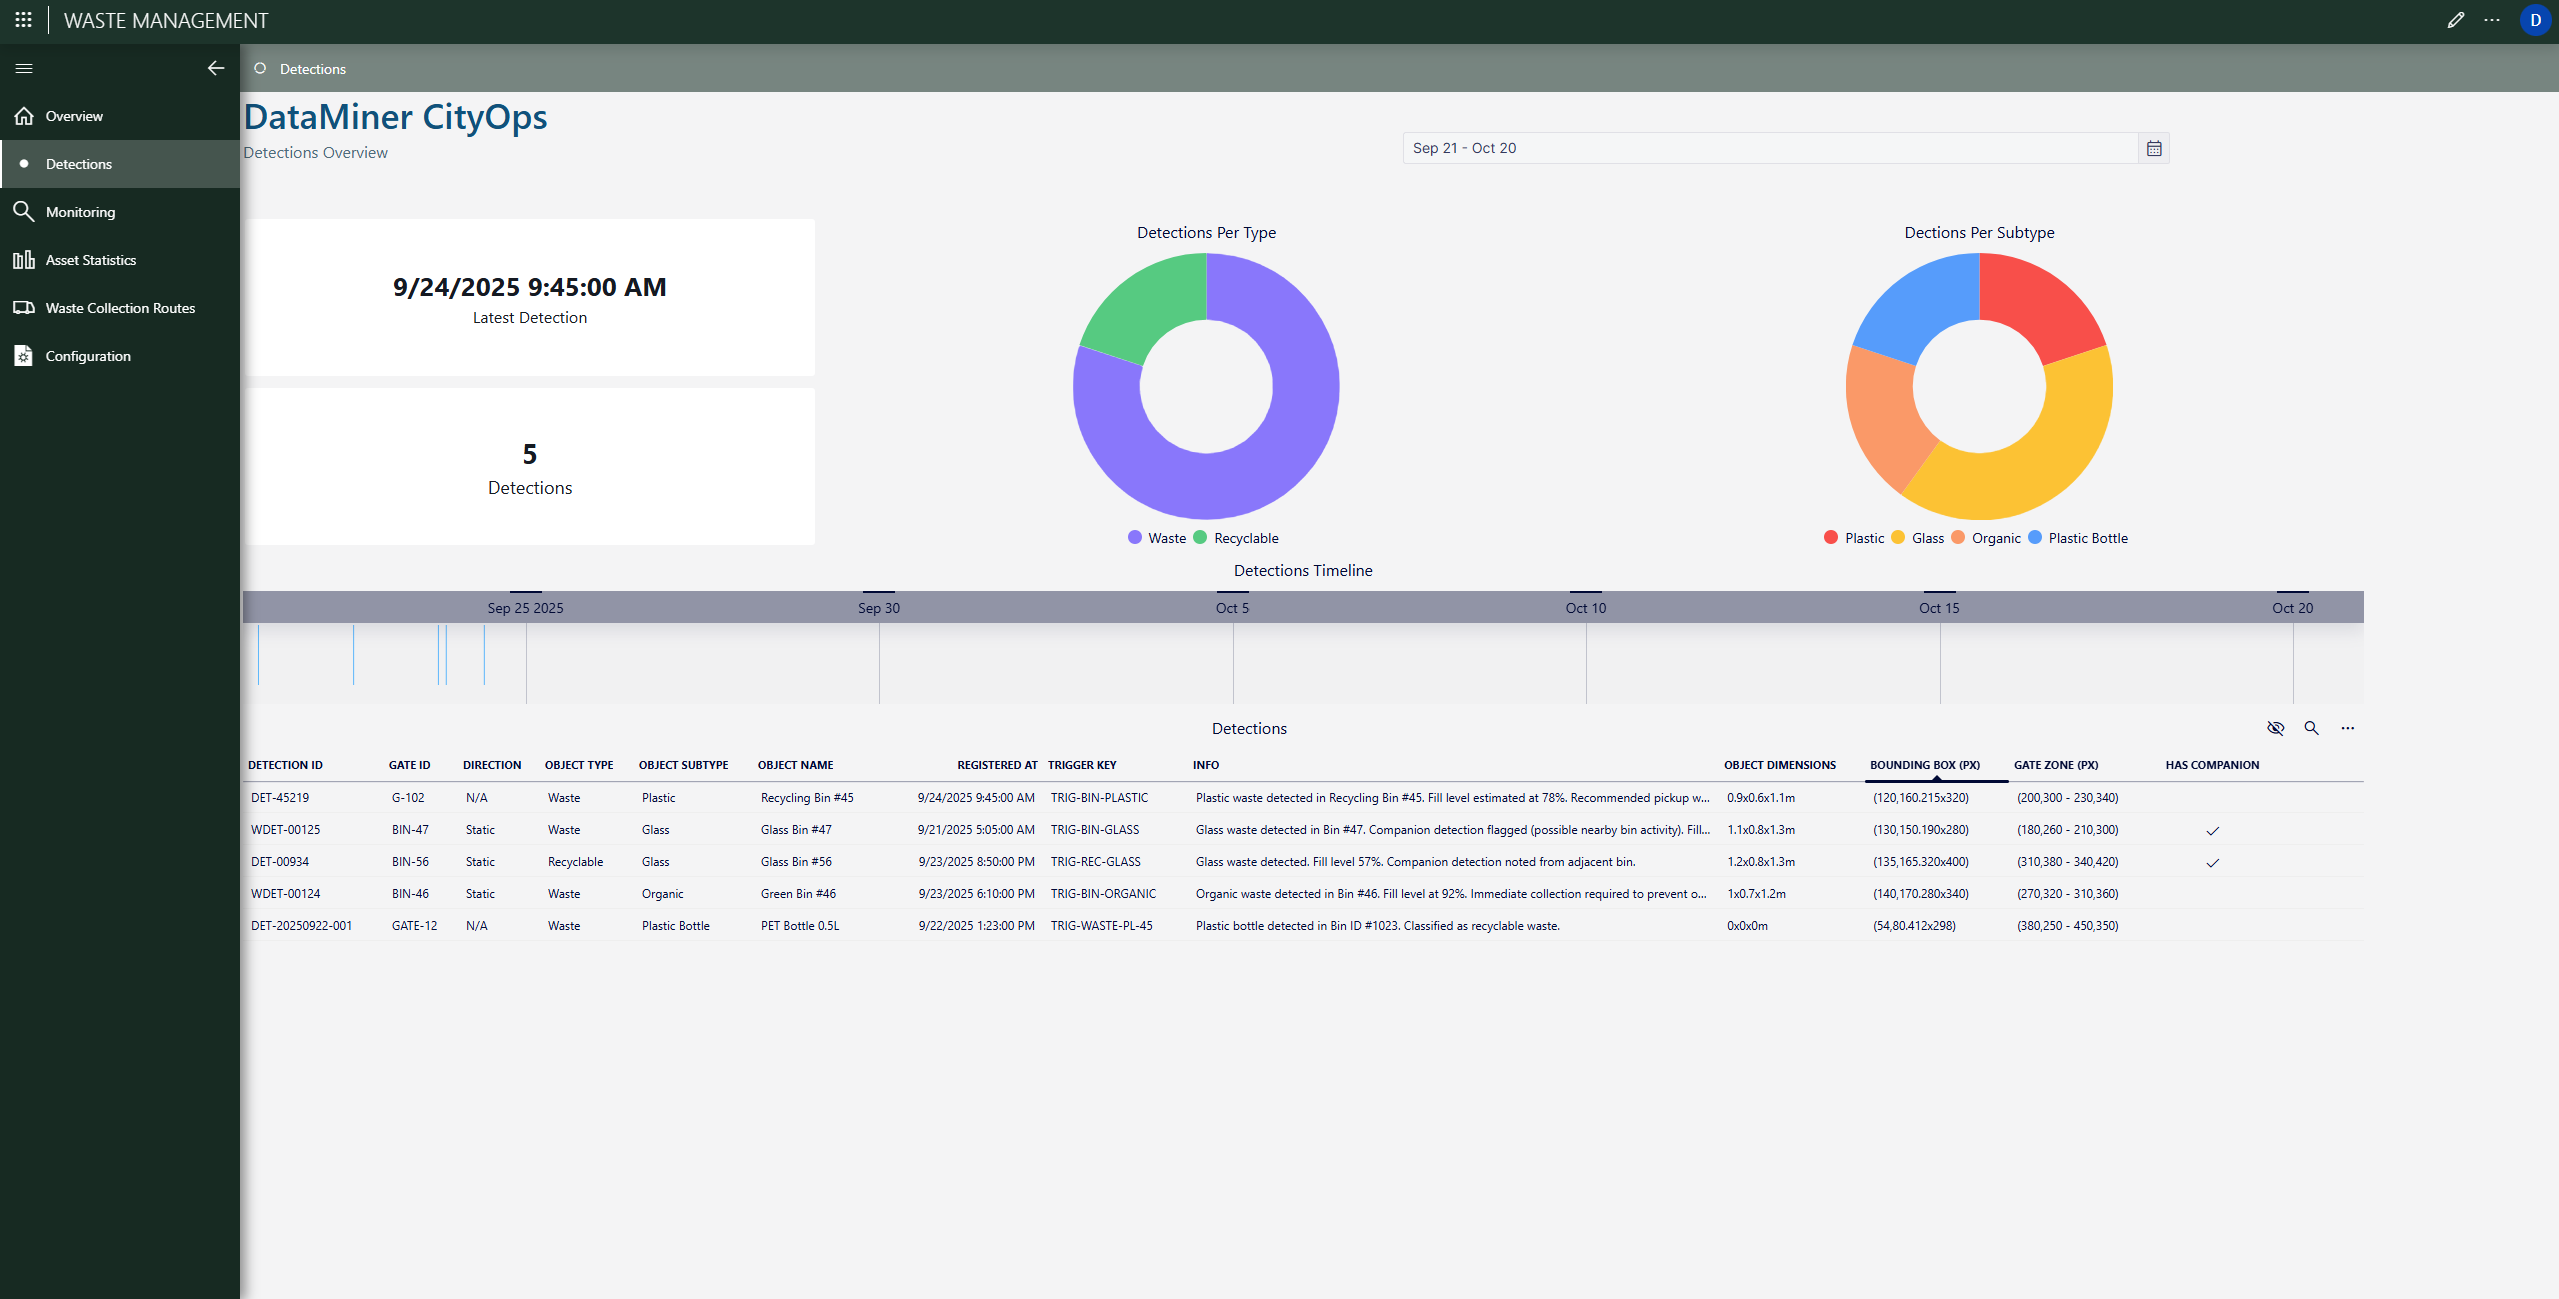
Detection overview
The Detection page displays recent waste detection events captured by smart cameras and their distribution across categories. Circular charts summarize detections by type (waste vs. recyclable) and by subtype (plastic, glass, organic, etc.). The timeline and detection table below provide precise data, including detection time, location, and trigger source. This helps identify contamination incidents, missed pickups, or overflow risks before they escalate.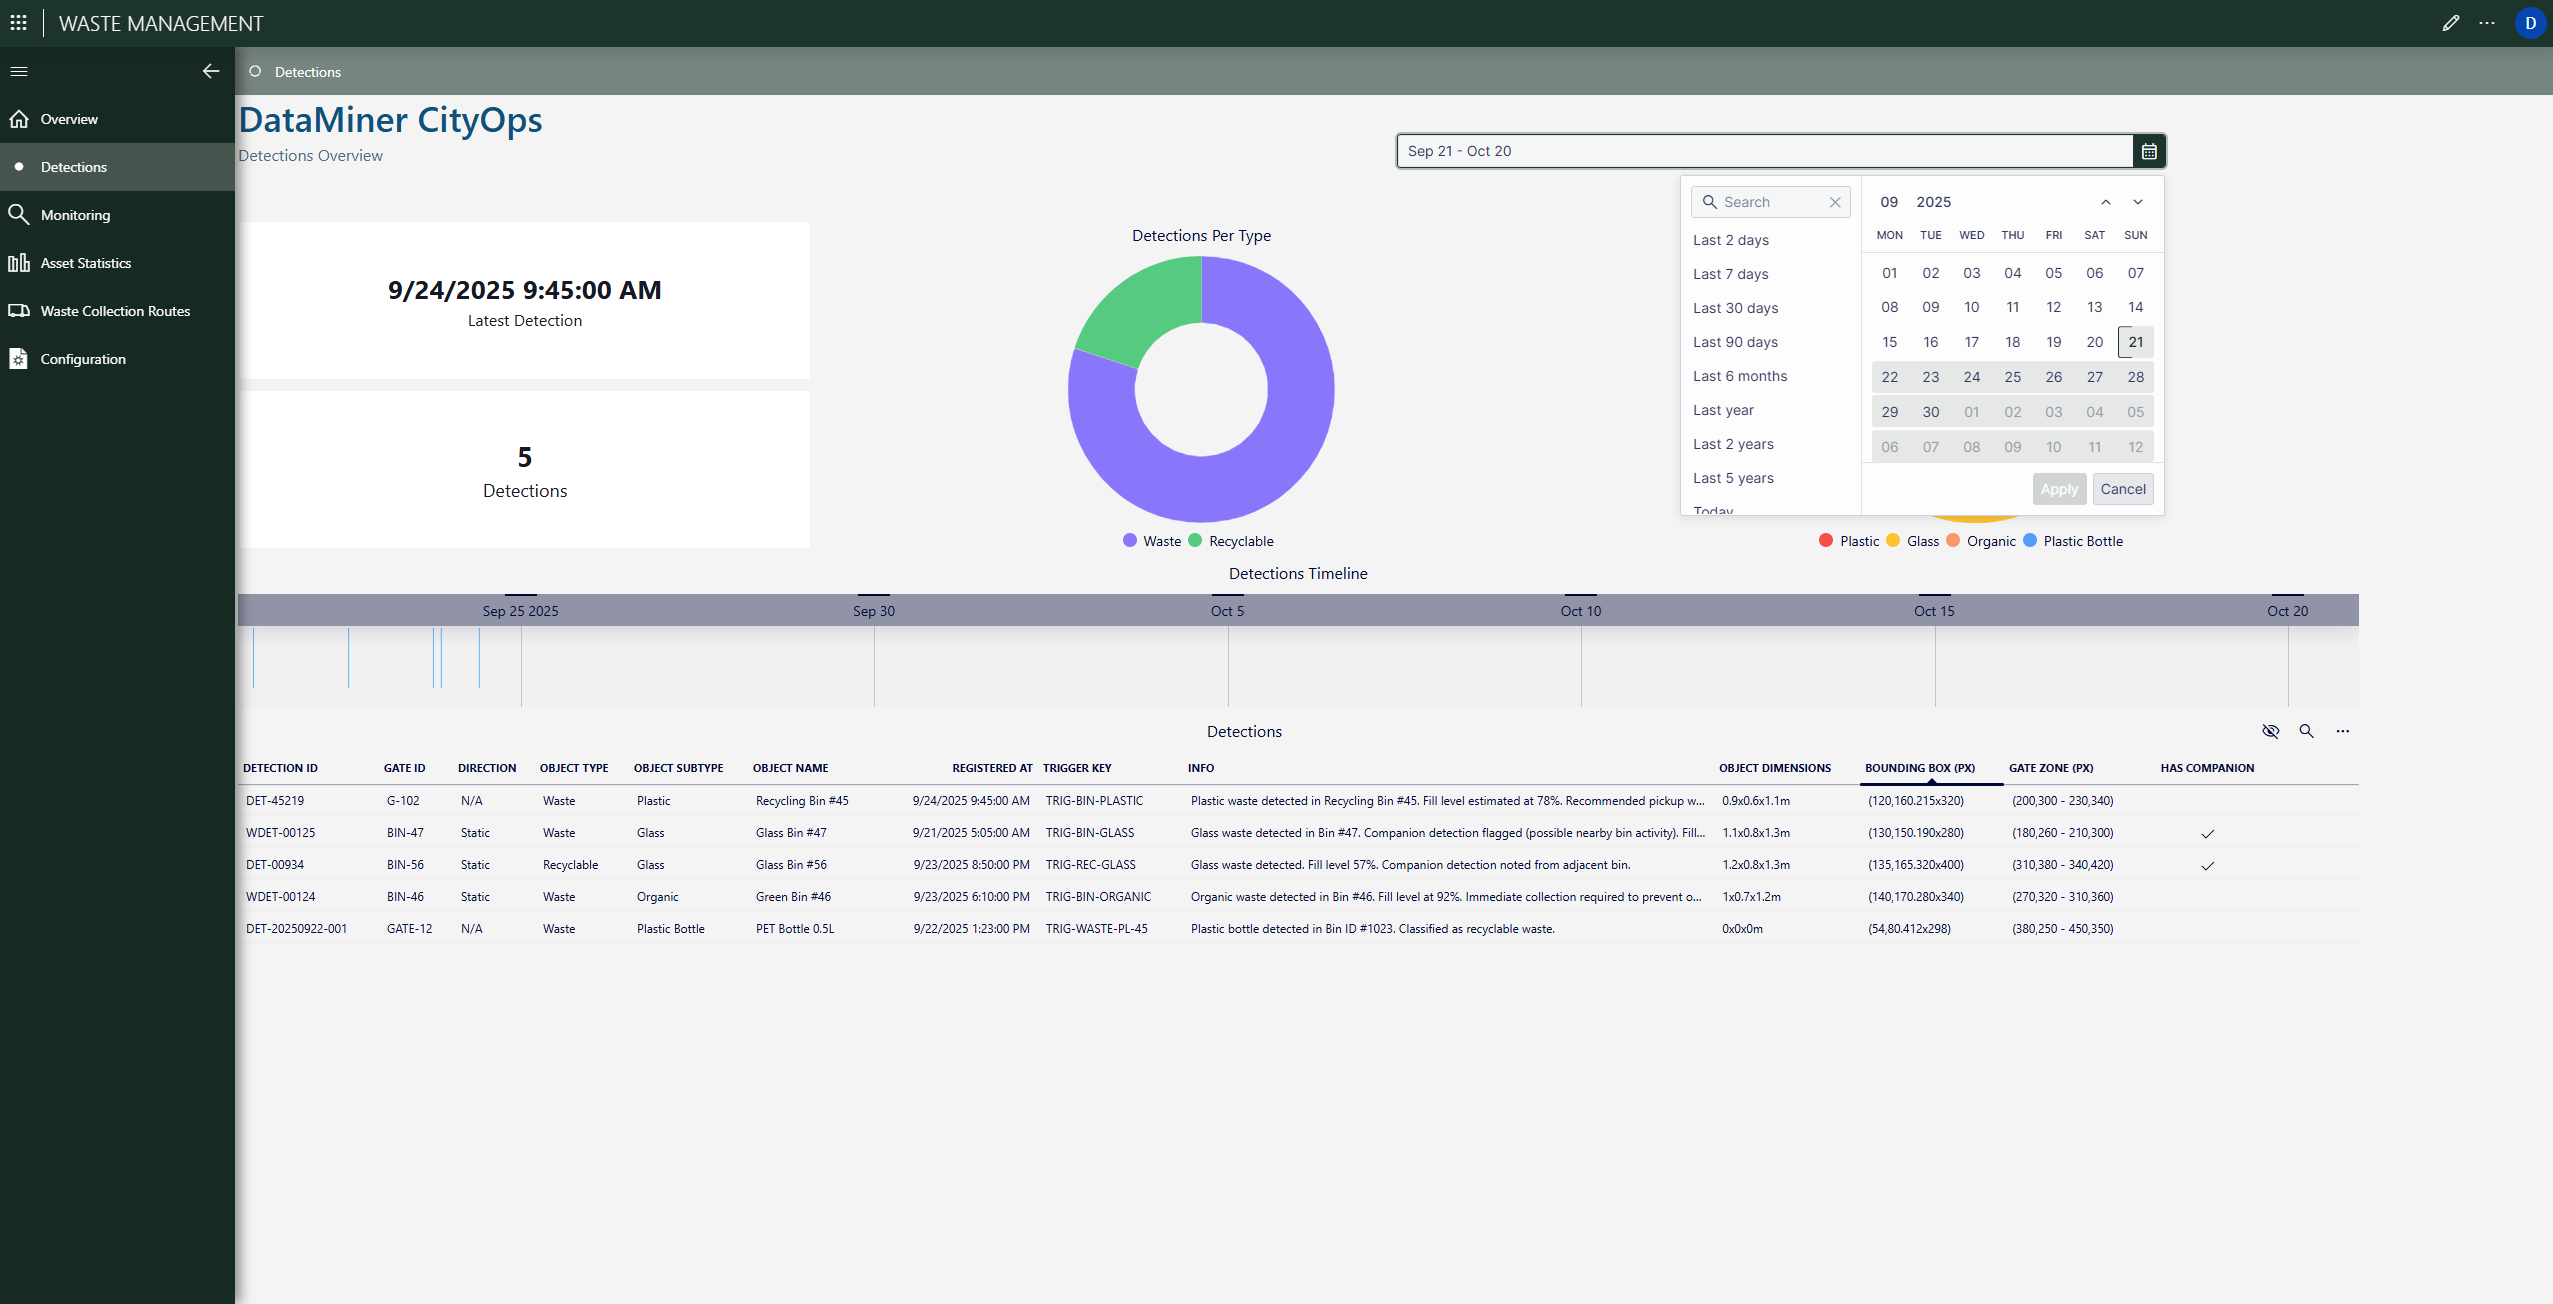
Time filter in detections
This calendar overlay lets users filter detections by custom time periods such as the last 7 days, last month, or any chosen range. Analysts use this to correlate waste events with weather, public holidays, or seasonal patterns, enhancing planning accuracy.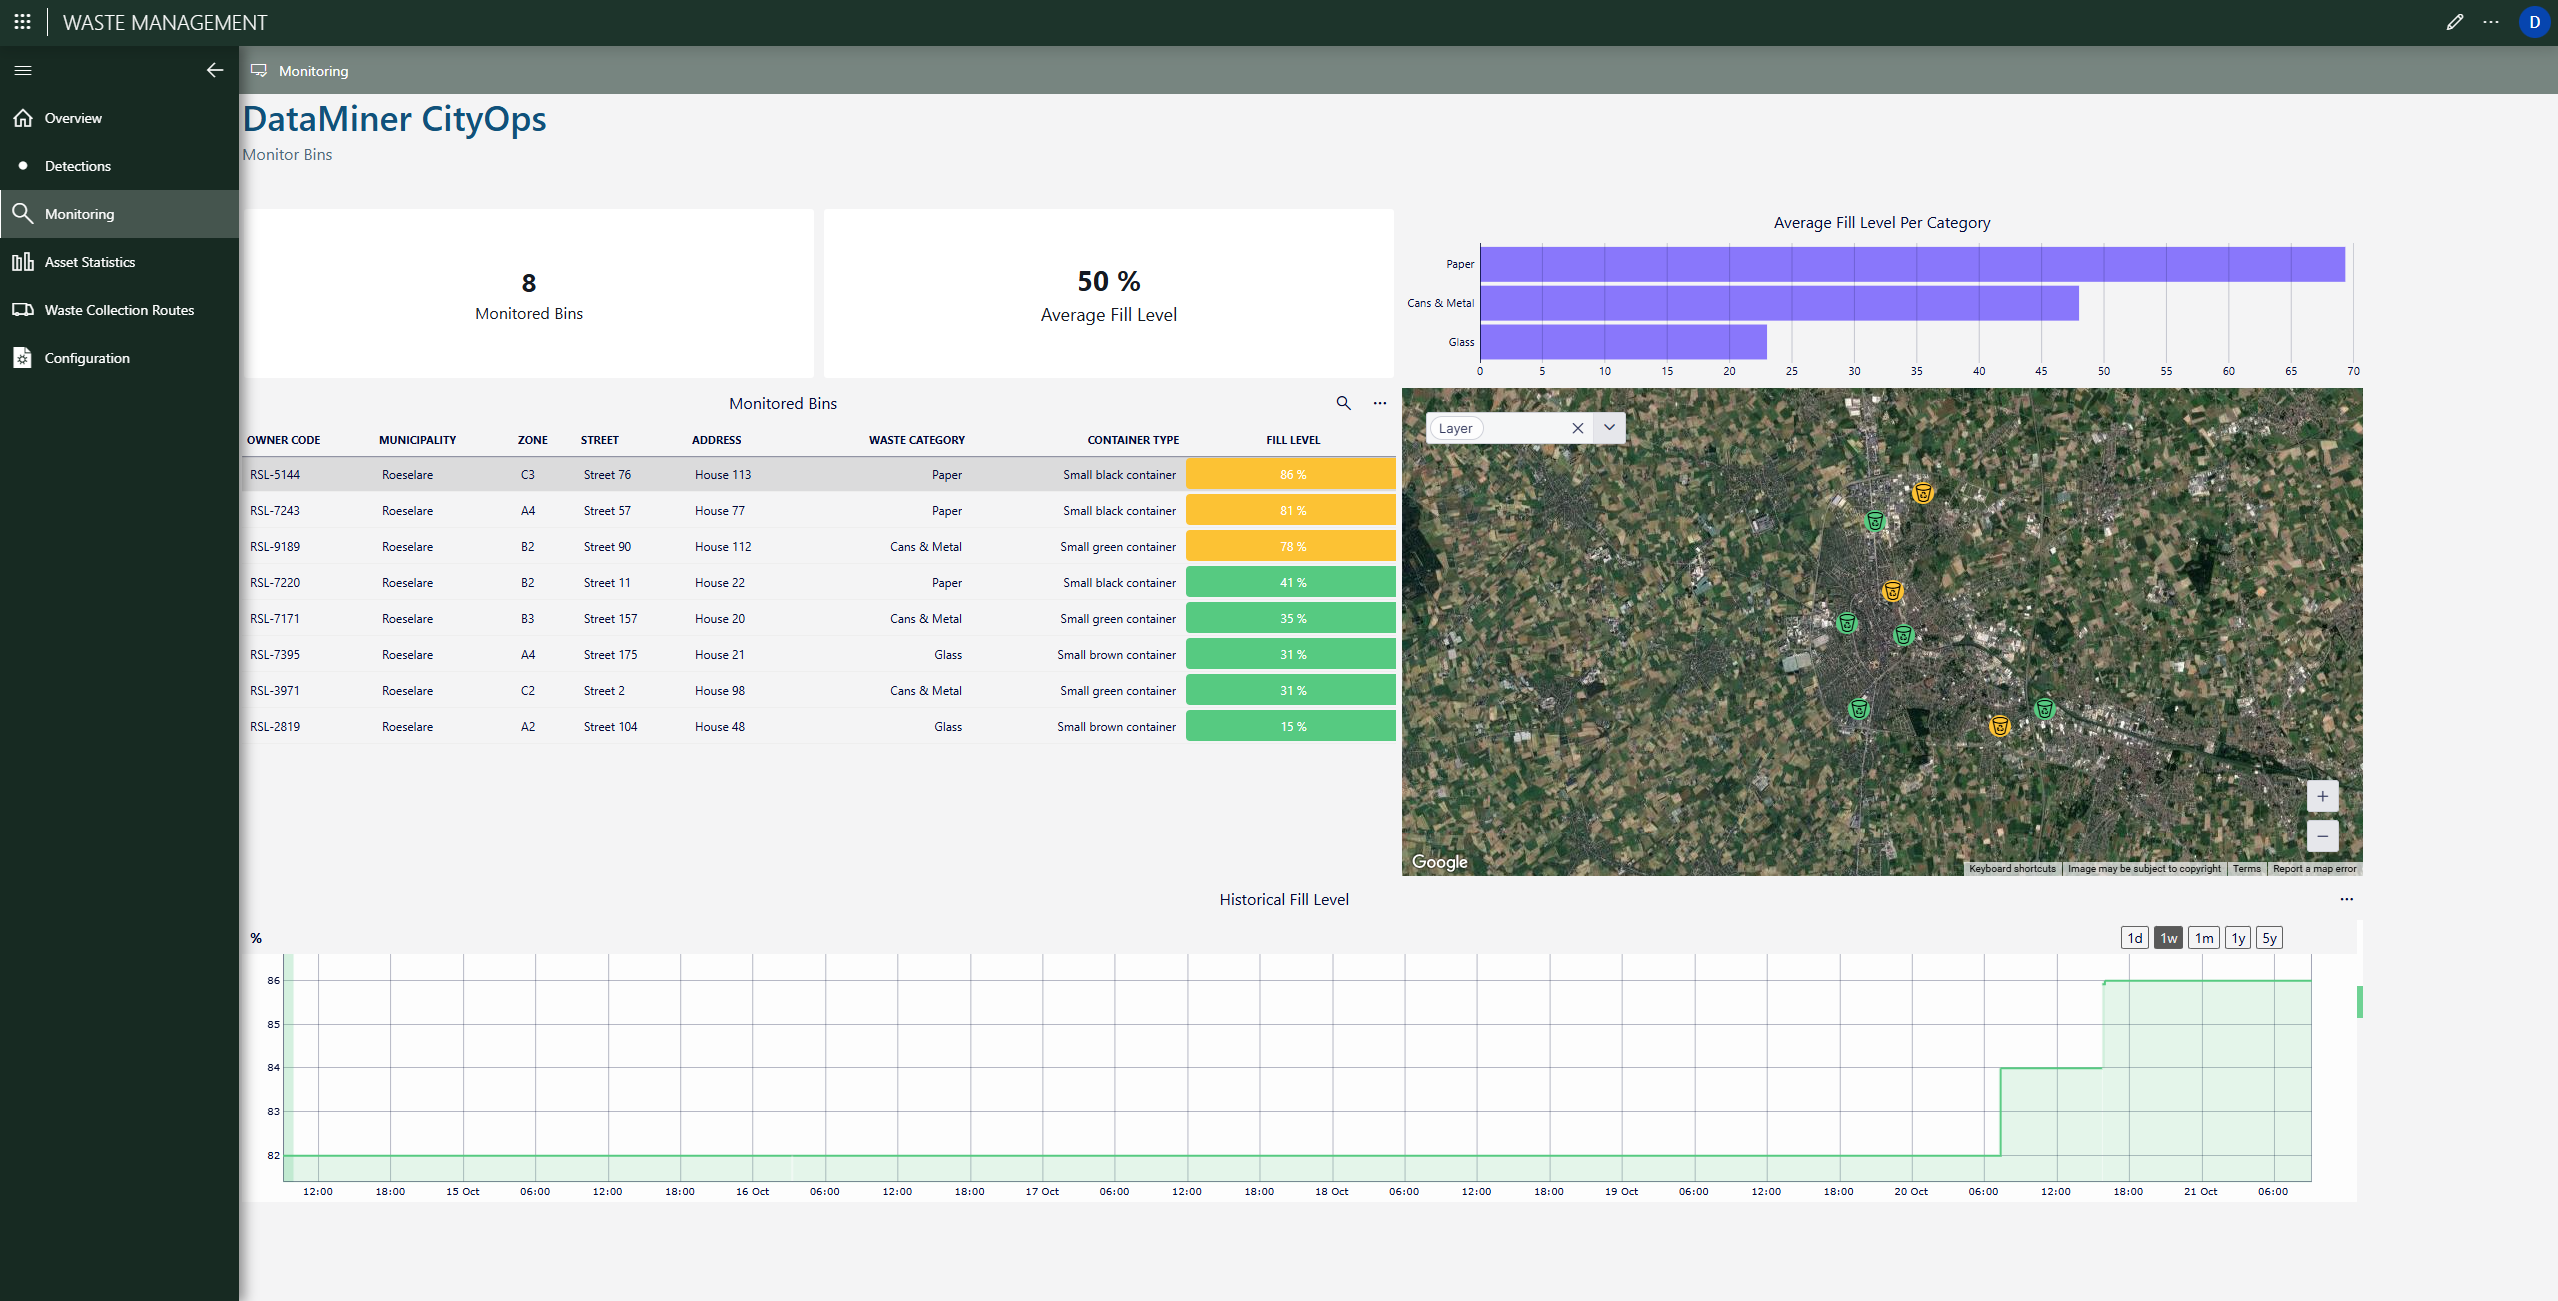
Monitoring dashboard
The Monitoring page combines live fill levels with geospatial visualization. It shows average fill percentage across monitored bins, category-based fill charts, and a real-time map view. Historical fill level graphs help optimize pickup intervals and container allocation, reducing unnecessary truck mileage.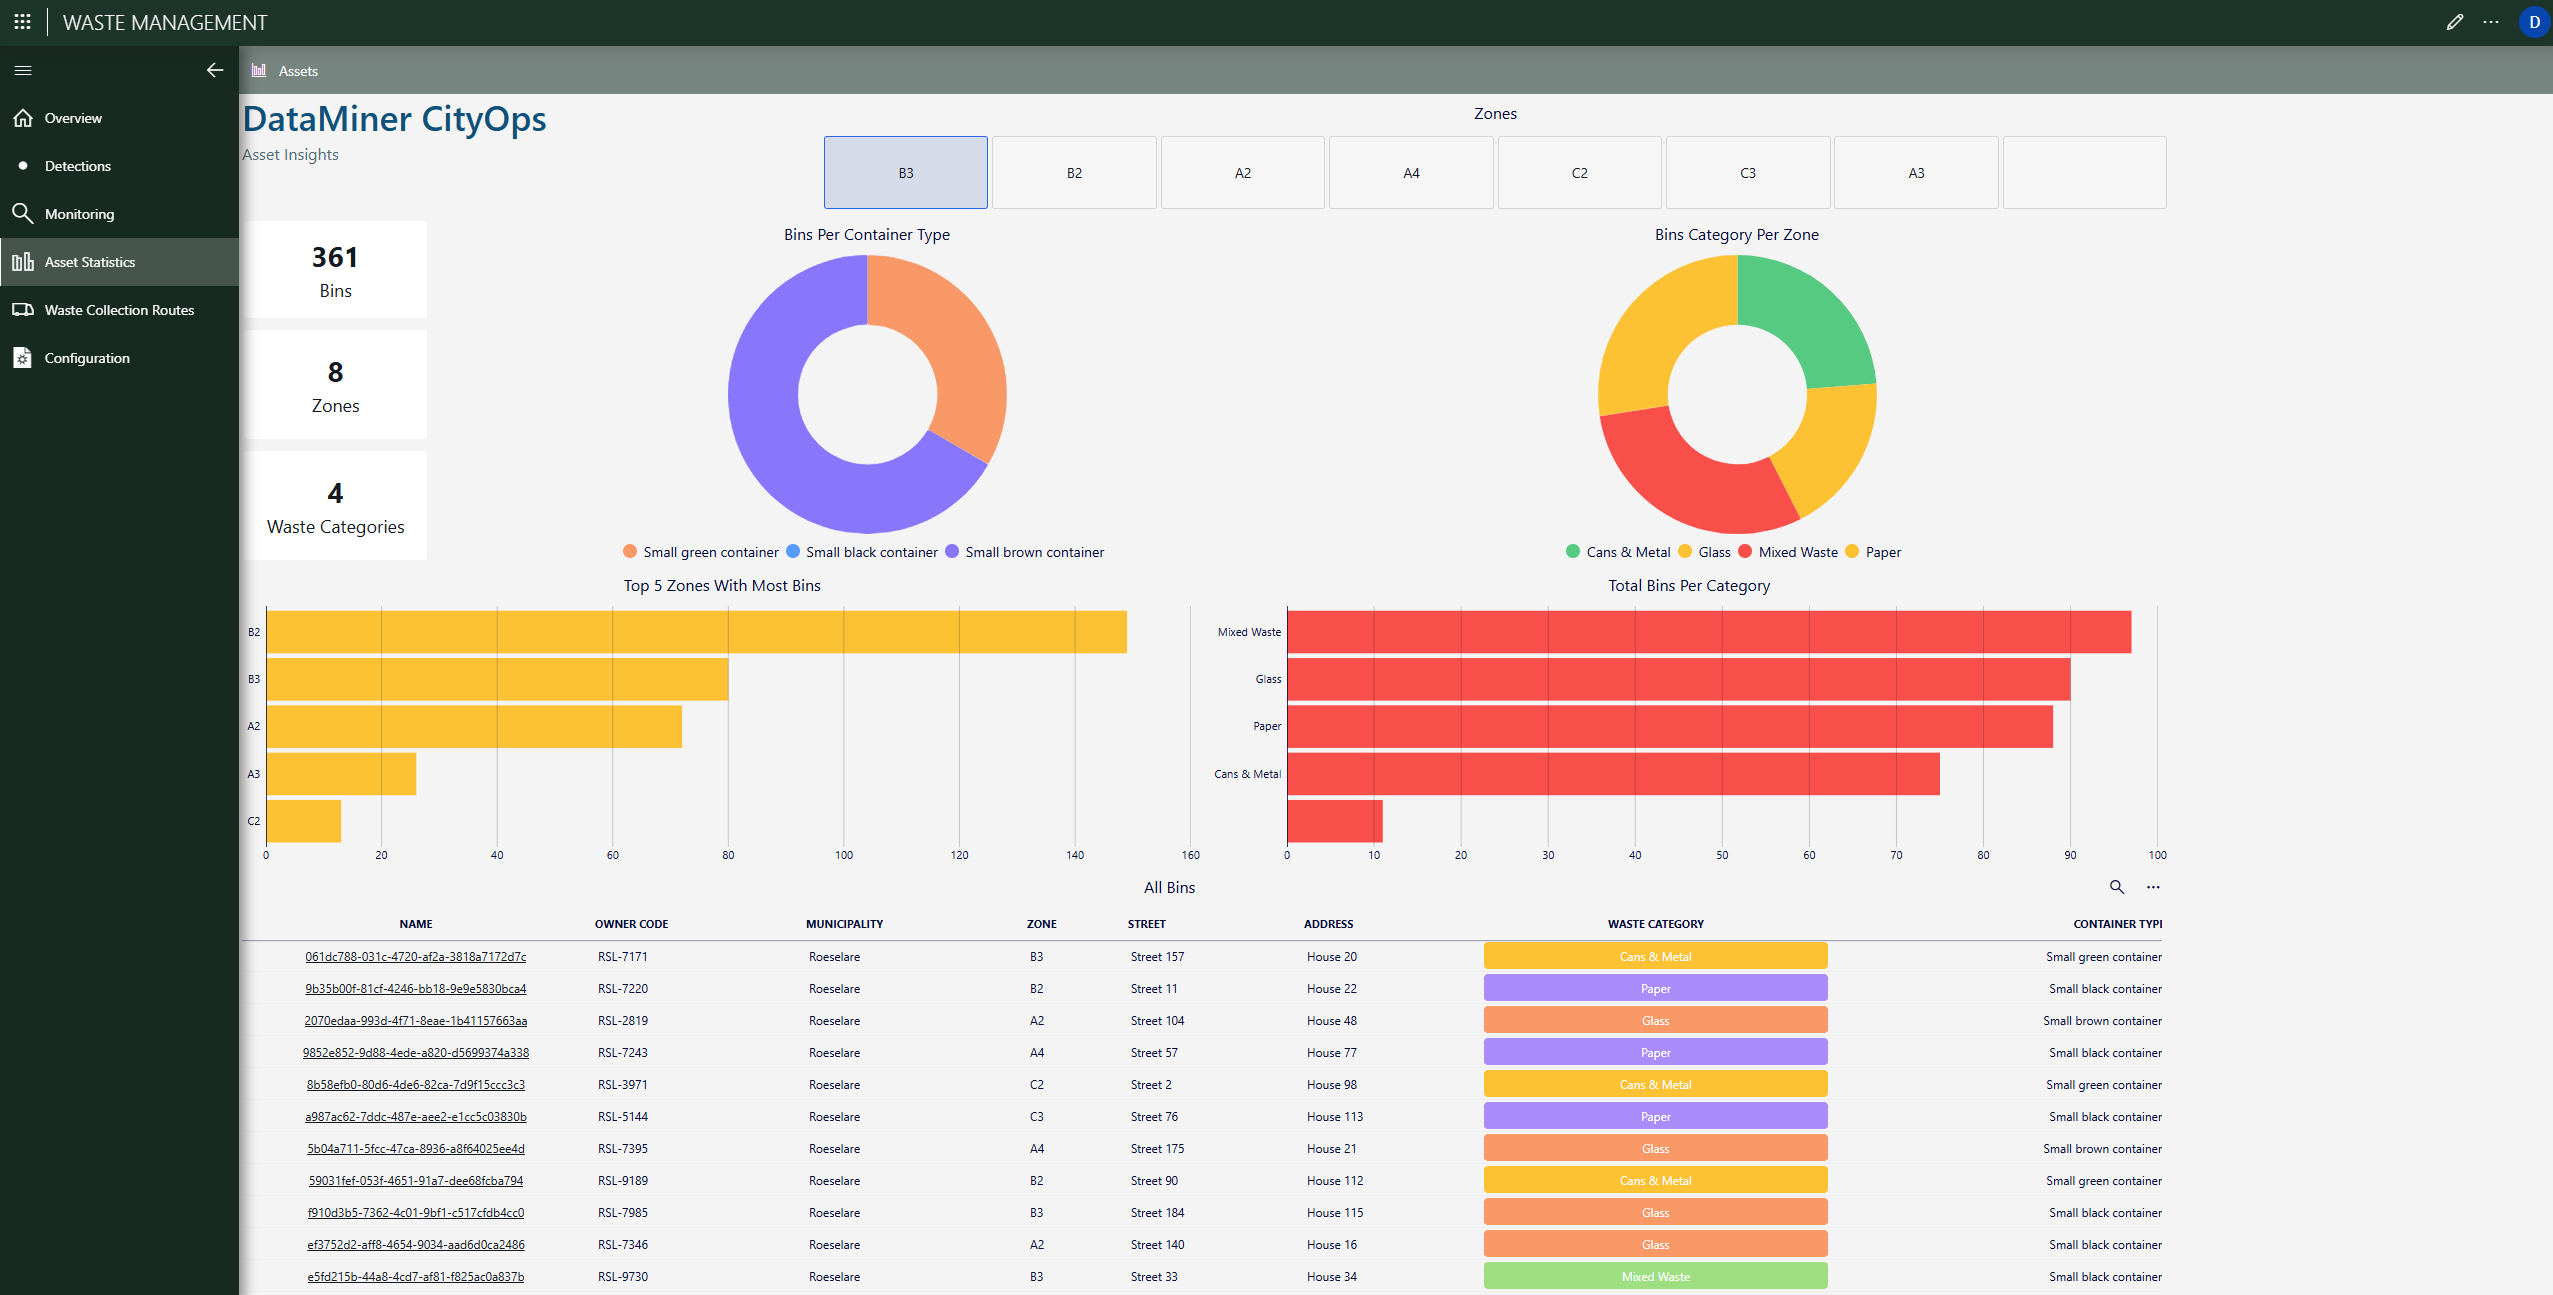
Asset statistics
This section provides high-level analytics on the city’s waste infrastructure. Pie and bar charts reveal the number of bins per container type, total bins per waste category, and the top-performing or most-loaded zones. The detailed asset list below connects this data with actual field assets for quick validation.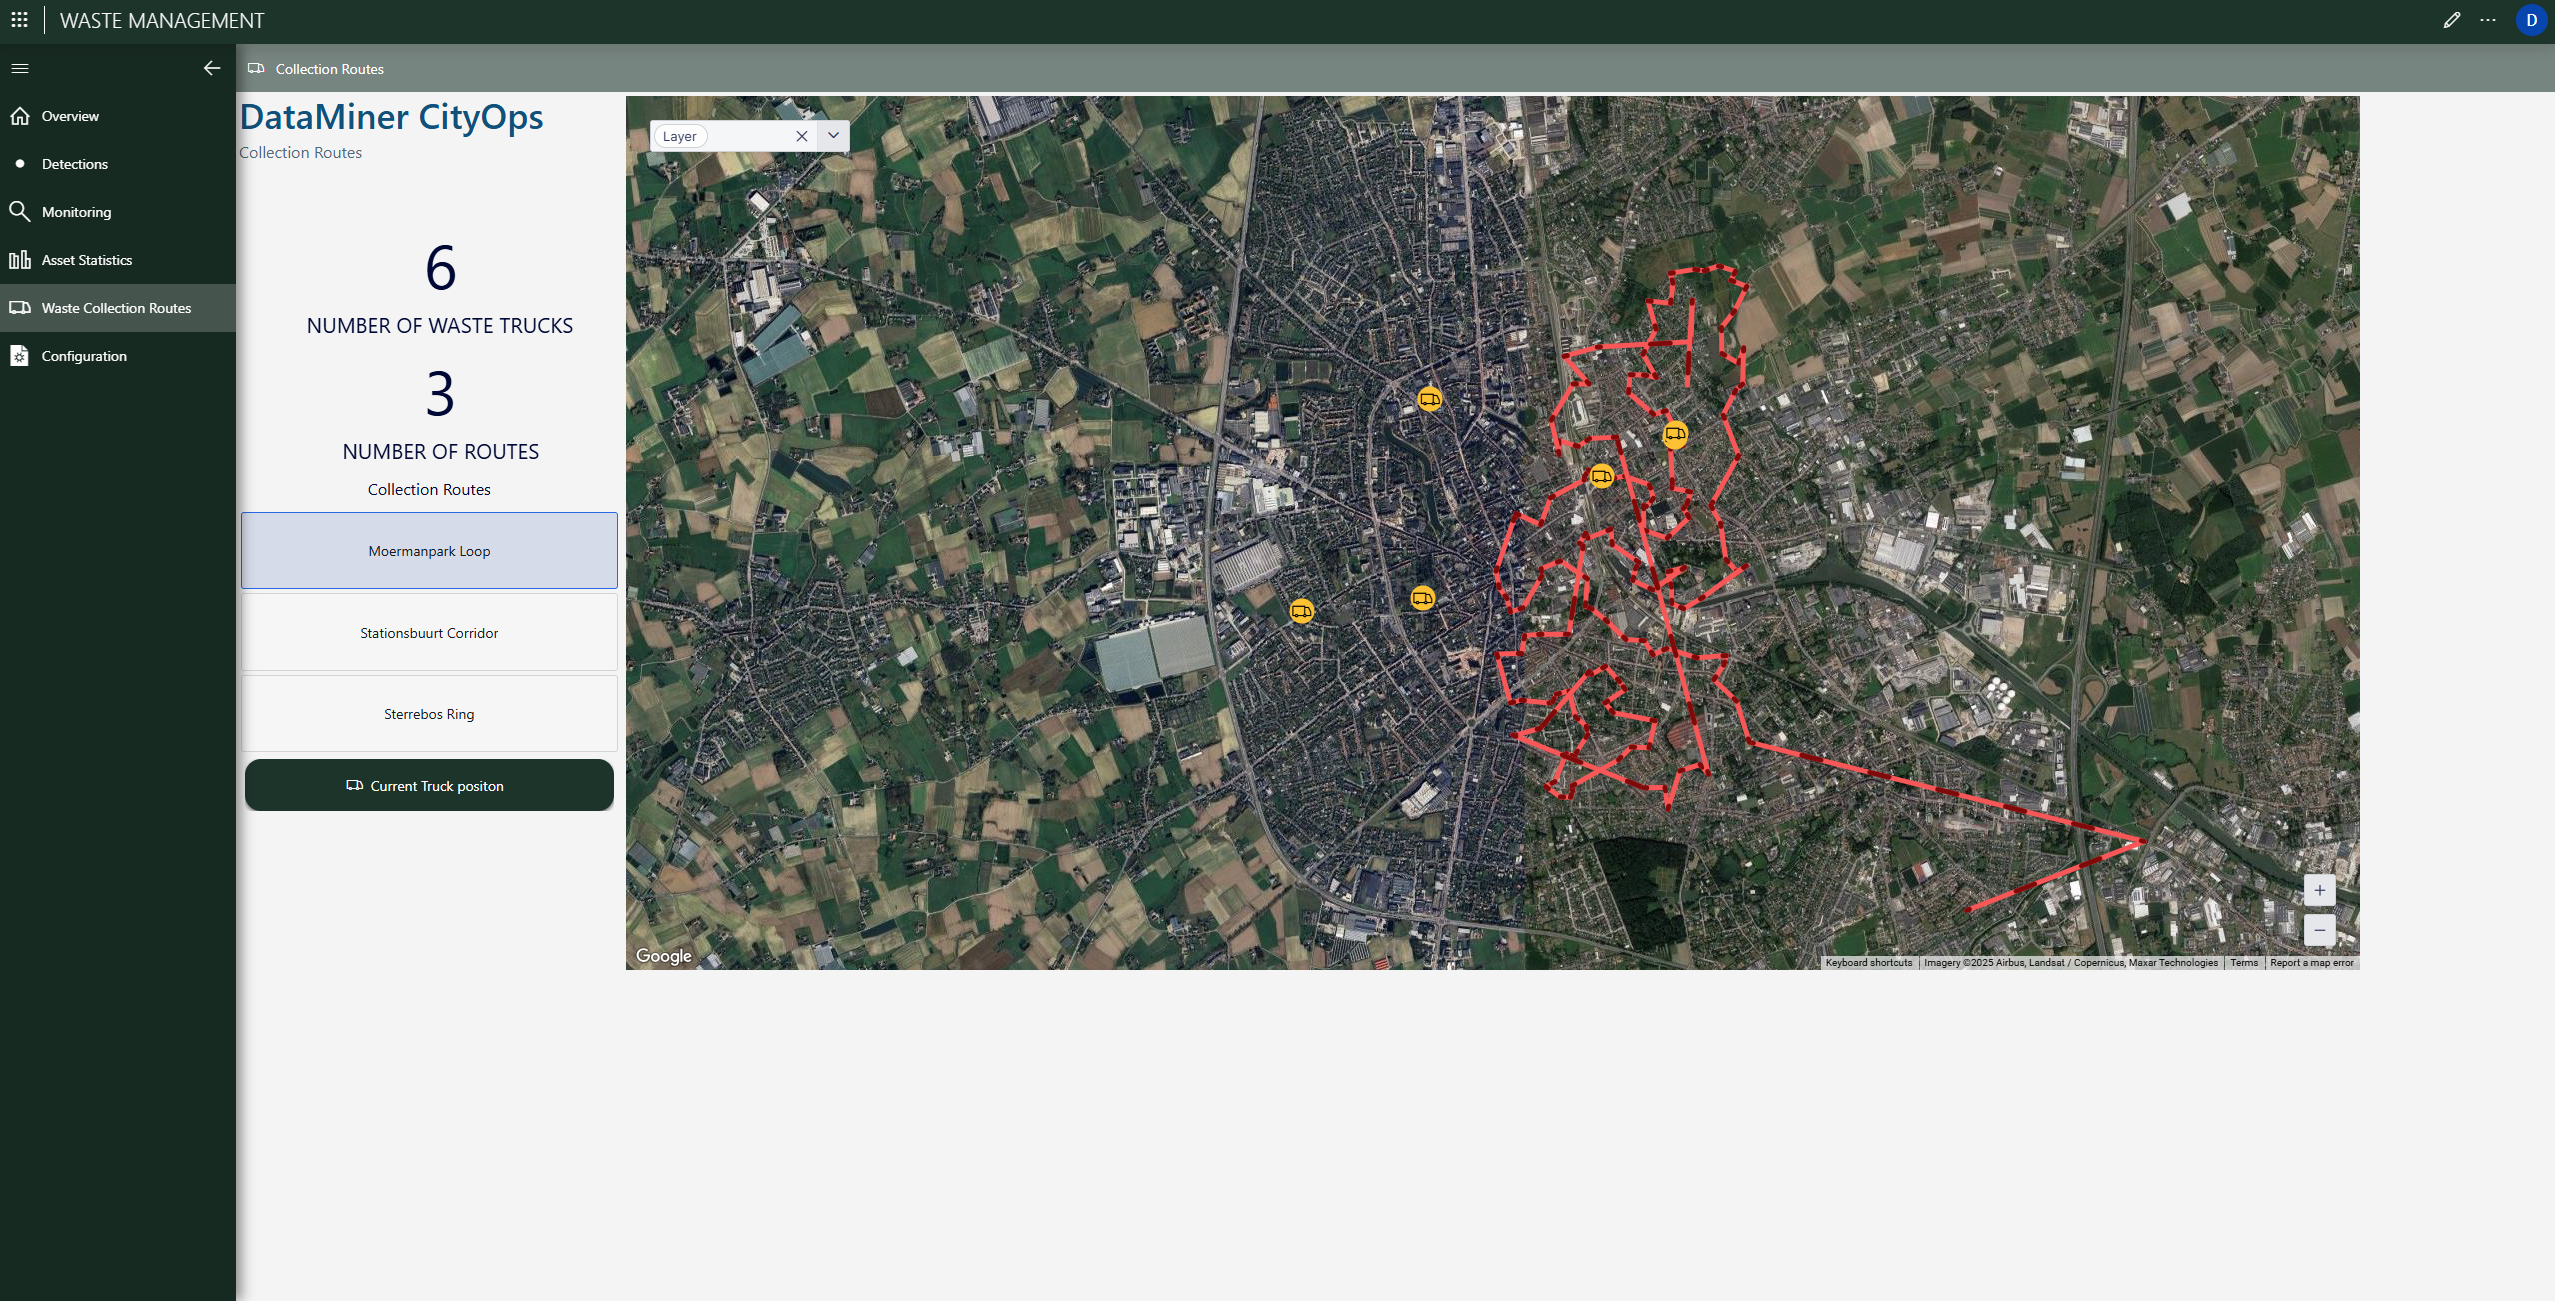
Collection Routes overview
Route management is visualized on a live map. The interface lists active waste trucks and assigned routes, showing clear red paths for each loop. Dispatchers can check route coverage, monitor completion, and see current truck locations to improve coordination and minimize fuel use.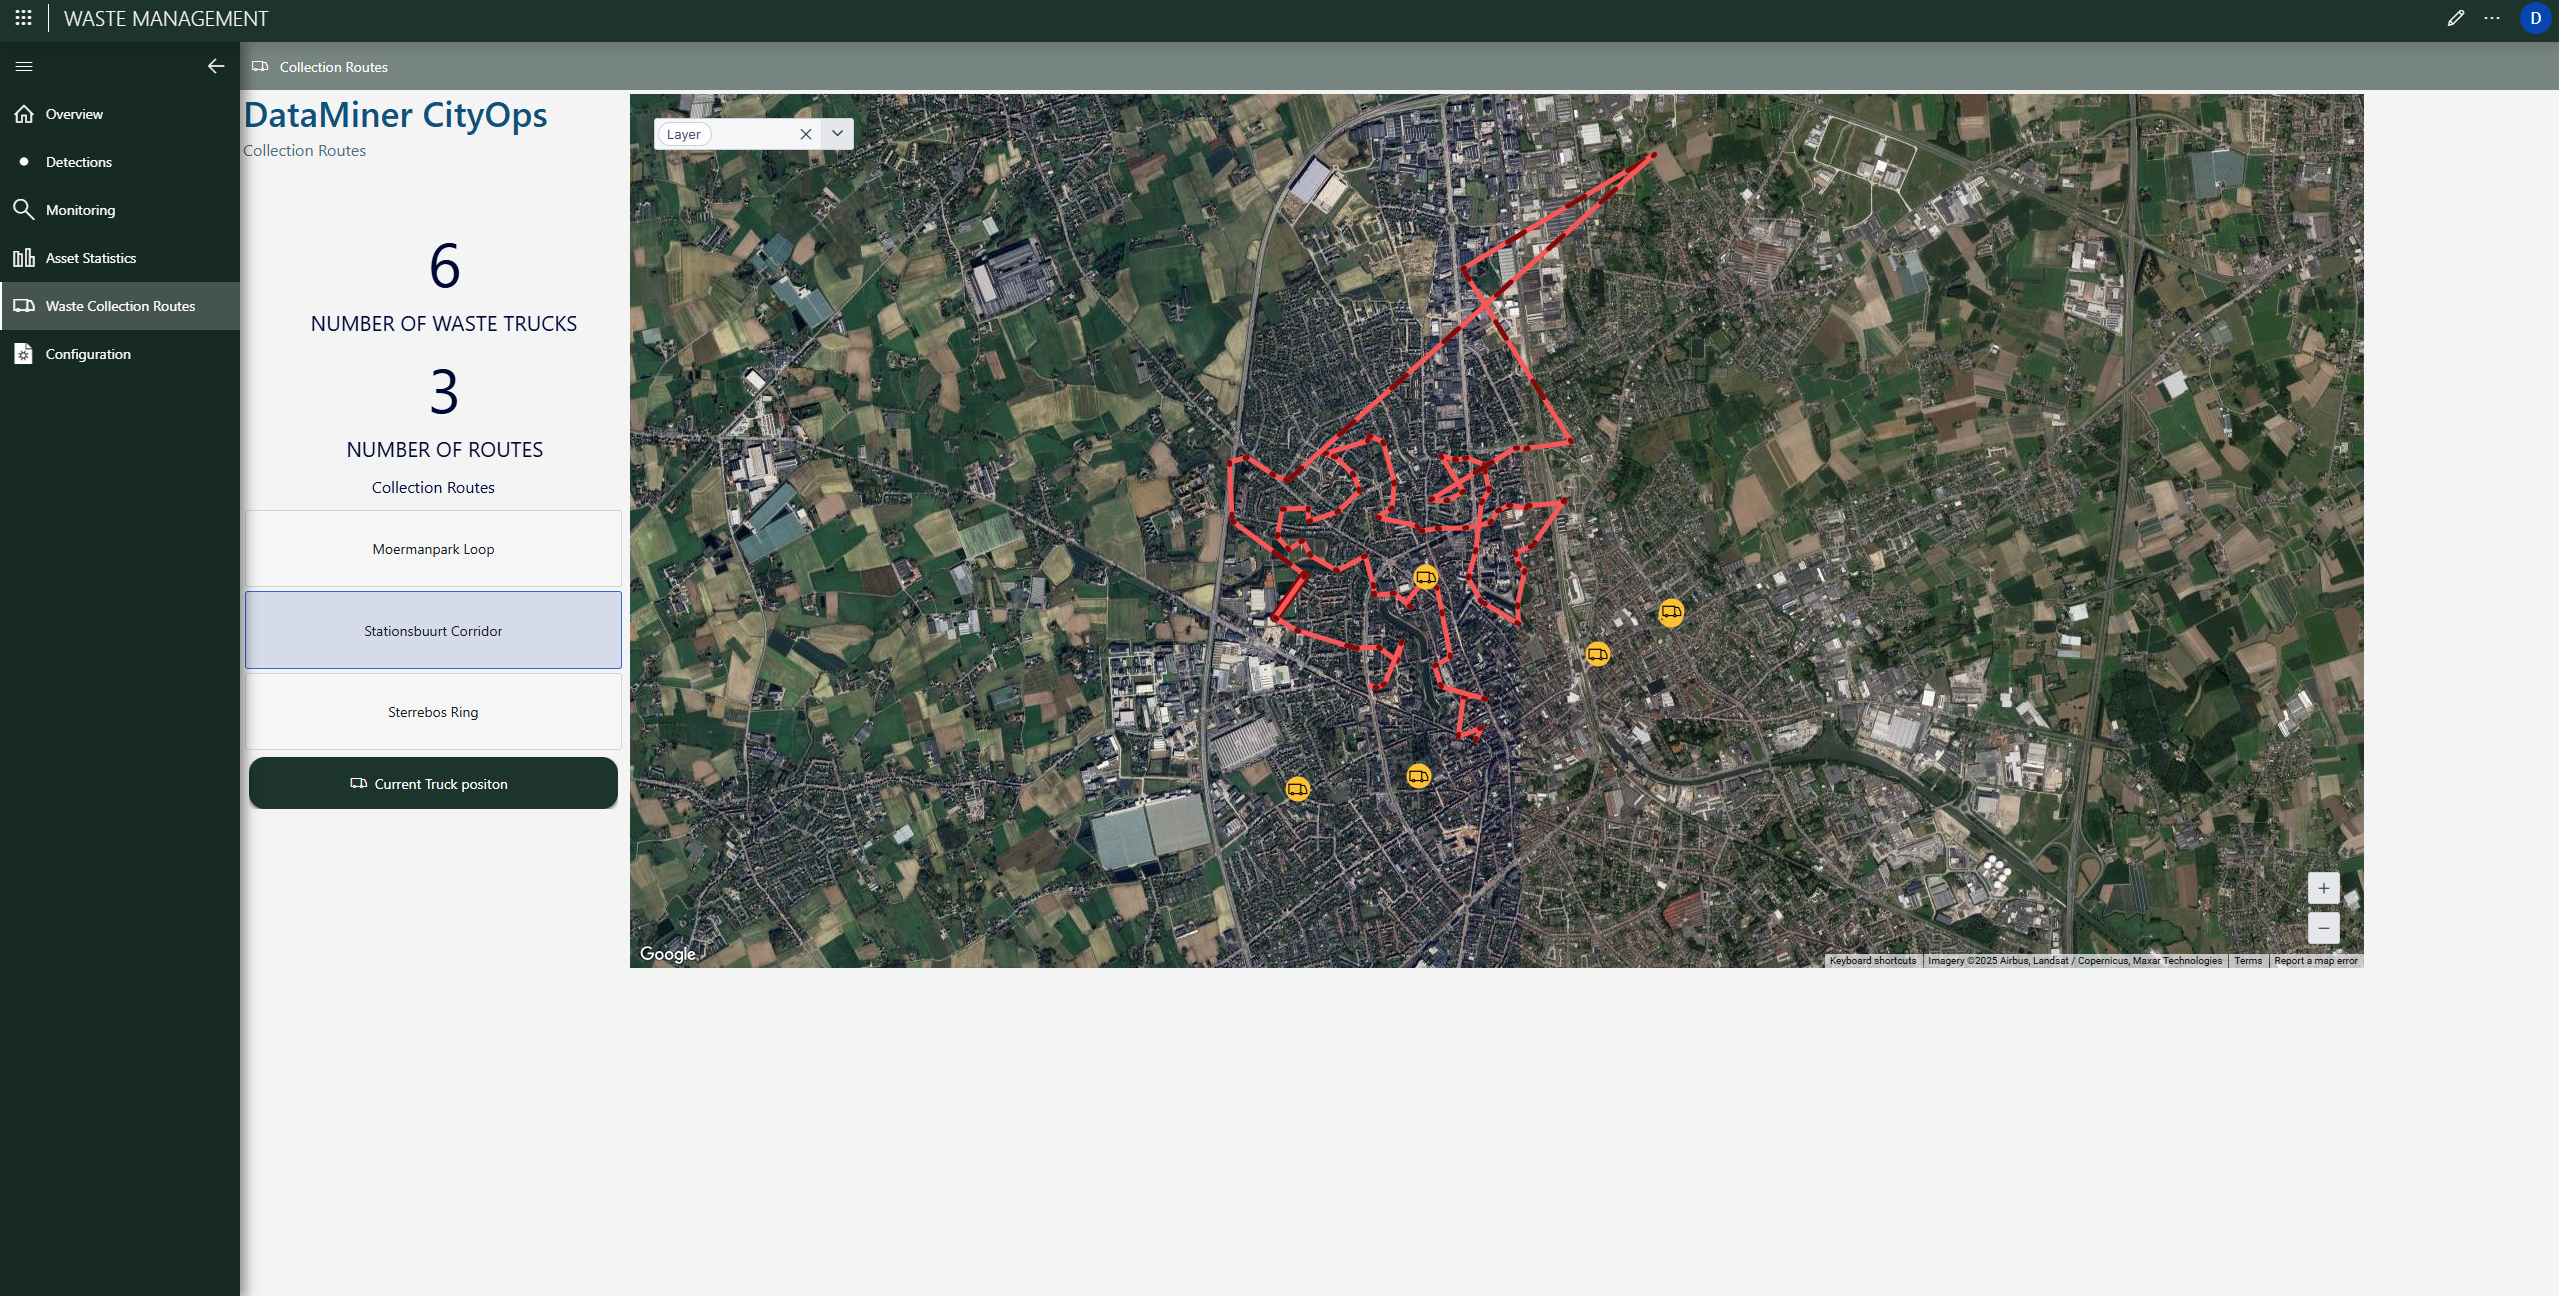
Route switching
This view shows the ability to switch between different collection routes such as "Moermanpark Loop" or "Stationsbuurt Corridor". It allows planners to dynamically reassign resources or adjust schedules when unexpected fill levels or traffic conditions occur.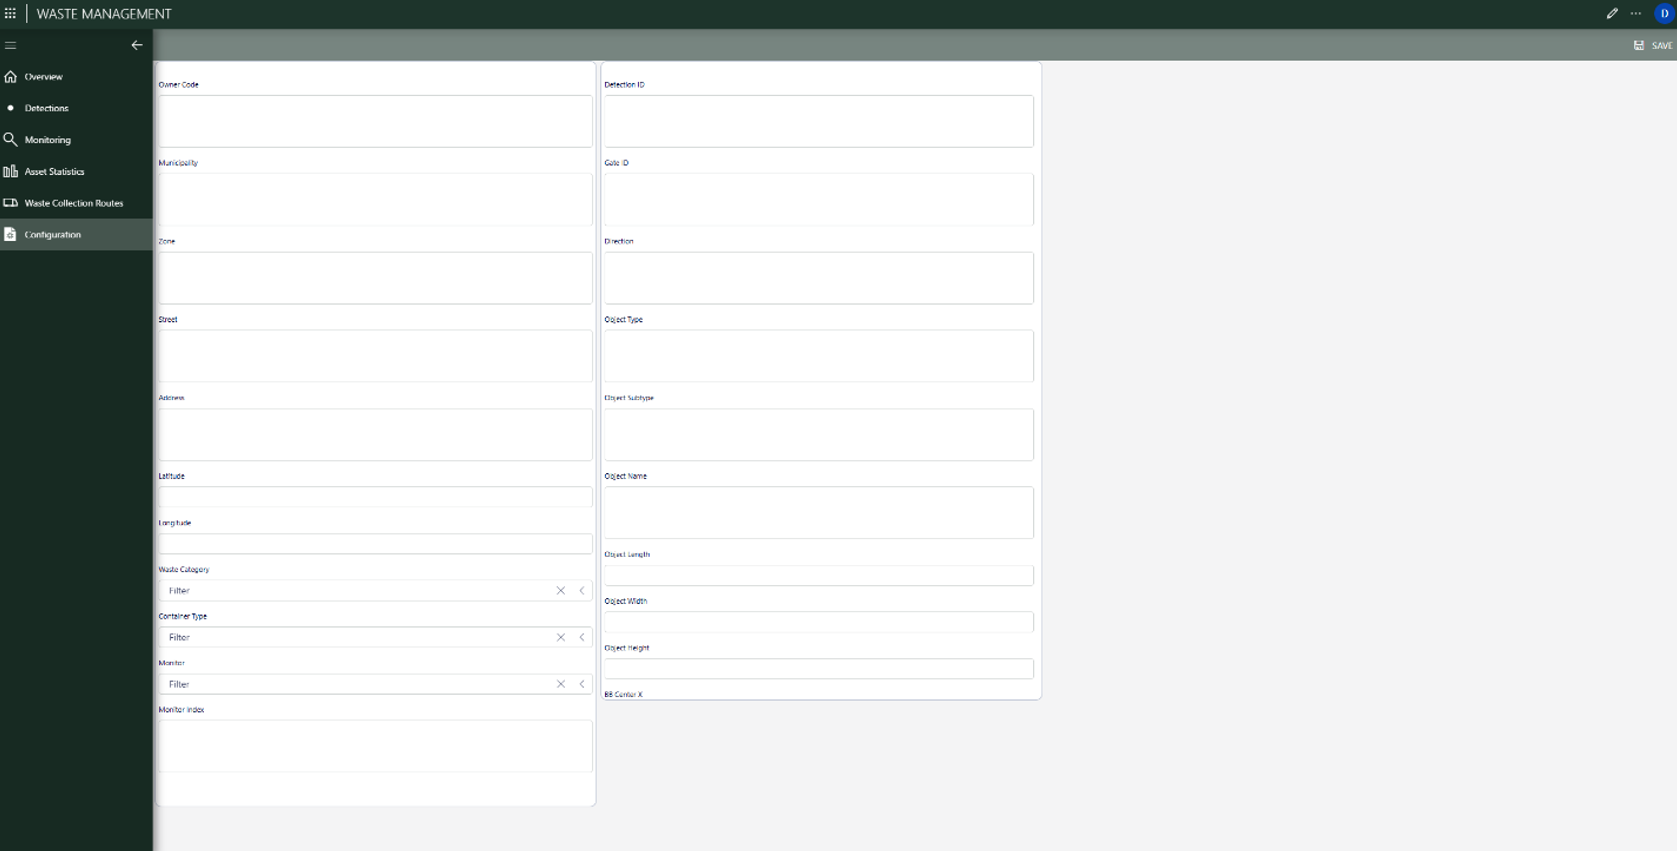
Configuration panel
Administrators use this configuration interface to manage system metadata and customize detection attributes. Fields like "direction", "object type", "dimensions", and "monitoring parameters" can be edited to match local infrastructure and sensor types, ensuring the system stays adaptable without requiring new code.How it works within CityOps
The Waste Management module integrates tightly with other CityOps components. Asset Management provides a central record of bins and ownership data. The Planned Maintenance module automatically schedules service tasks when containers or sensors show anomalies or reach defined thresholds. The Work Orders module transforms detections into actionable field assignments, tracking completion and feedback for continuous improvement.This synergy allows cities to reduce overflow events, improve recycling compliance, lower collection mileage, and extend the lifetime of assets through predictive maintenance and data-backed decisions.
Cities using this module can reduce unnecessary collection trips through predictive fill monitoring, lower fuel use by optimizing truck routing, and prevent overflows with real-time alerts. Maintenance teams respond faster thanks to automatic work order creation, while planners gain actionable insights from data correlations across waste types, time, and geography. The result is a cleaner, more sustainable, and more cost-efficient city operation.