solution Use Case
DataMiner CityOps Mobility Manager
Real-time urban traffic insights through open data and smart analytics
This use case demonstrates how DataMiner CityOps Mobility Manager integrates publicly available APIs to collect and visualize live route traffic conditions across the city. Traffic data is continuously gathered, analyzed, and trended over time to provide accurate statistics and predict congestion. Integrated smart cameras at major traffic points enhance these insights by automatically identifying and classifying vehicles, enabling advanced recognition and predictive analytics based on vehicle type and flow. This approach delivers actionable mobility intelligence, allowing cities to plan and optimize infrastructure investments without immediately deploying a full-scale smart traffic camera network.
The system also communicates live traffic conditions through the DataMiner CityOps Communication Hub. This enables automated information sharing across multiple channels, including digital signage throughout the city, ensuring that drivers, passengers, and citizens receive real-time updates about congestion, incidents, and route availability.
USE CASE DETAILS
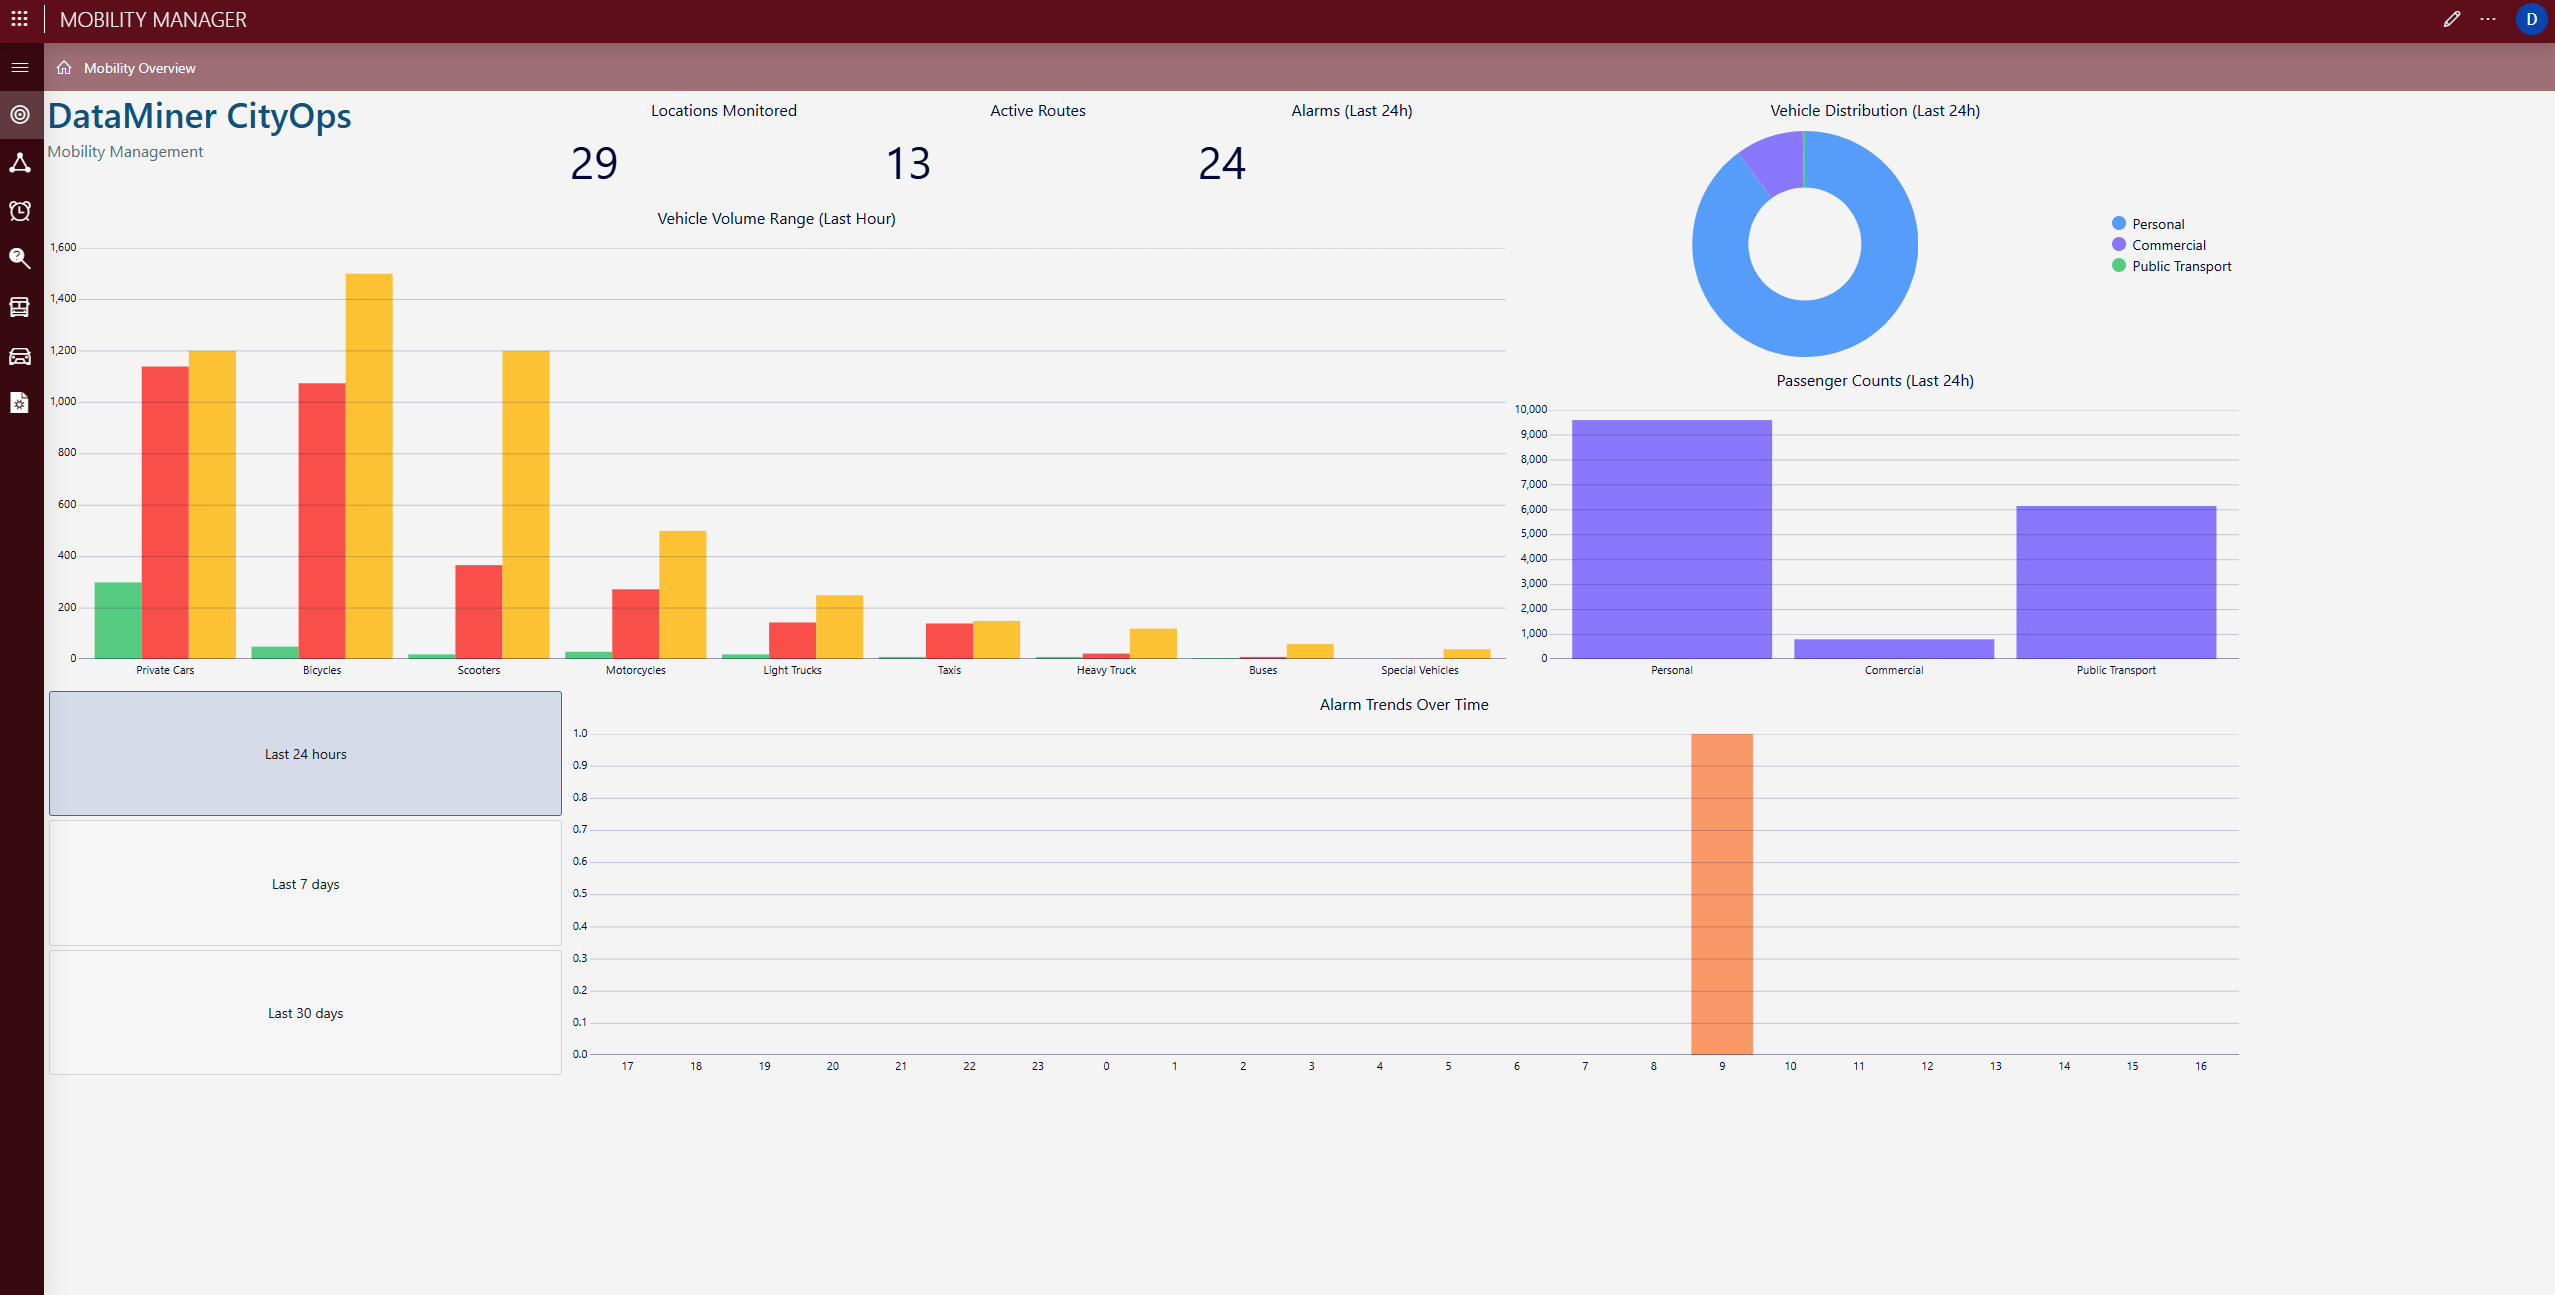 The Mobility Overview page presents a city-wide view of monitored locations, active routes, and detected alarms. It visualizes vehicle distribution, volume ranges by type, and passenger counts, offering valuable insights into overall mobility trends and daily transport behavior.
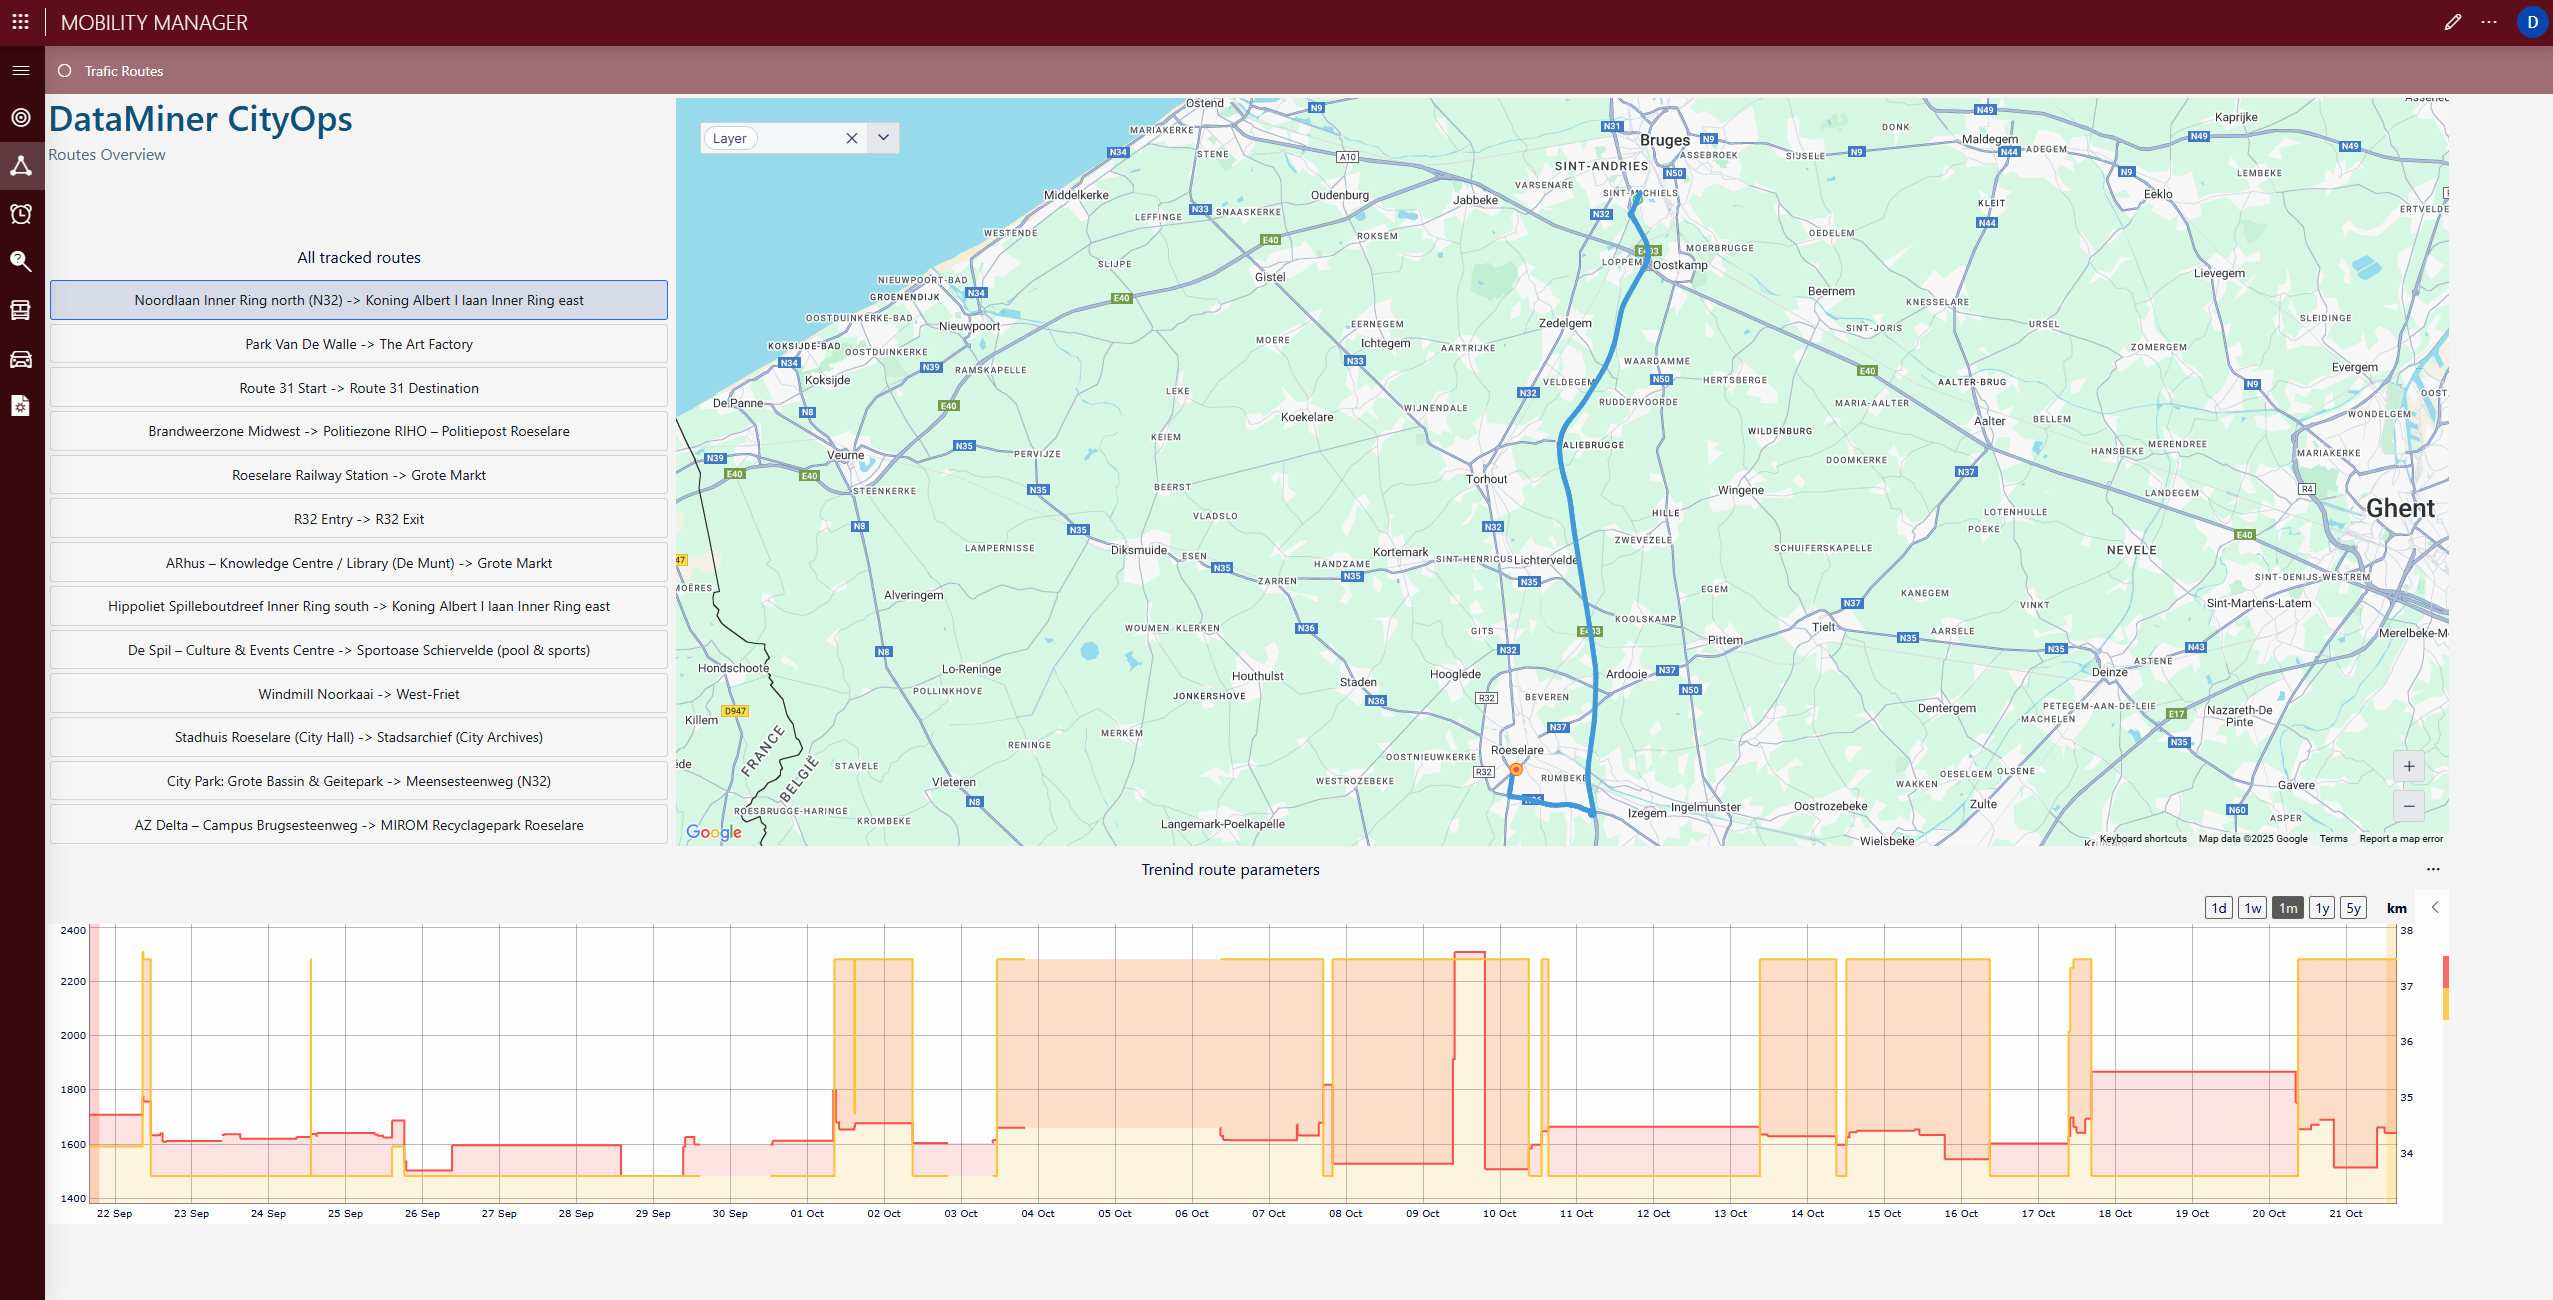
The Routes Overview page offers live tracking of all monitored routes on an interactive city map. Historical route data and trend parameters provide a clear picture of how traffic patterns evolve, supporting better route management and congestion prediction.
The Mobility Overview page presents a city-wide view of monitored locations, active routes, and detected alarms. It visualizes vehicle distribution, volume ranges by type, and passenger counts, offering valuable insights into overall mobility trends and daily transport behavior.
The Routes Overview page offers live tracking of all monitored routes on an interactive city map. Historical route data and trend parameters provide a clear picture of how traffic patterns evolve, supporting better route management and congestion prediction.
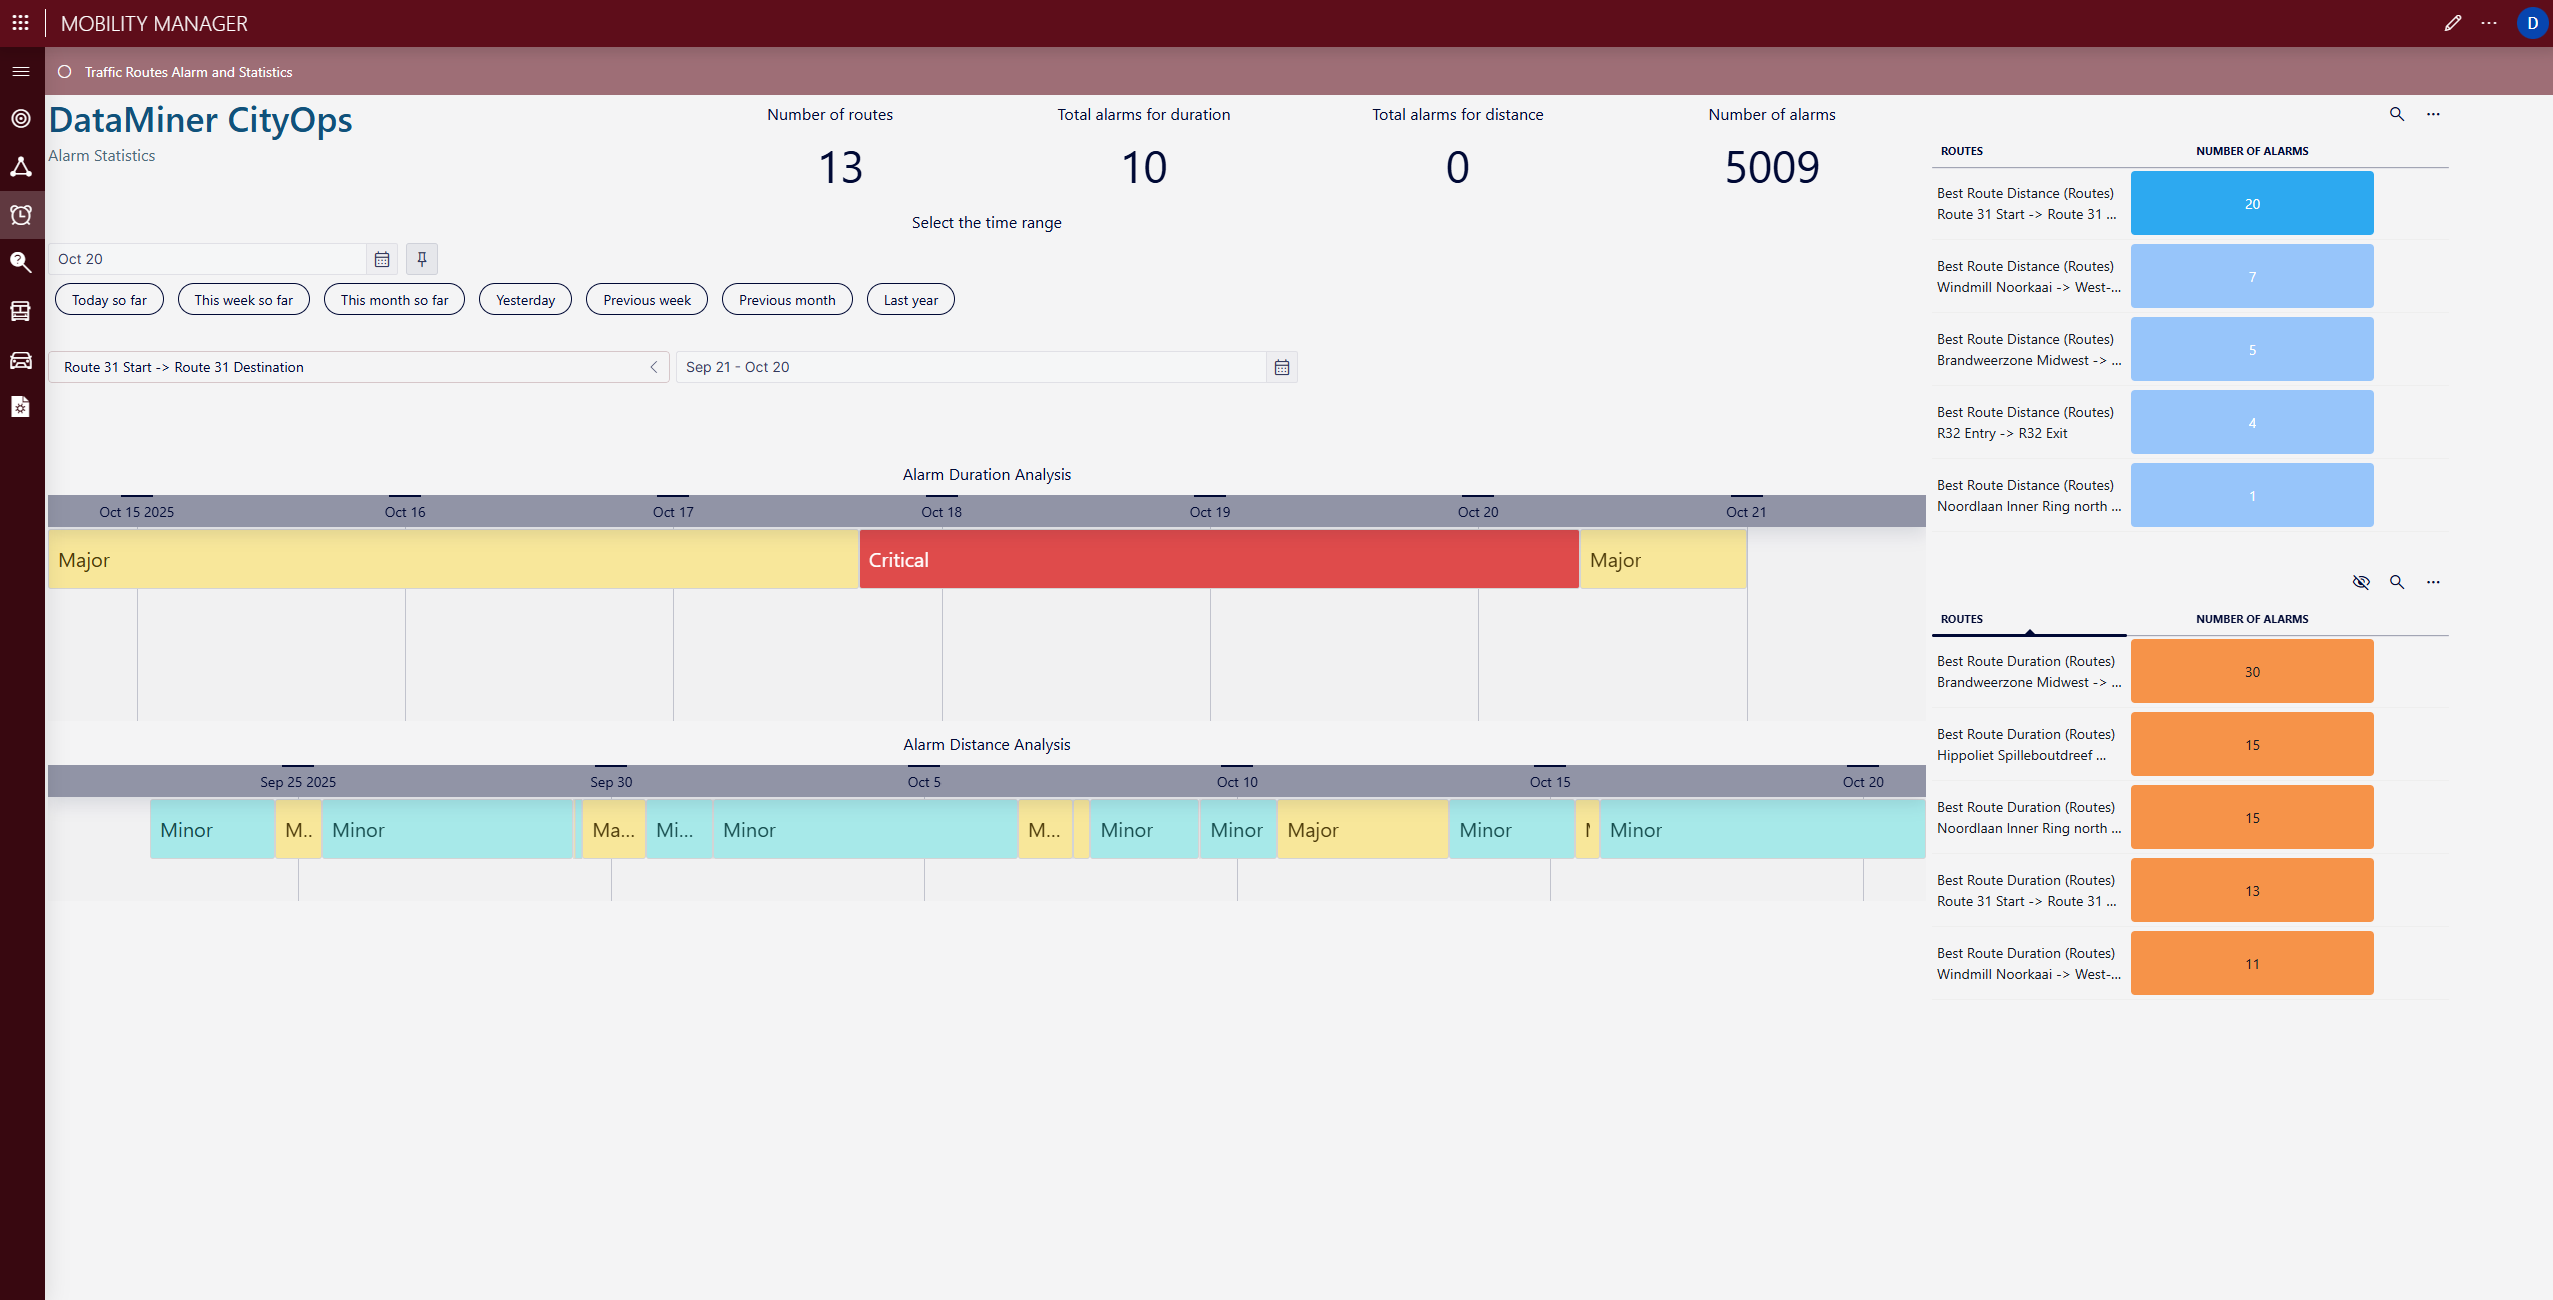 The Alarm and Statistics page focuses on analyzing alarms by duration and distance, helping to identify recurring issues and critical routes with frequent congestion or operational anomalies.
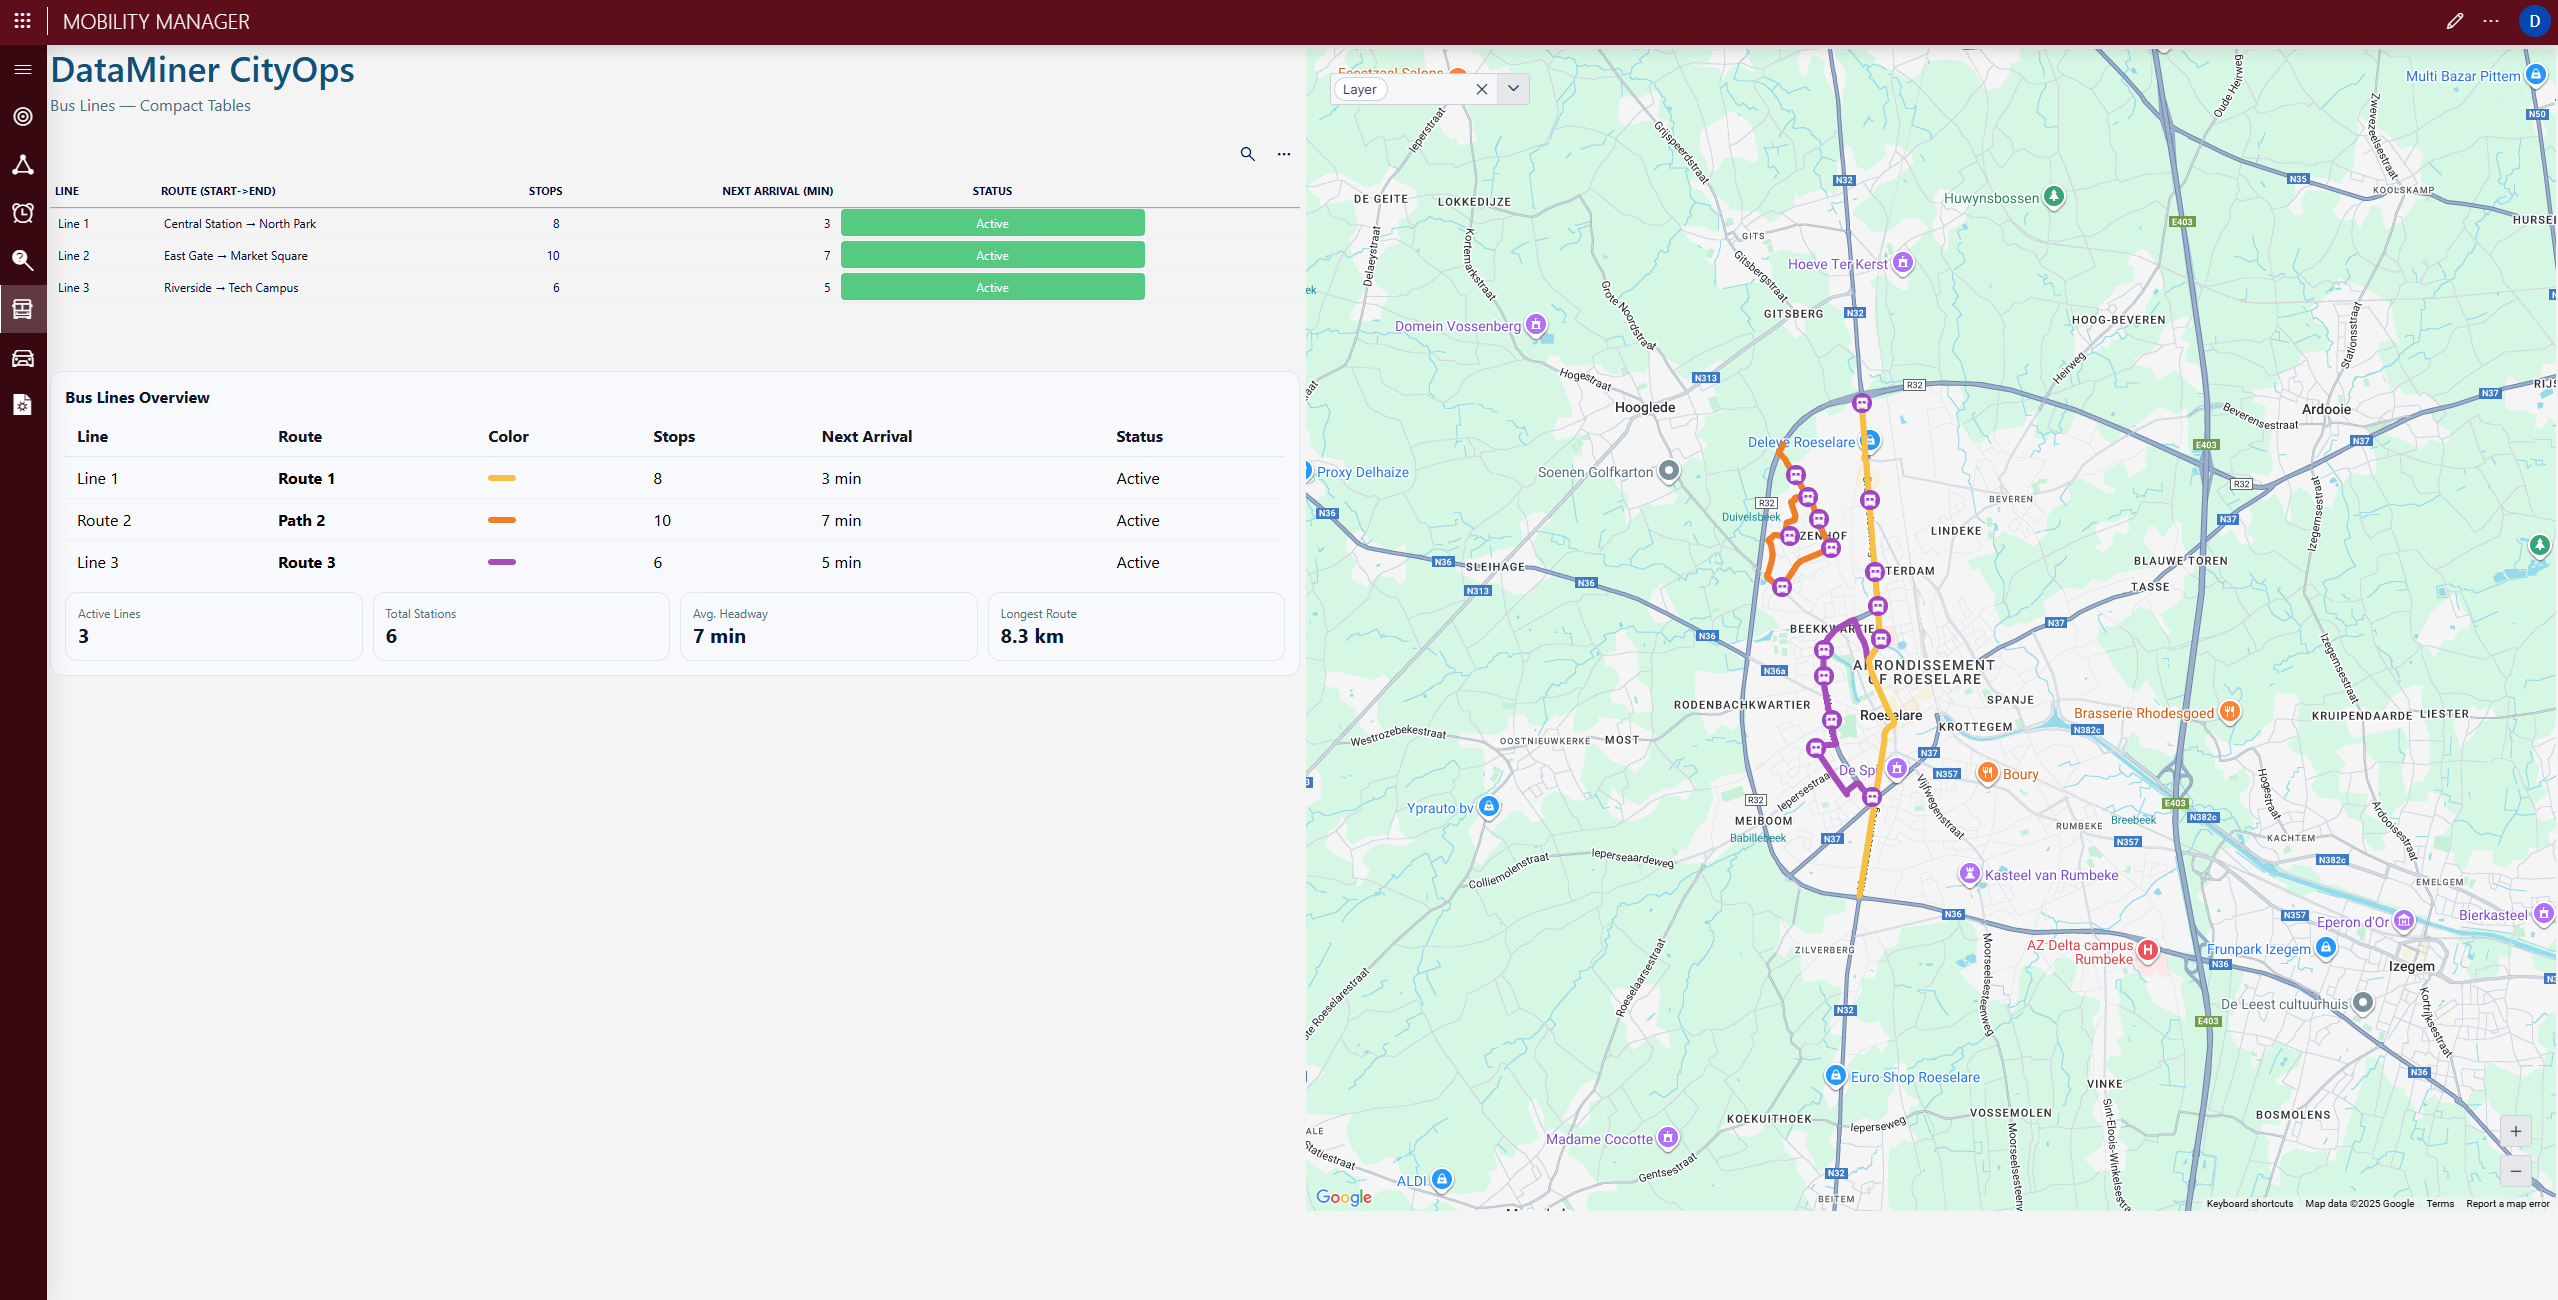 The Bus Lines Overview page maps all active public transport lines with stop locations, headway intervals, and estimated arrival times. It supports both city mobility planners and operational teams by providing a complete view of the public transport network.
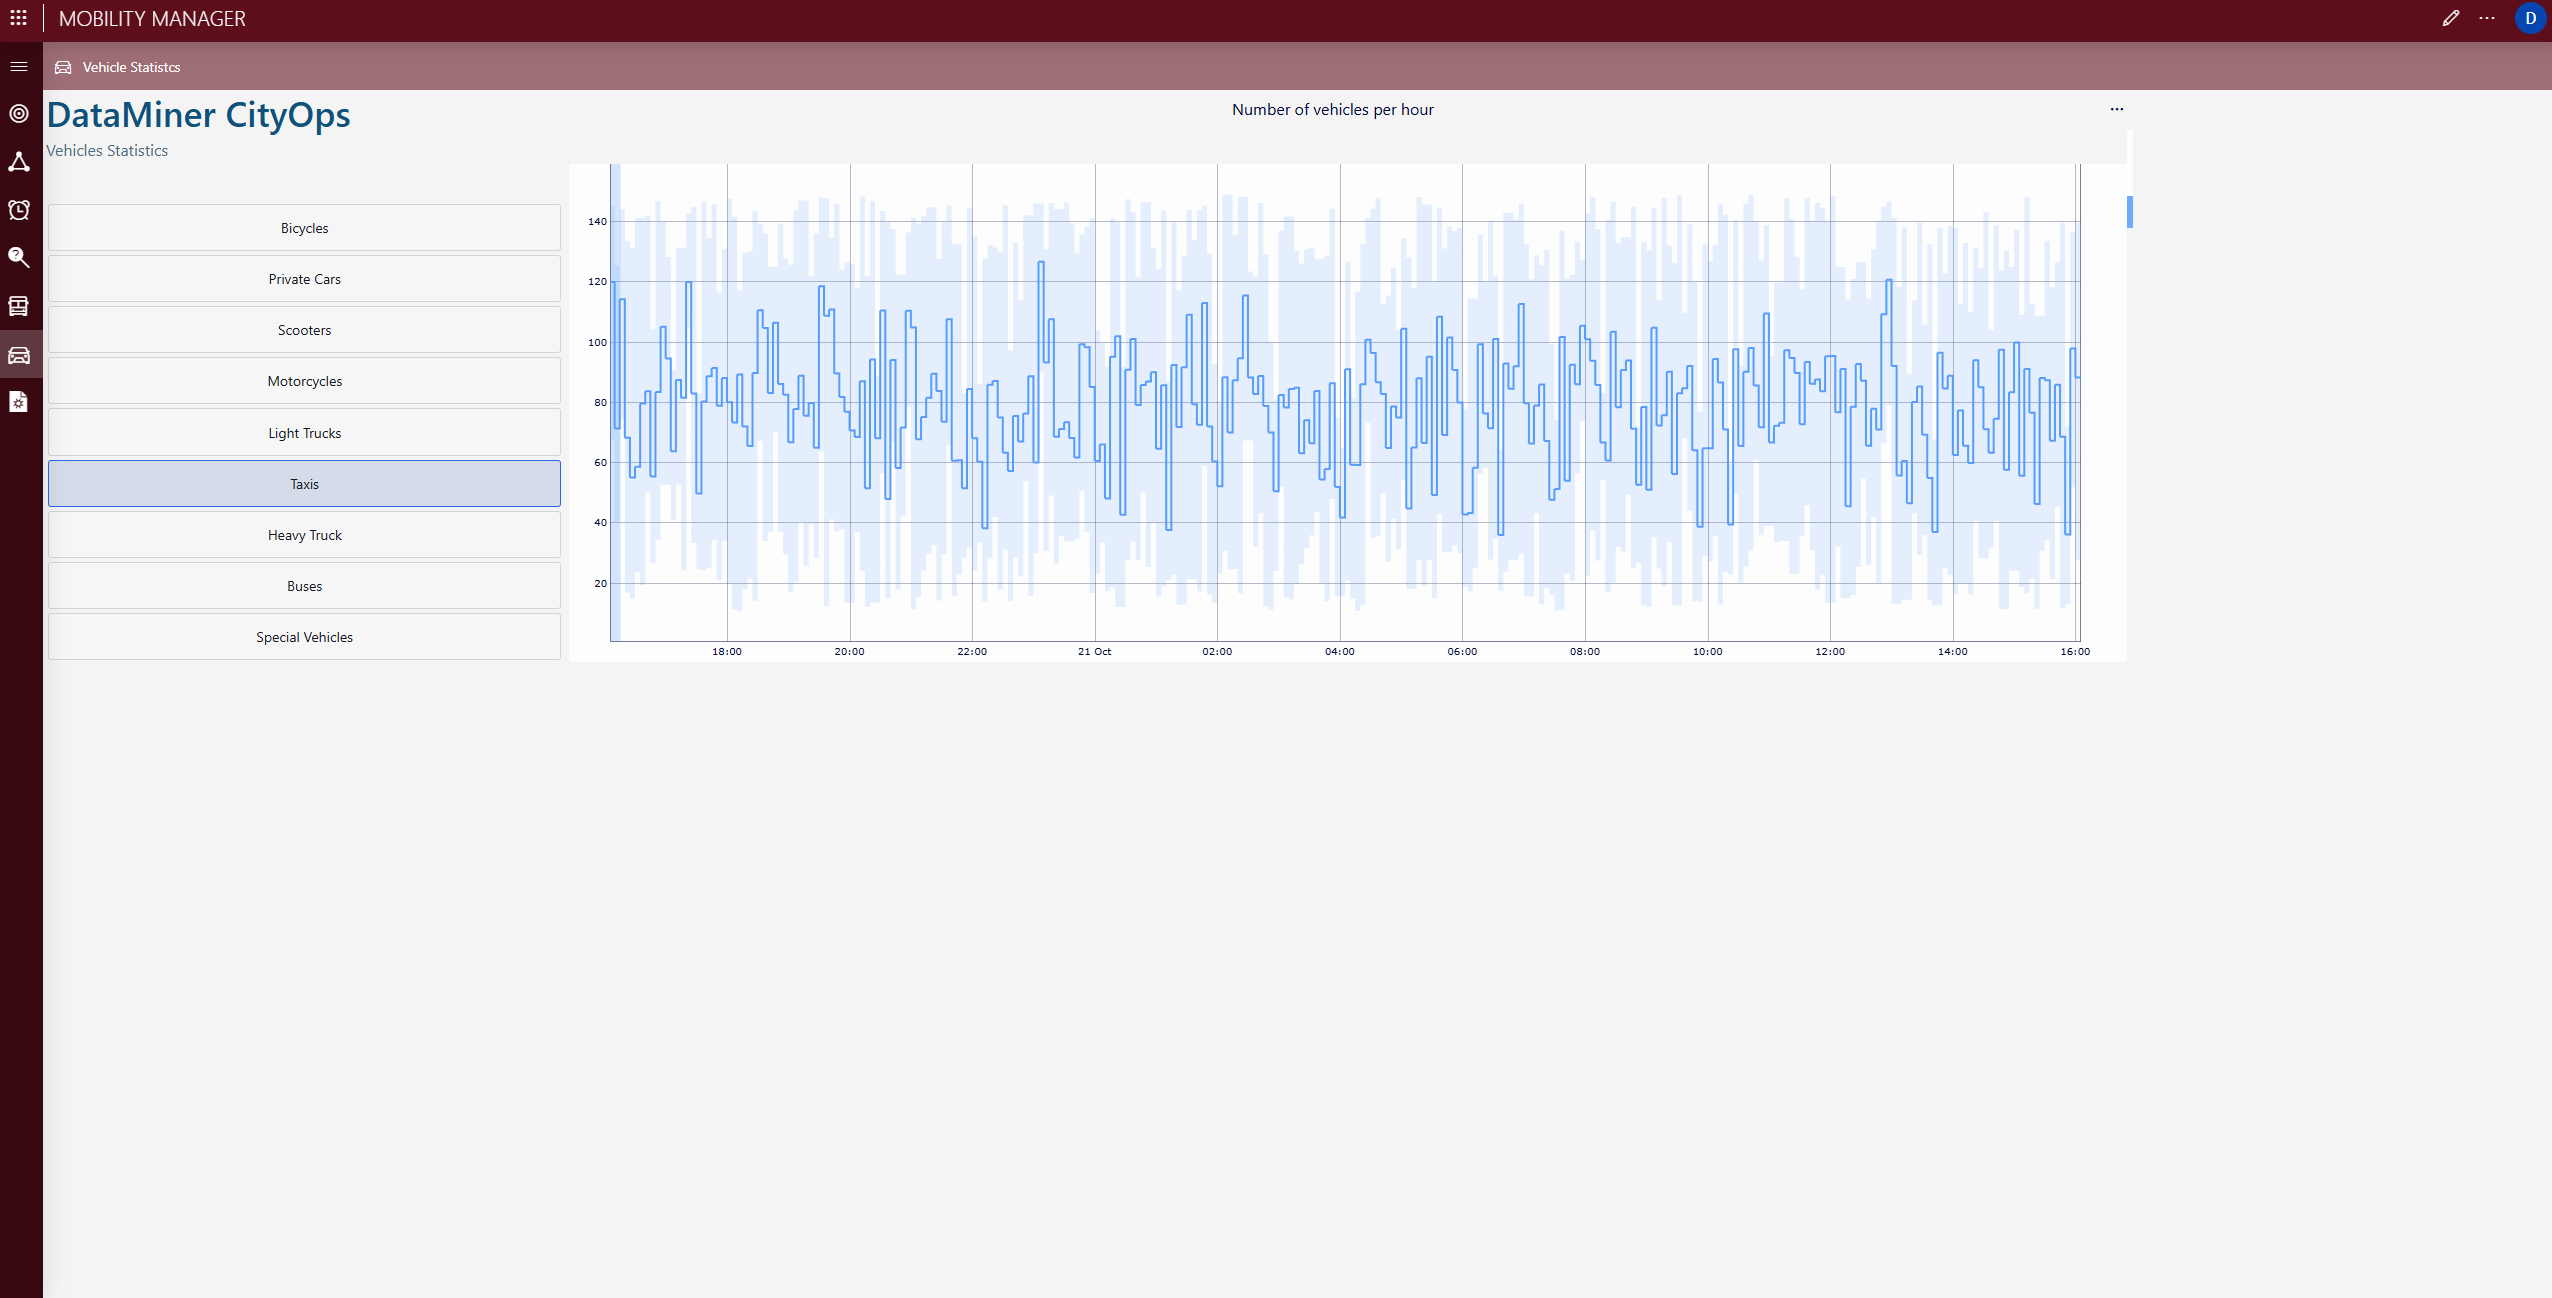 On the Vehicle Statistics page, you can track real-time and historical data for specific vehicle categories such as bicycles, private cars, taxis, or buses. Hourly trends and variations help understand mobility flows and peak times, enabling evidence-based transport planning.
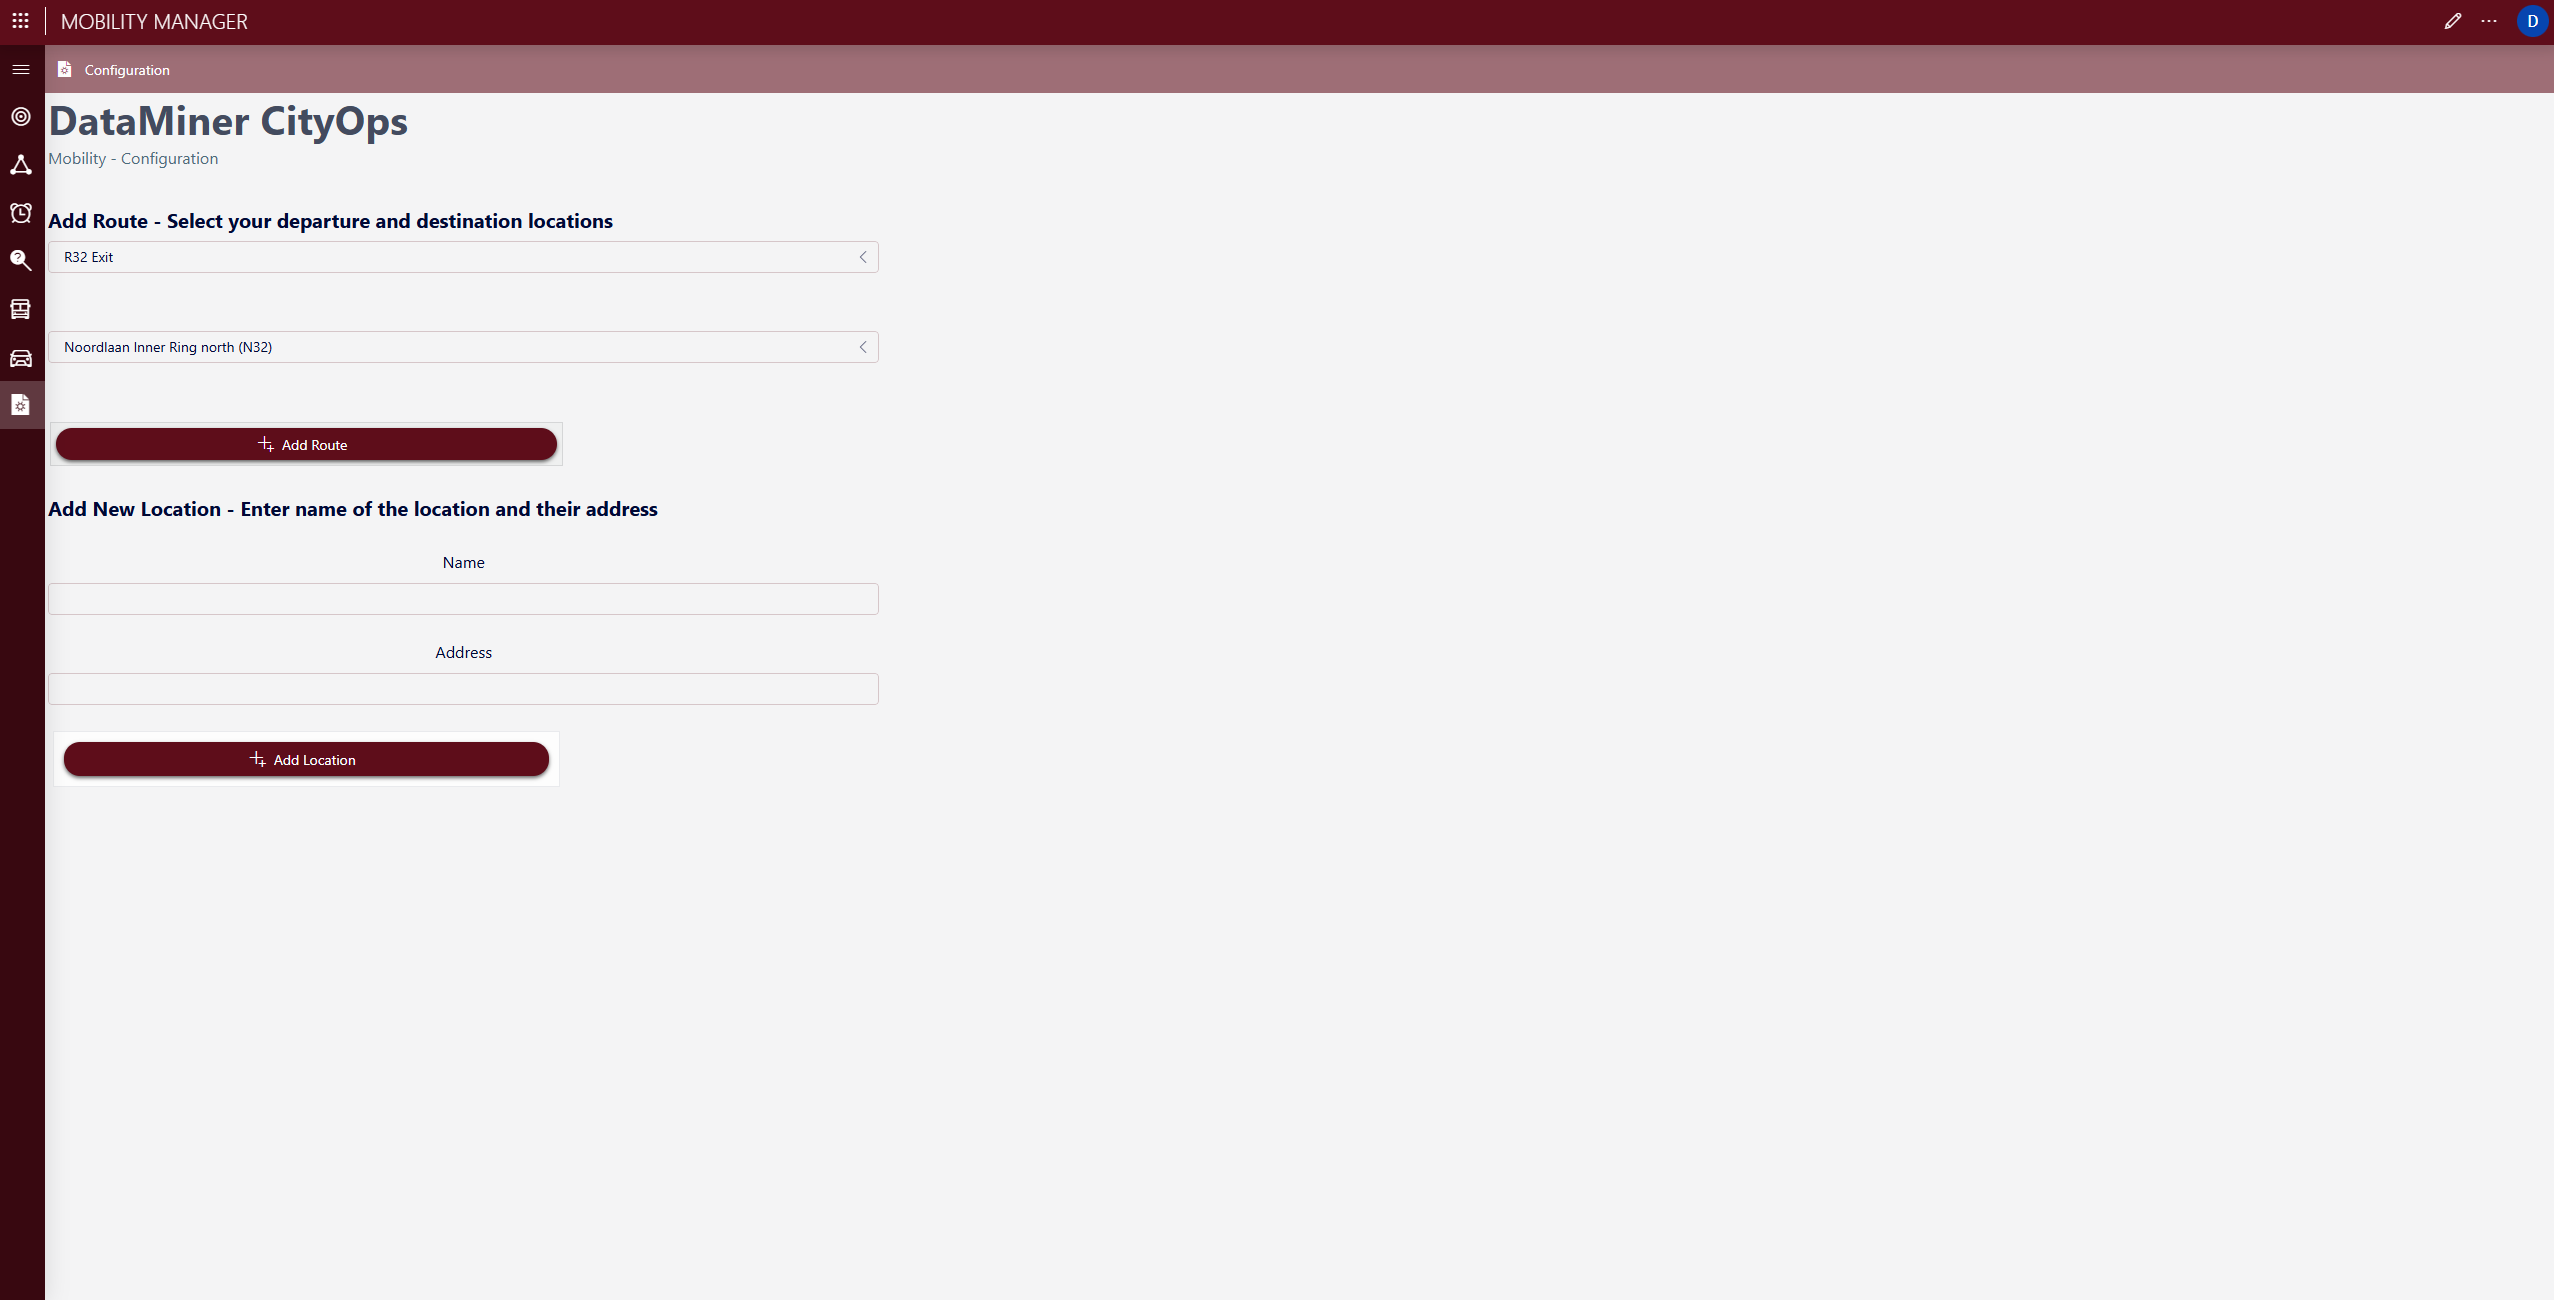 And finally, the Configuration page allows operators to easily define, modify, and expand monitored routes and locations. New points can be added to the system dynamically, ensuring scalability and continuous coverage as the city’s mobility network grows.