solution Use Case
DataMiner CityOps – City Command Center
The central intelligence hub for connected data-driven city operations
The DataMiner CityOps City Command Center is the core of a smart city’s operational environment, where all information, alerts, and activities come together in one unified workspace. It provides city operators with complete situational awareness through a live digital twin of the entire urban ecosystem, covering mobility, safety, energy, environment, and citizen services.
Every connected system continuously feeds data into the Command Center, where events are automatically correlated across domains. Incidents, alarms, maintenance tasks, and work orders are visualized in real time, creating a clear picture of what is happening across the city and how different elements interact.
Operators can monitor live status, track performance, and take immediate action from a single screen. With advanced dashboards, automated workflows, and cross-domain intelligence, the City Command Center enables coordinated decision-making, fast emergency response, and seamless communication with citizens and city services.
It is the place where complex data becomes operational intelligence, ensuring cities remain efficient, safe, and responsive at every moment.
USE CASE DETAILS
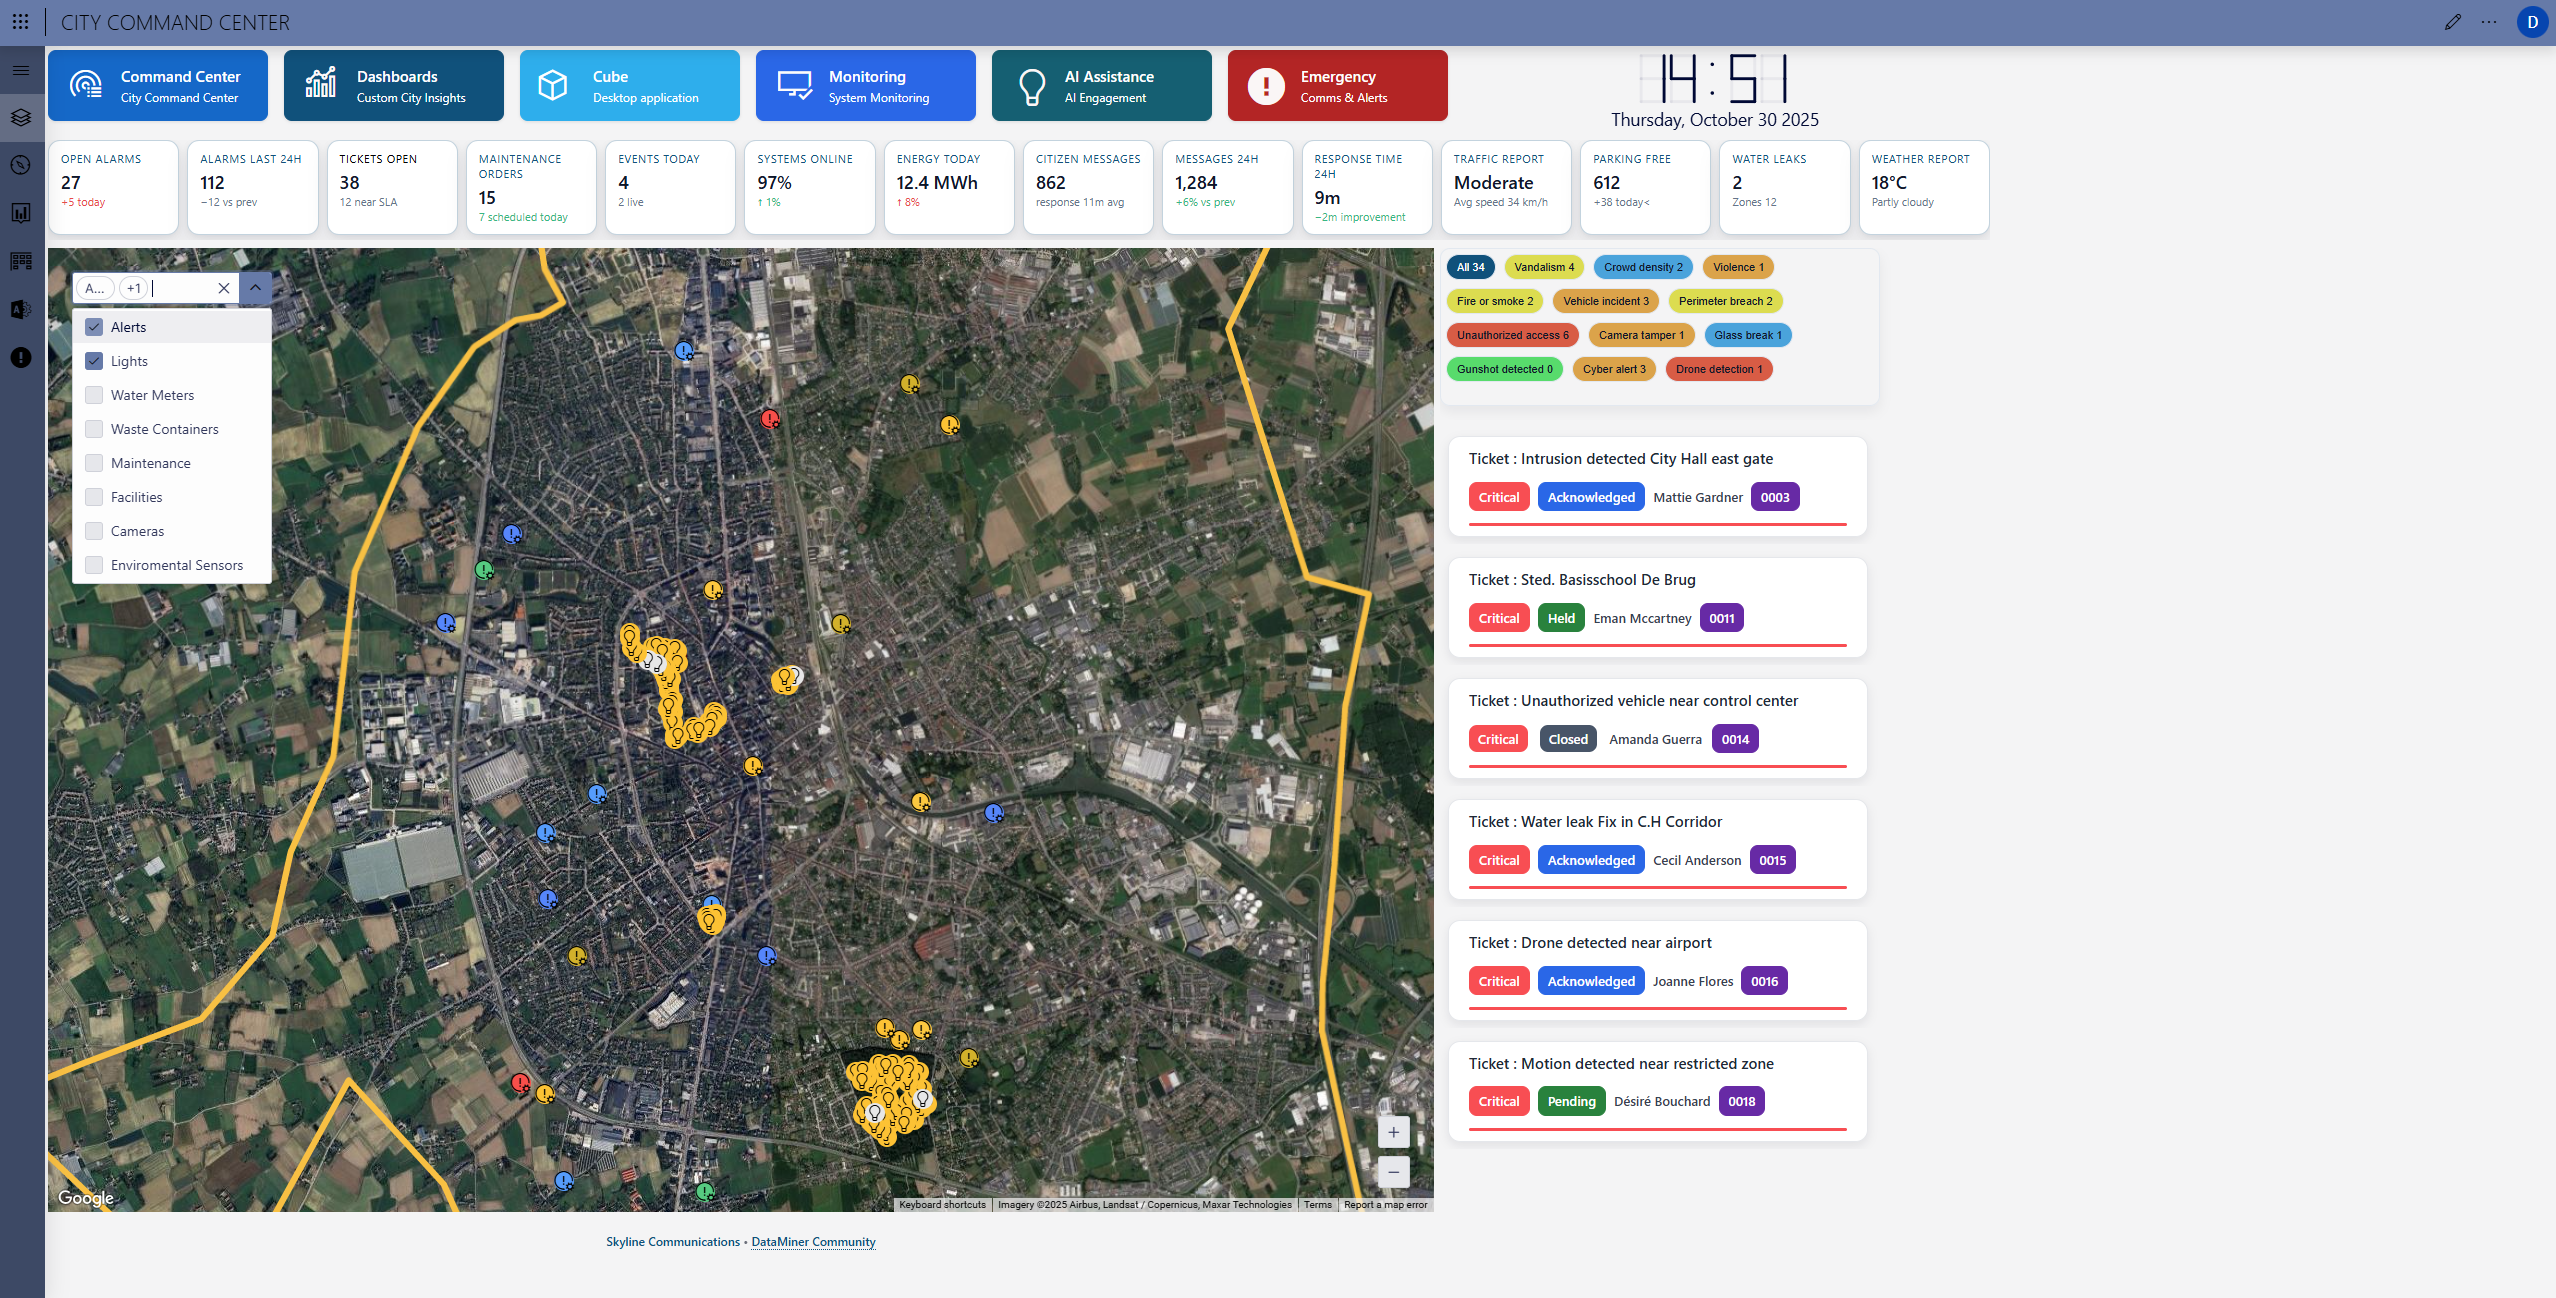
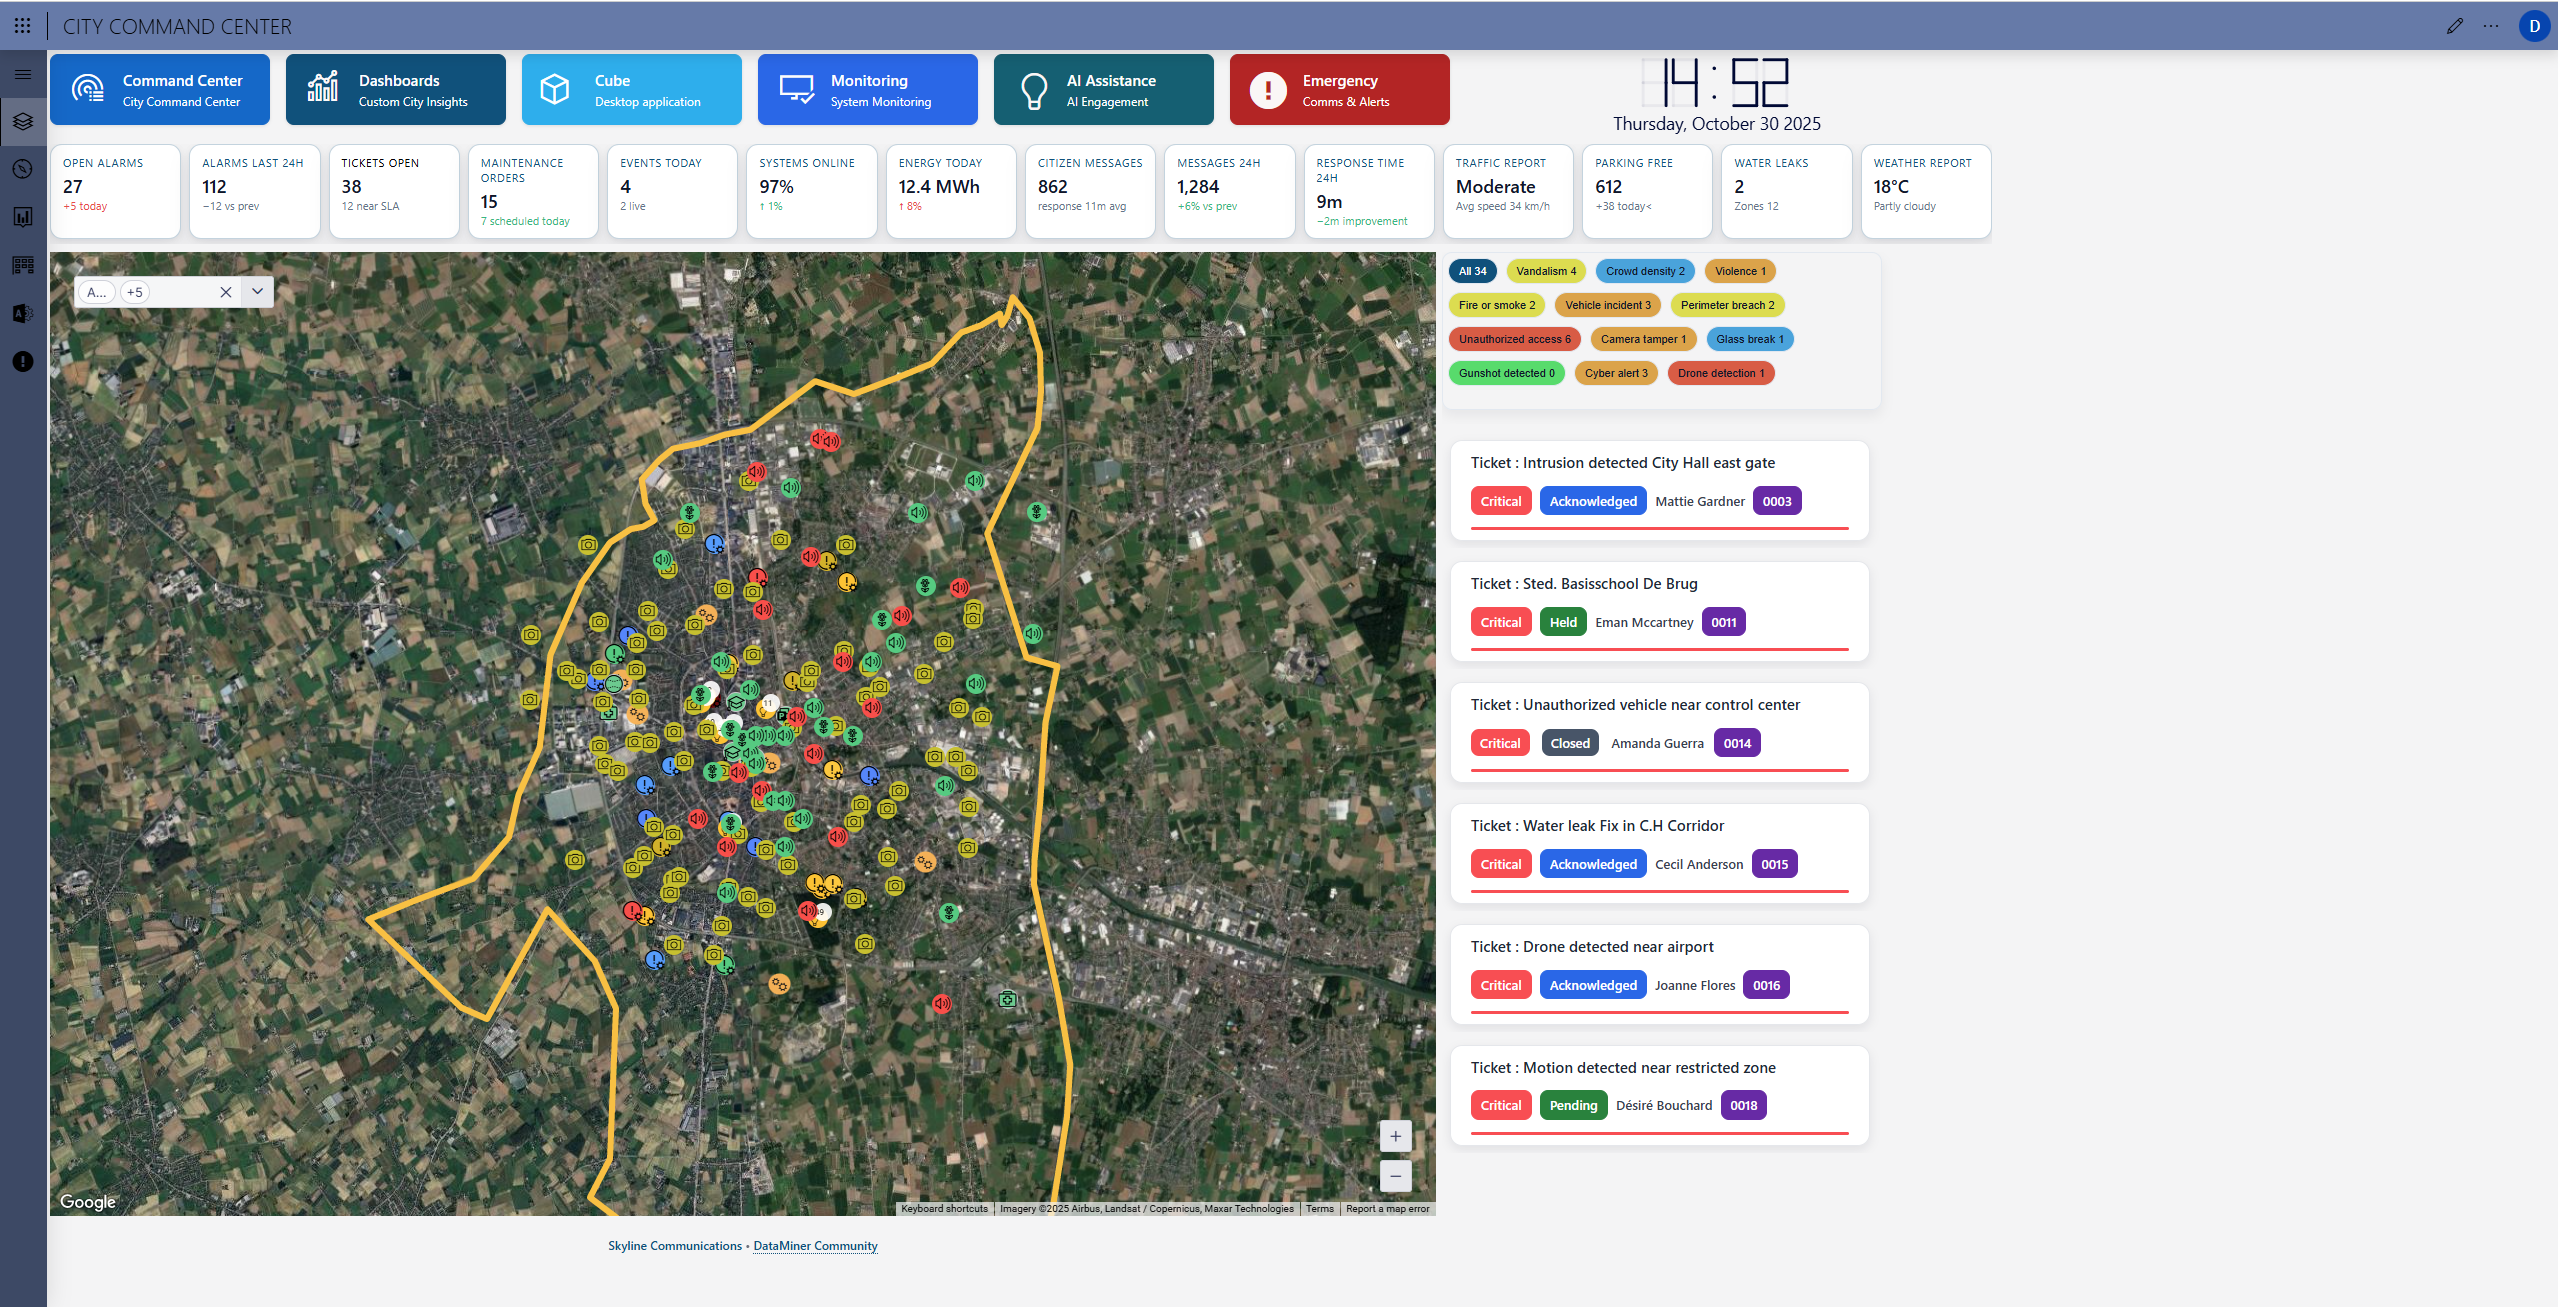
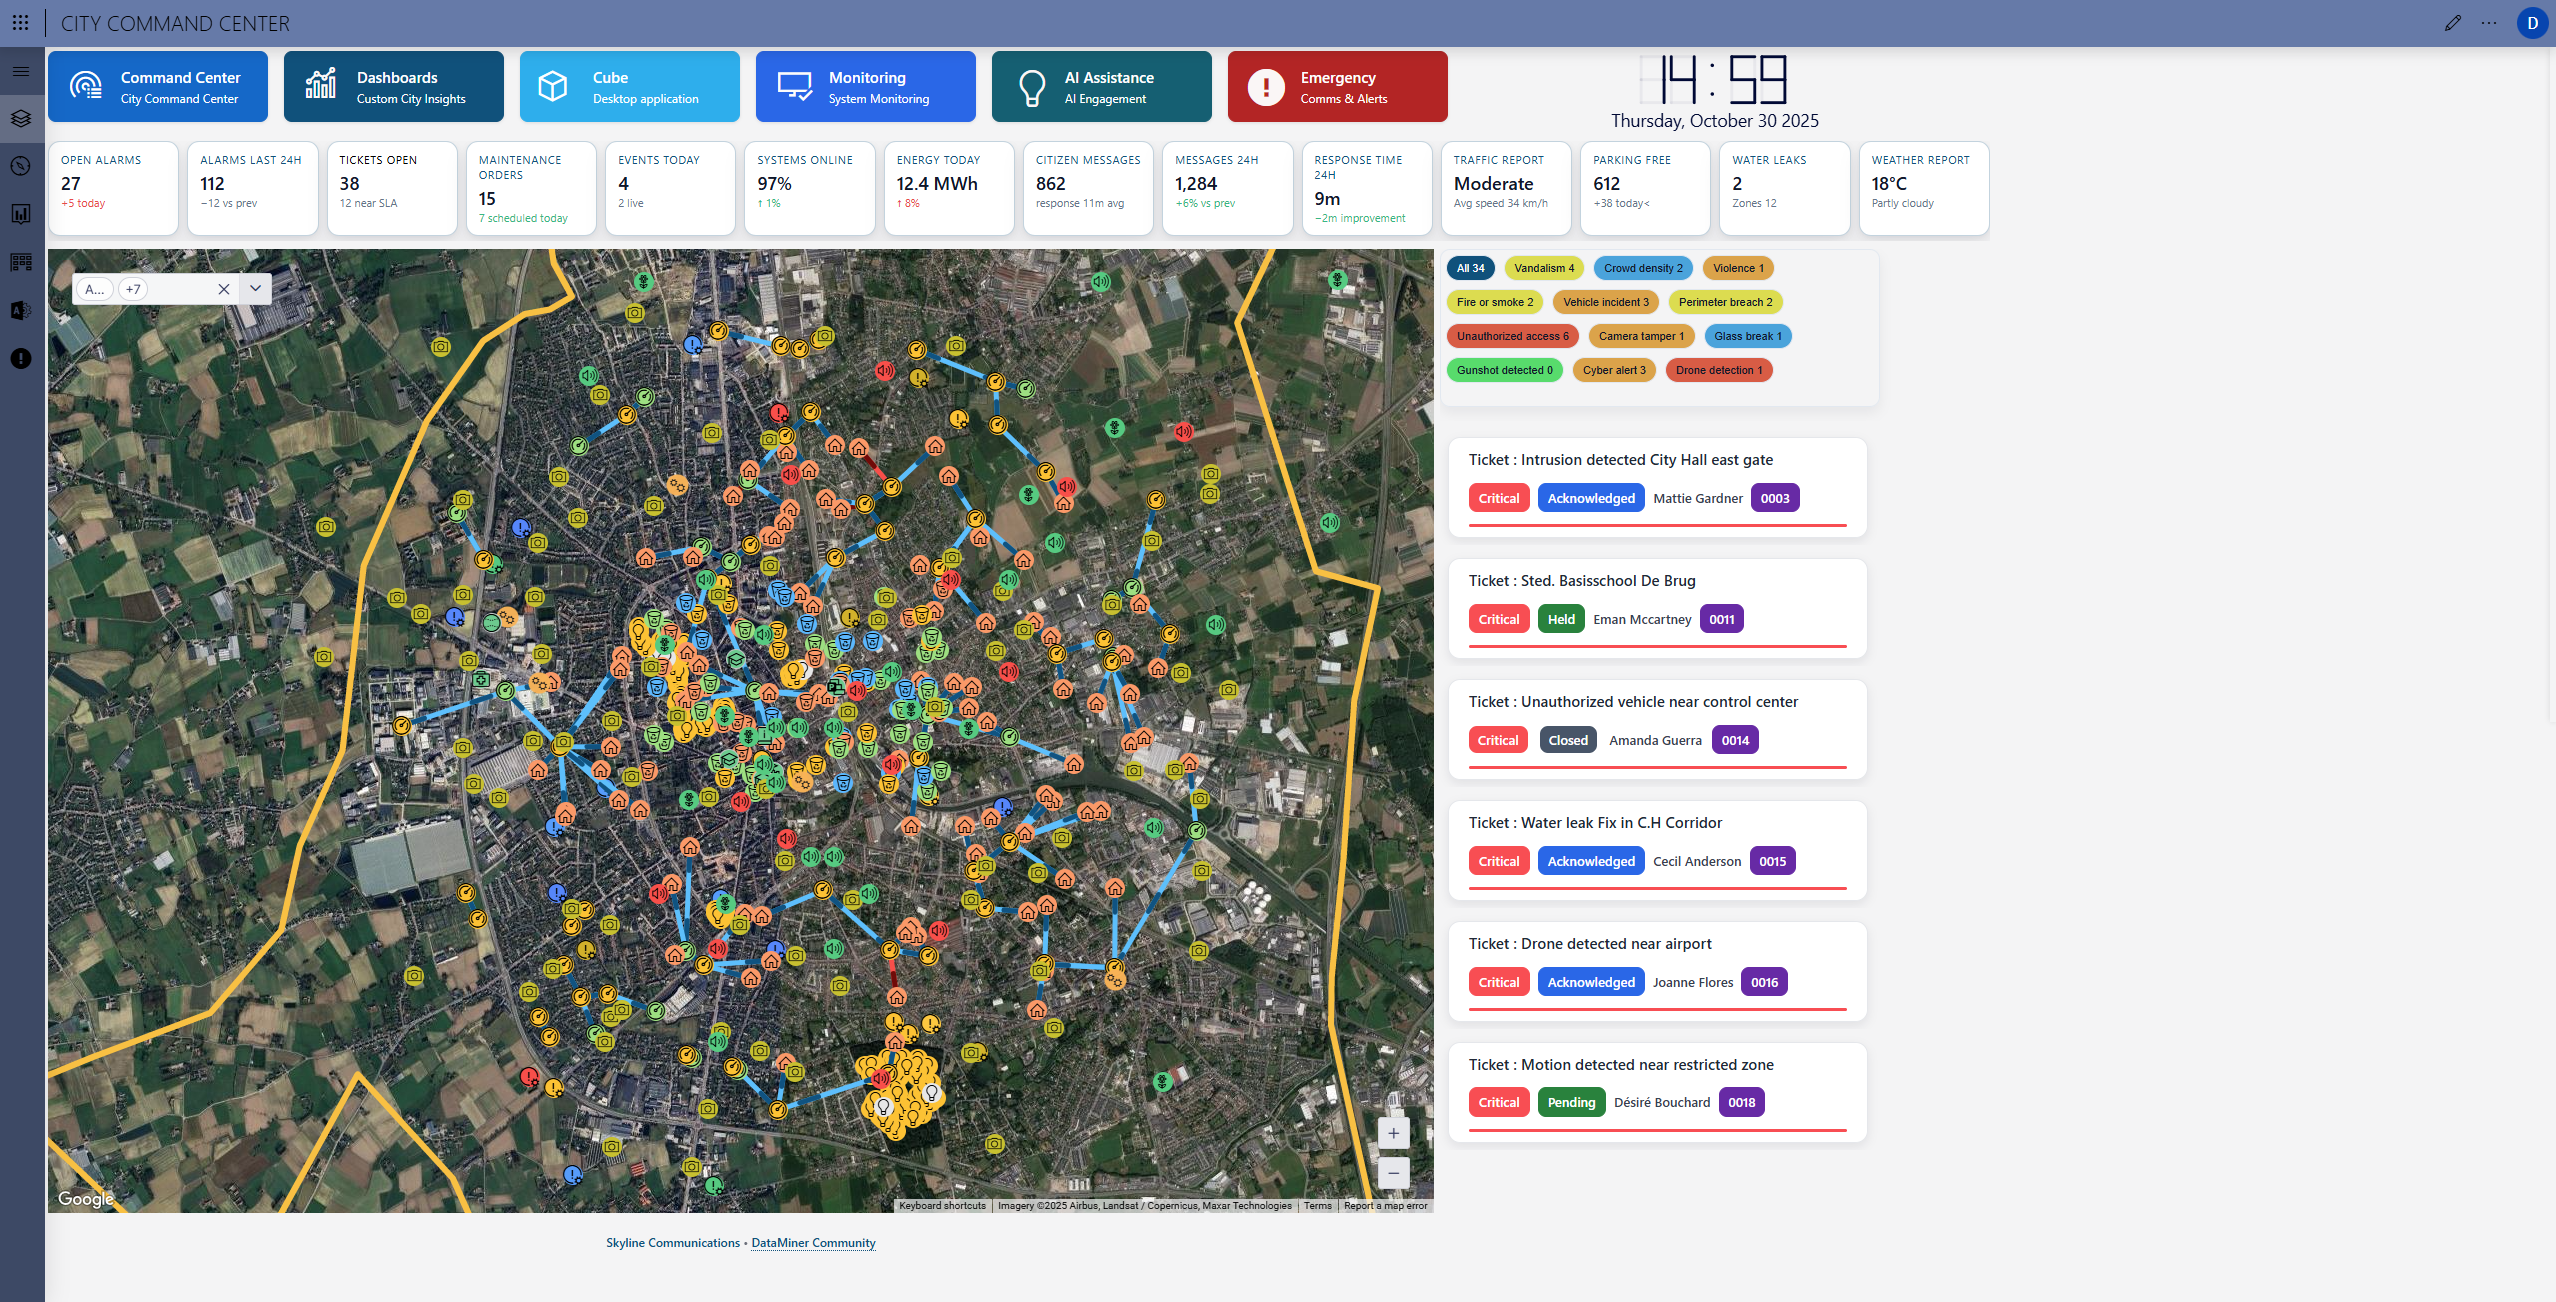 The Command Center map is the central visualization layer of the DataMiner CityOps Command Center, displaying all live city operations within a single, interactive view. Every sensor, system, and connected service is represented in real time, offering city operators a complete operational overview across all domains , from mobility and energy to safety, water, and waste.
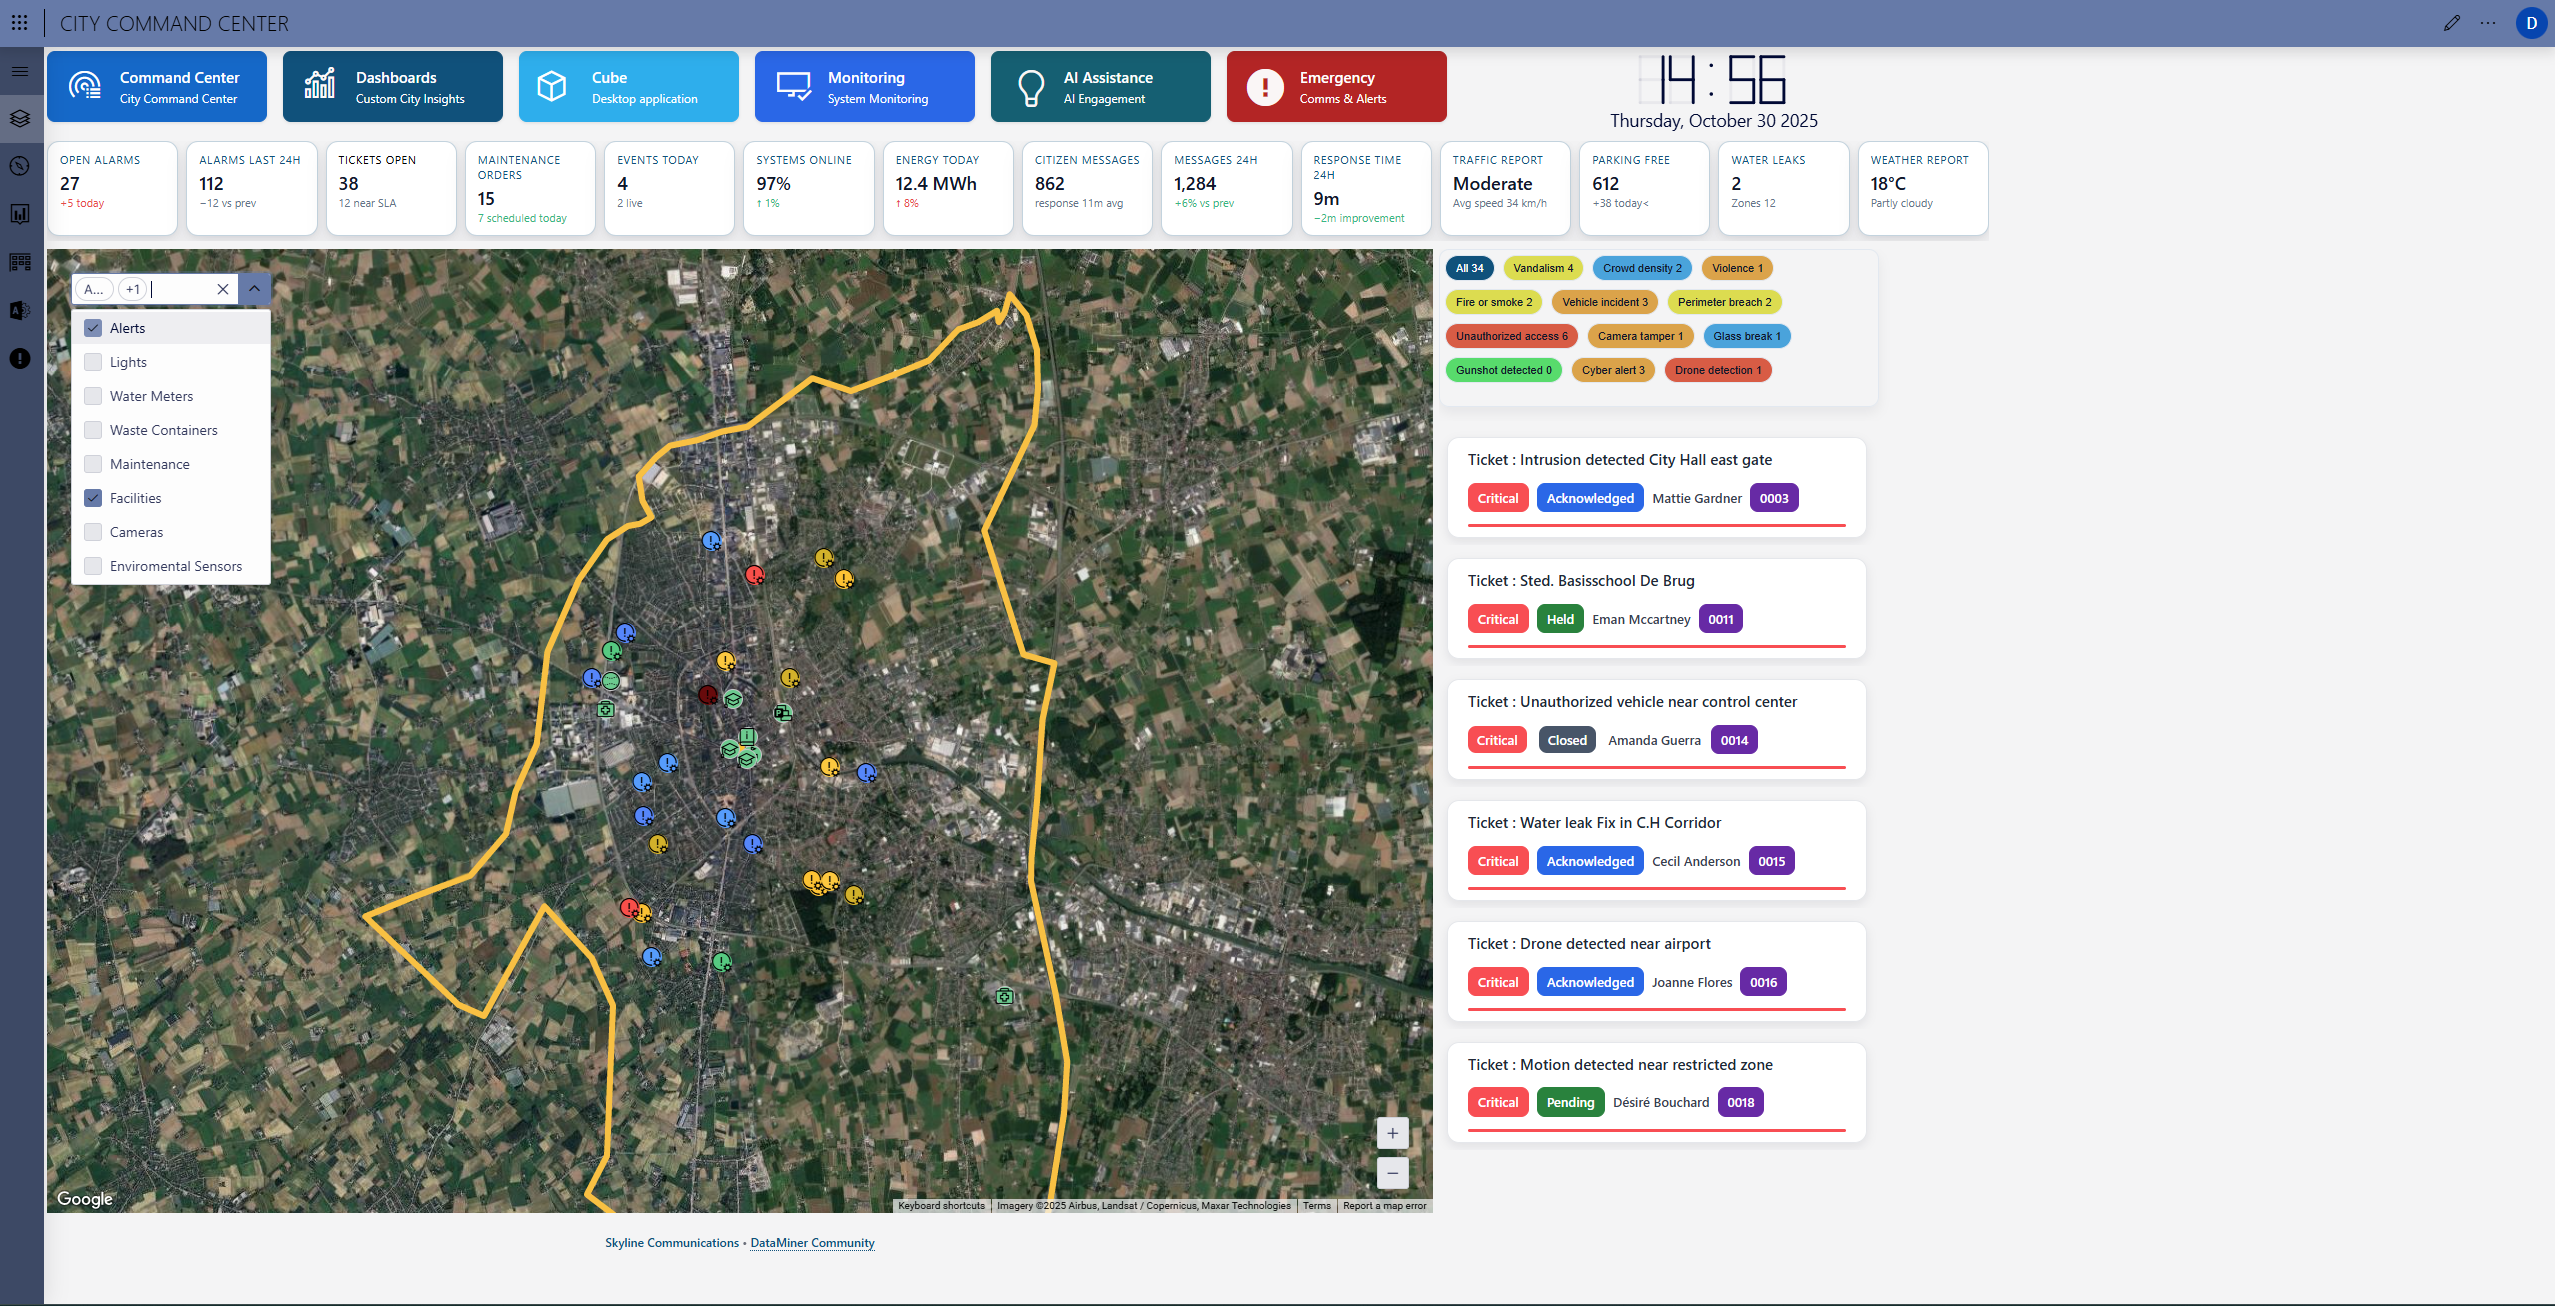
 Each operational layer can be filtered or combined dynamically. Operators can visualize the entire ecosystem or focus on specific infrastructure such as lights, meters, waste containers, facilities, environmental sensors, or security cameras. DataMiner correlates all information across these domains, ensuring that every point on the map is not just a location but a live data source contributing to the city’s unified digital twin.
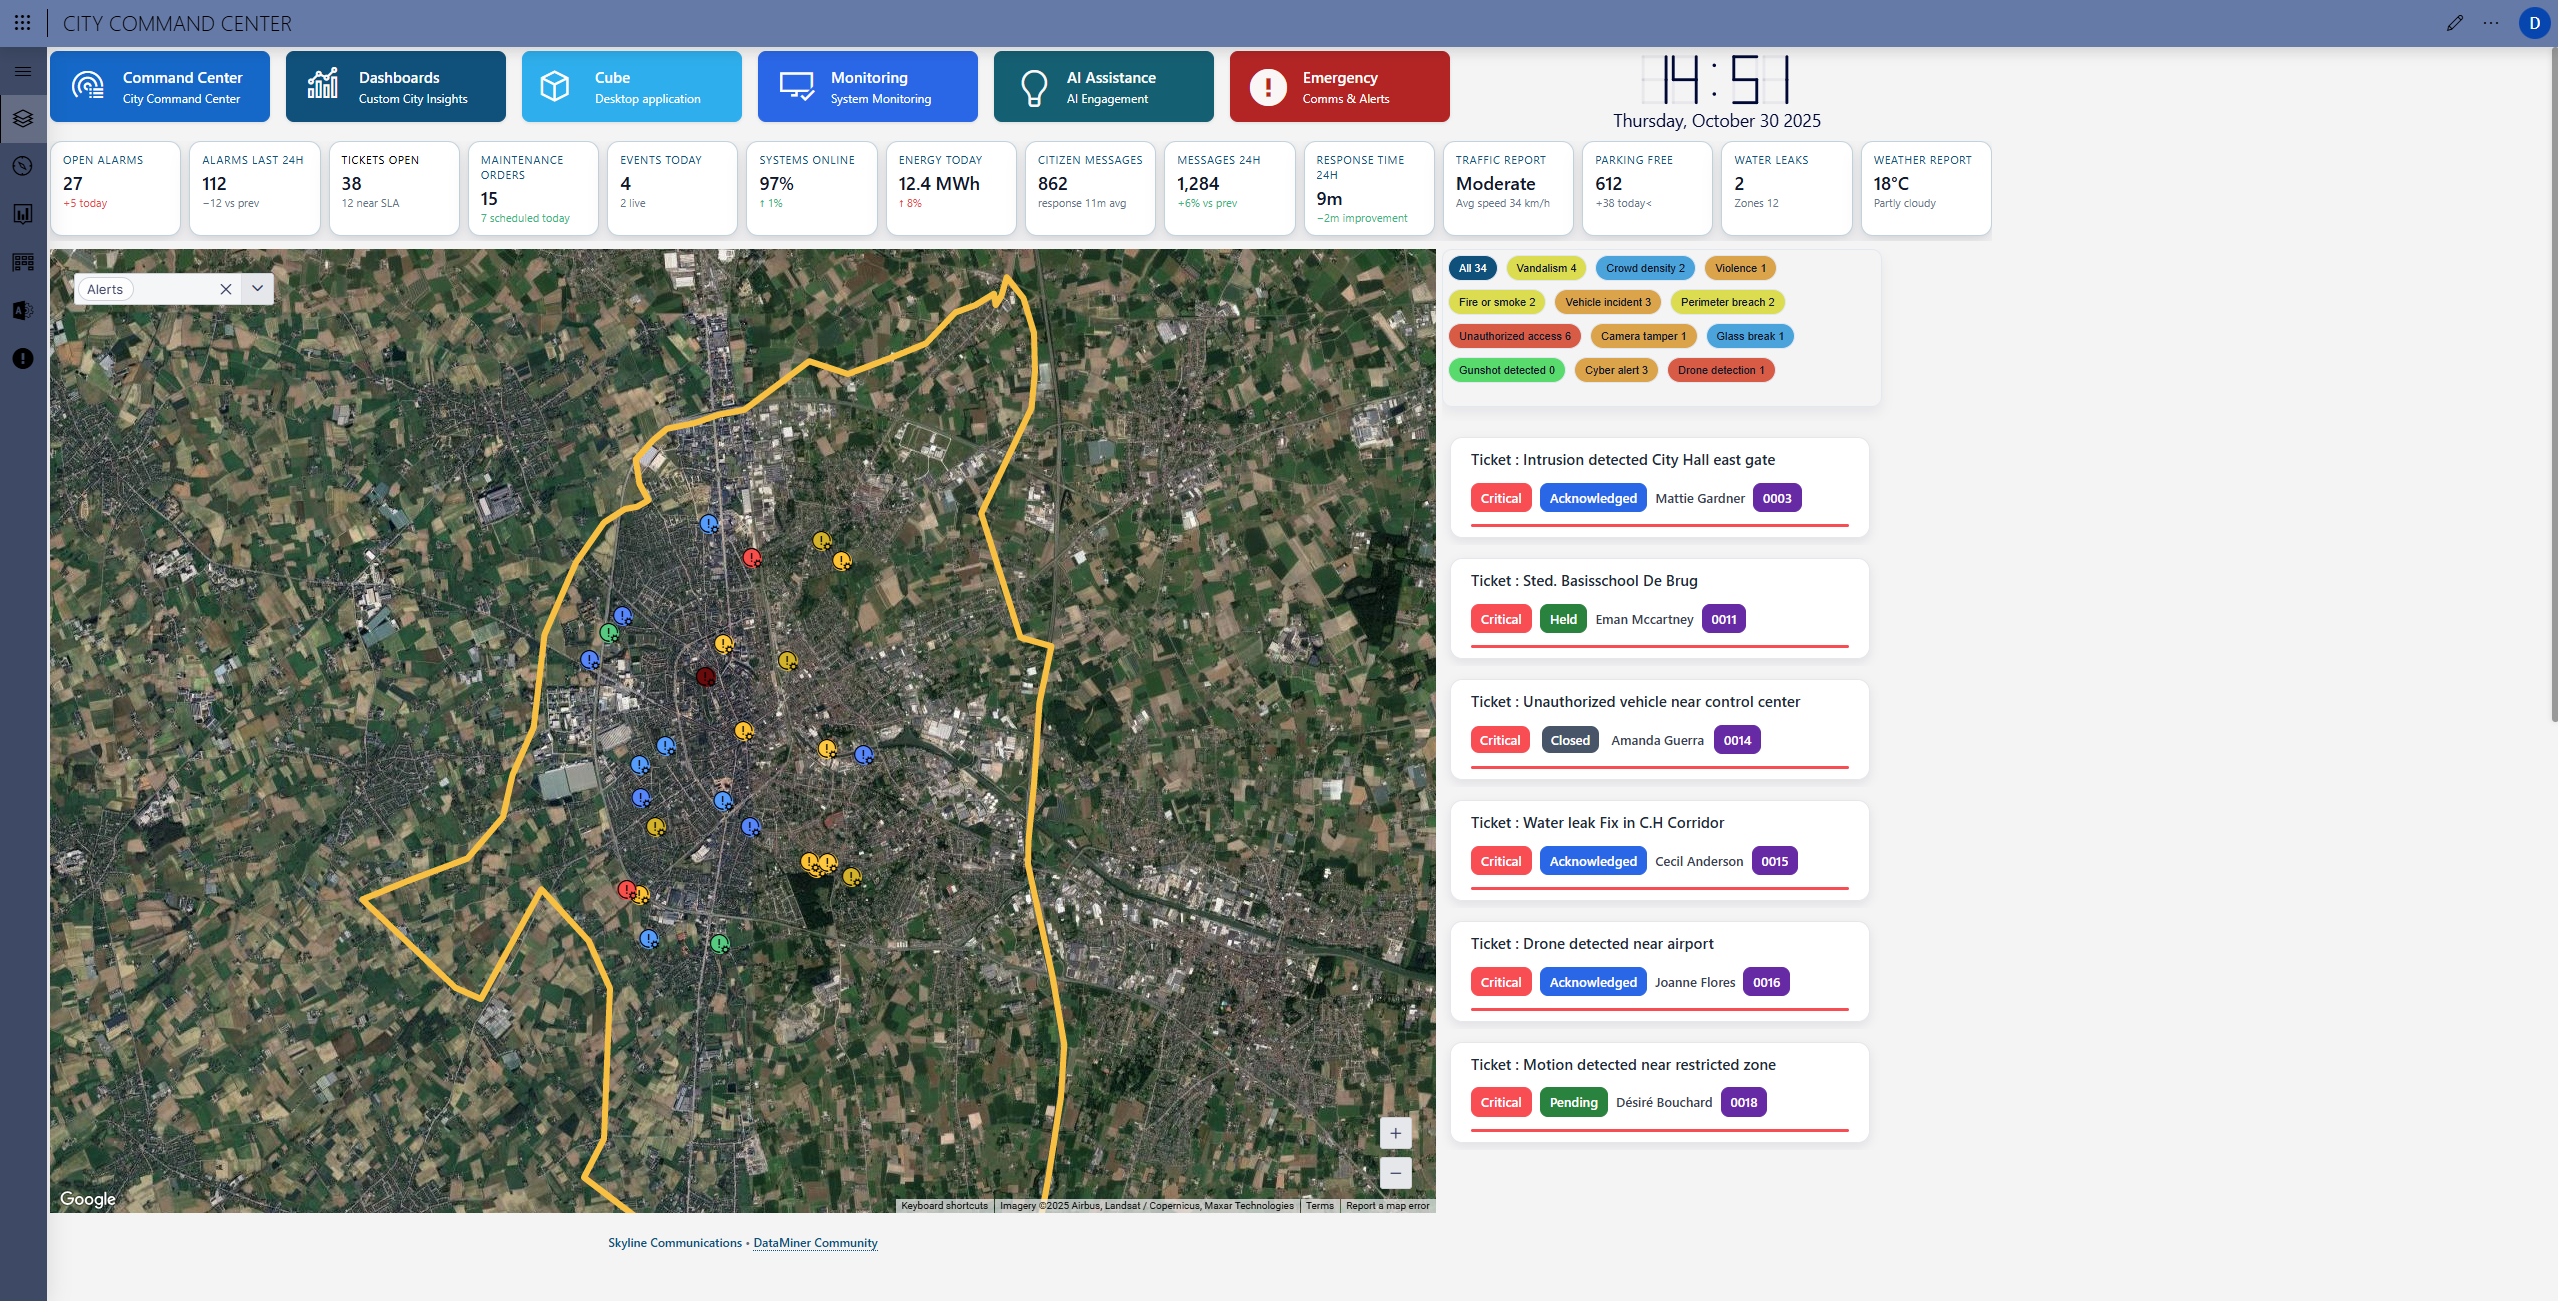
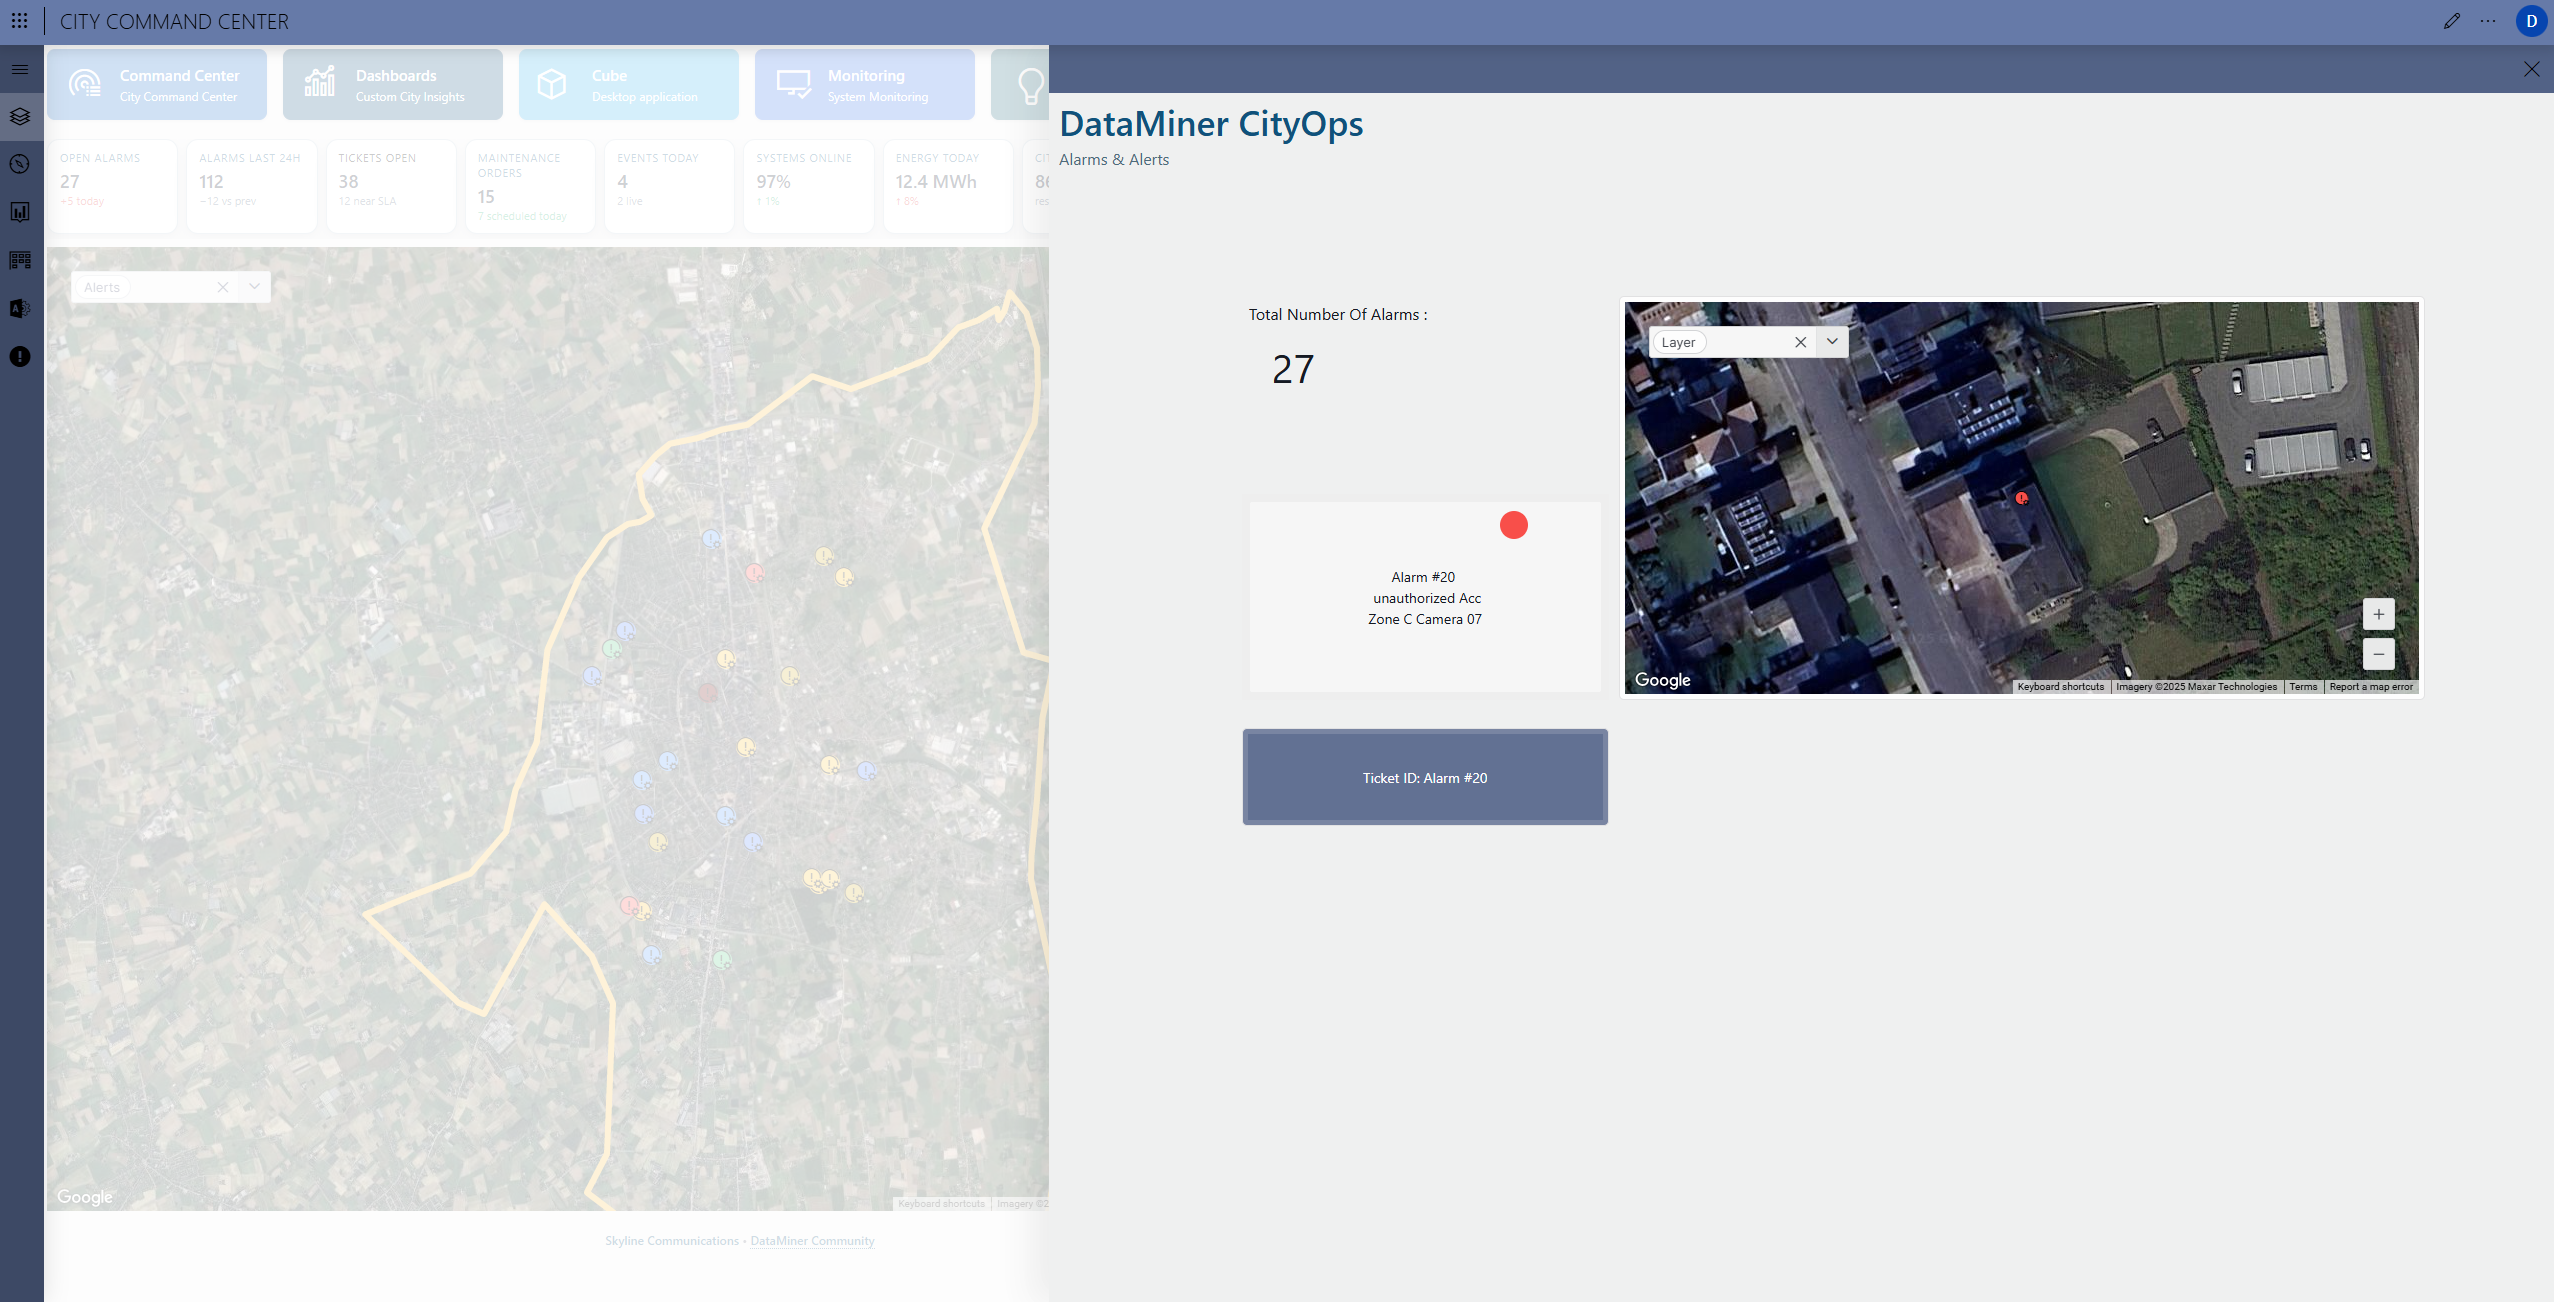 Active alarms and critical events are visualized directly on the map, allowing operators to instantly see where incidents are occurring. Alarm icons appear in real time, color-coded by severity, and automatically correlated with related assets, maintenance tickets, or nearby systems. Clicking an alarm opens its details, historical context, and any linked work orders or incidents, ensuring rapid understanding and response. This live alarm visualization provides clear geographic context, helping teams prioritize and act faster.
 When lights are selected, the map shows the live status and location of all smart streetlights. Operators can quickly identify malfunctioning units, trigger maintenance tickets, or analyze power consumption across districts.
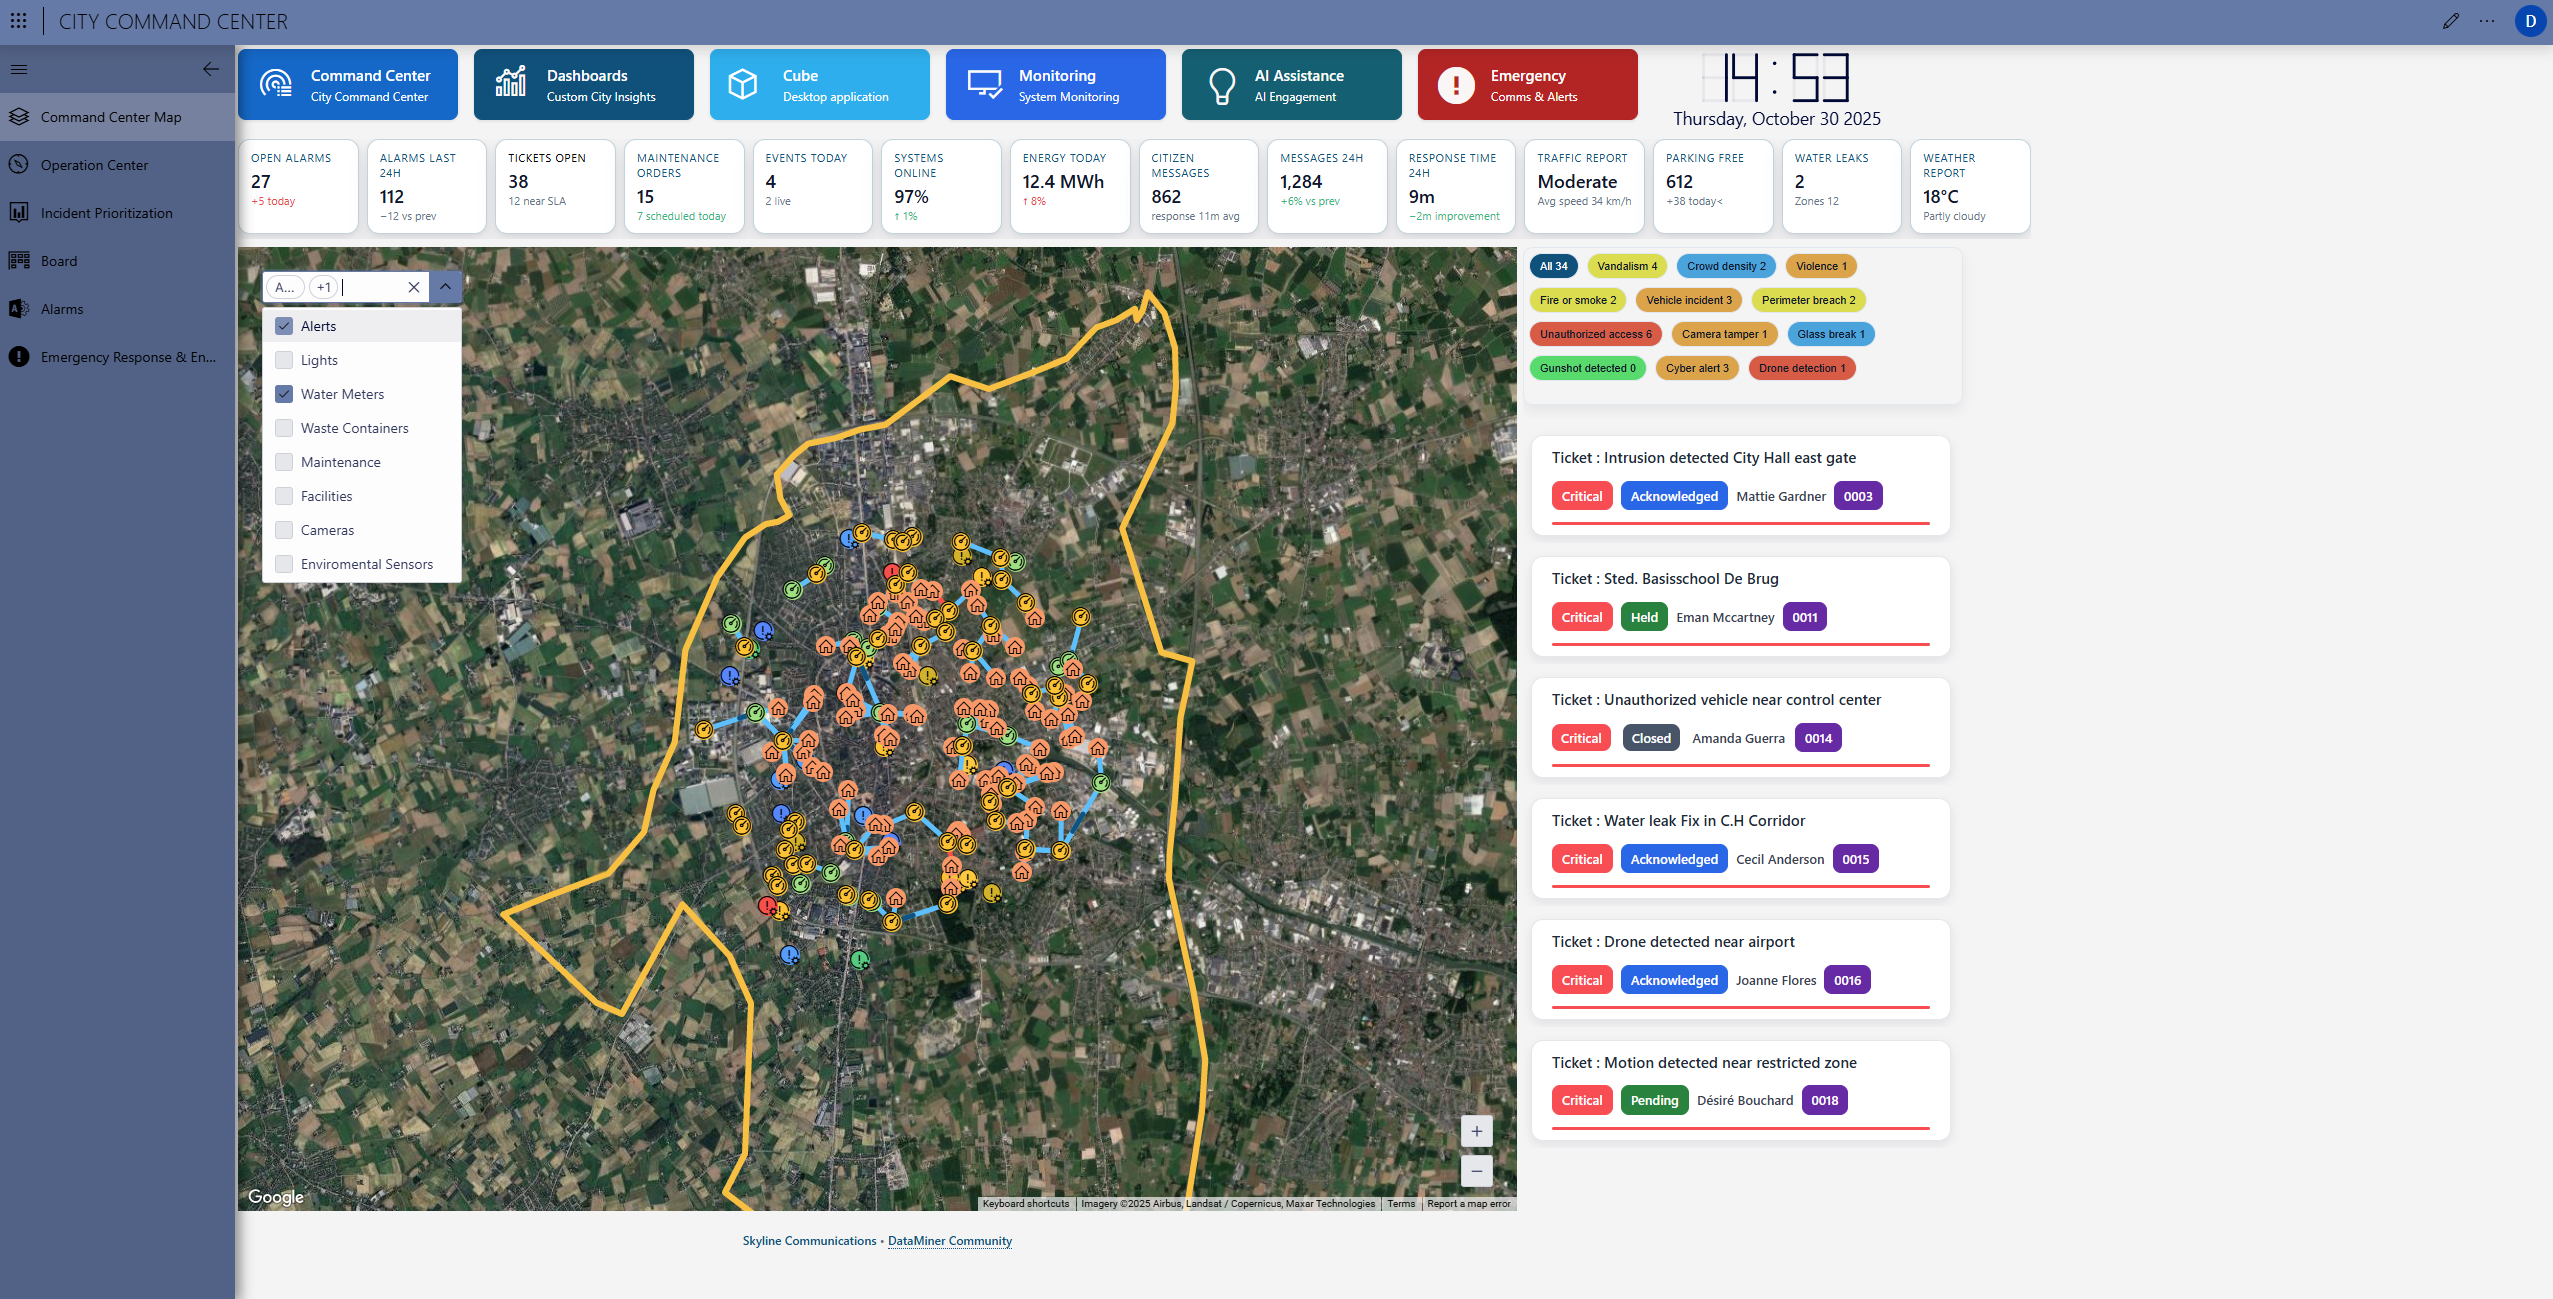 The water meter layer displays distribution networks and individual metering points, highlighting active readings, flow rates, and potential anomalies.
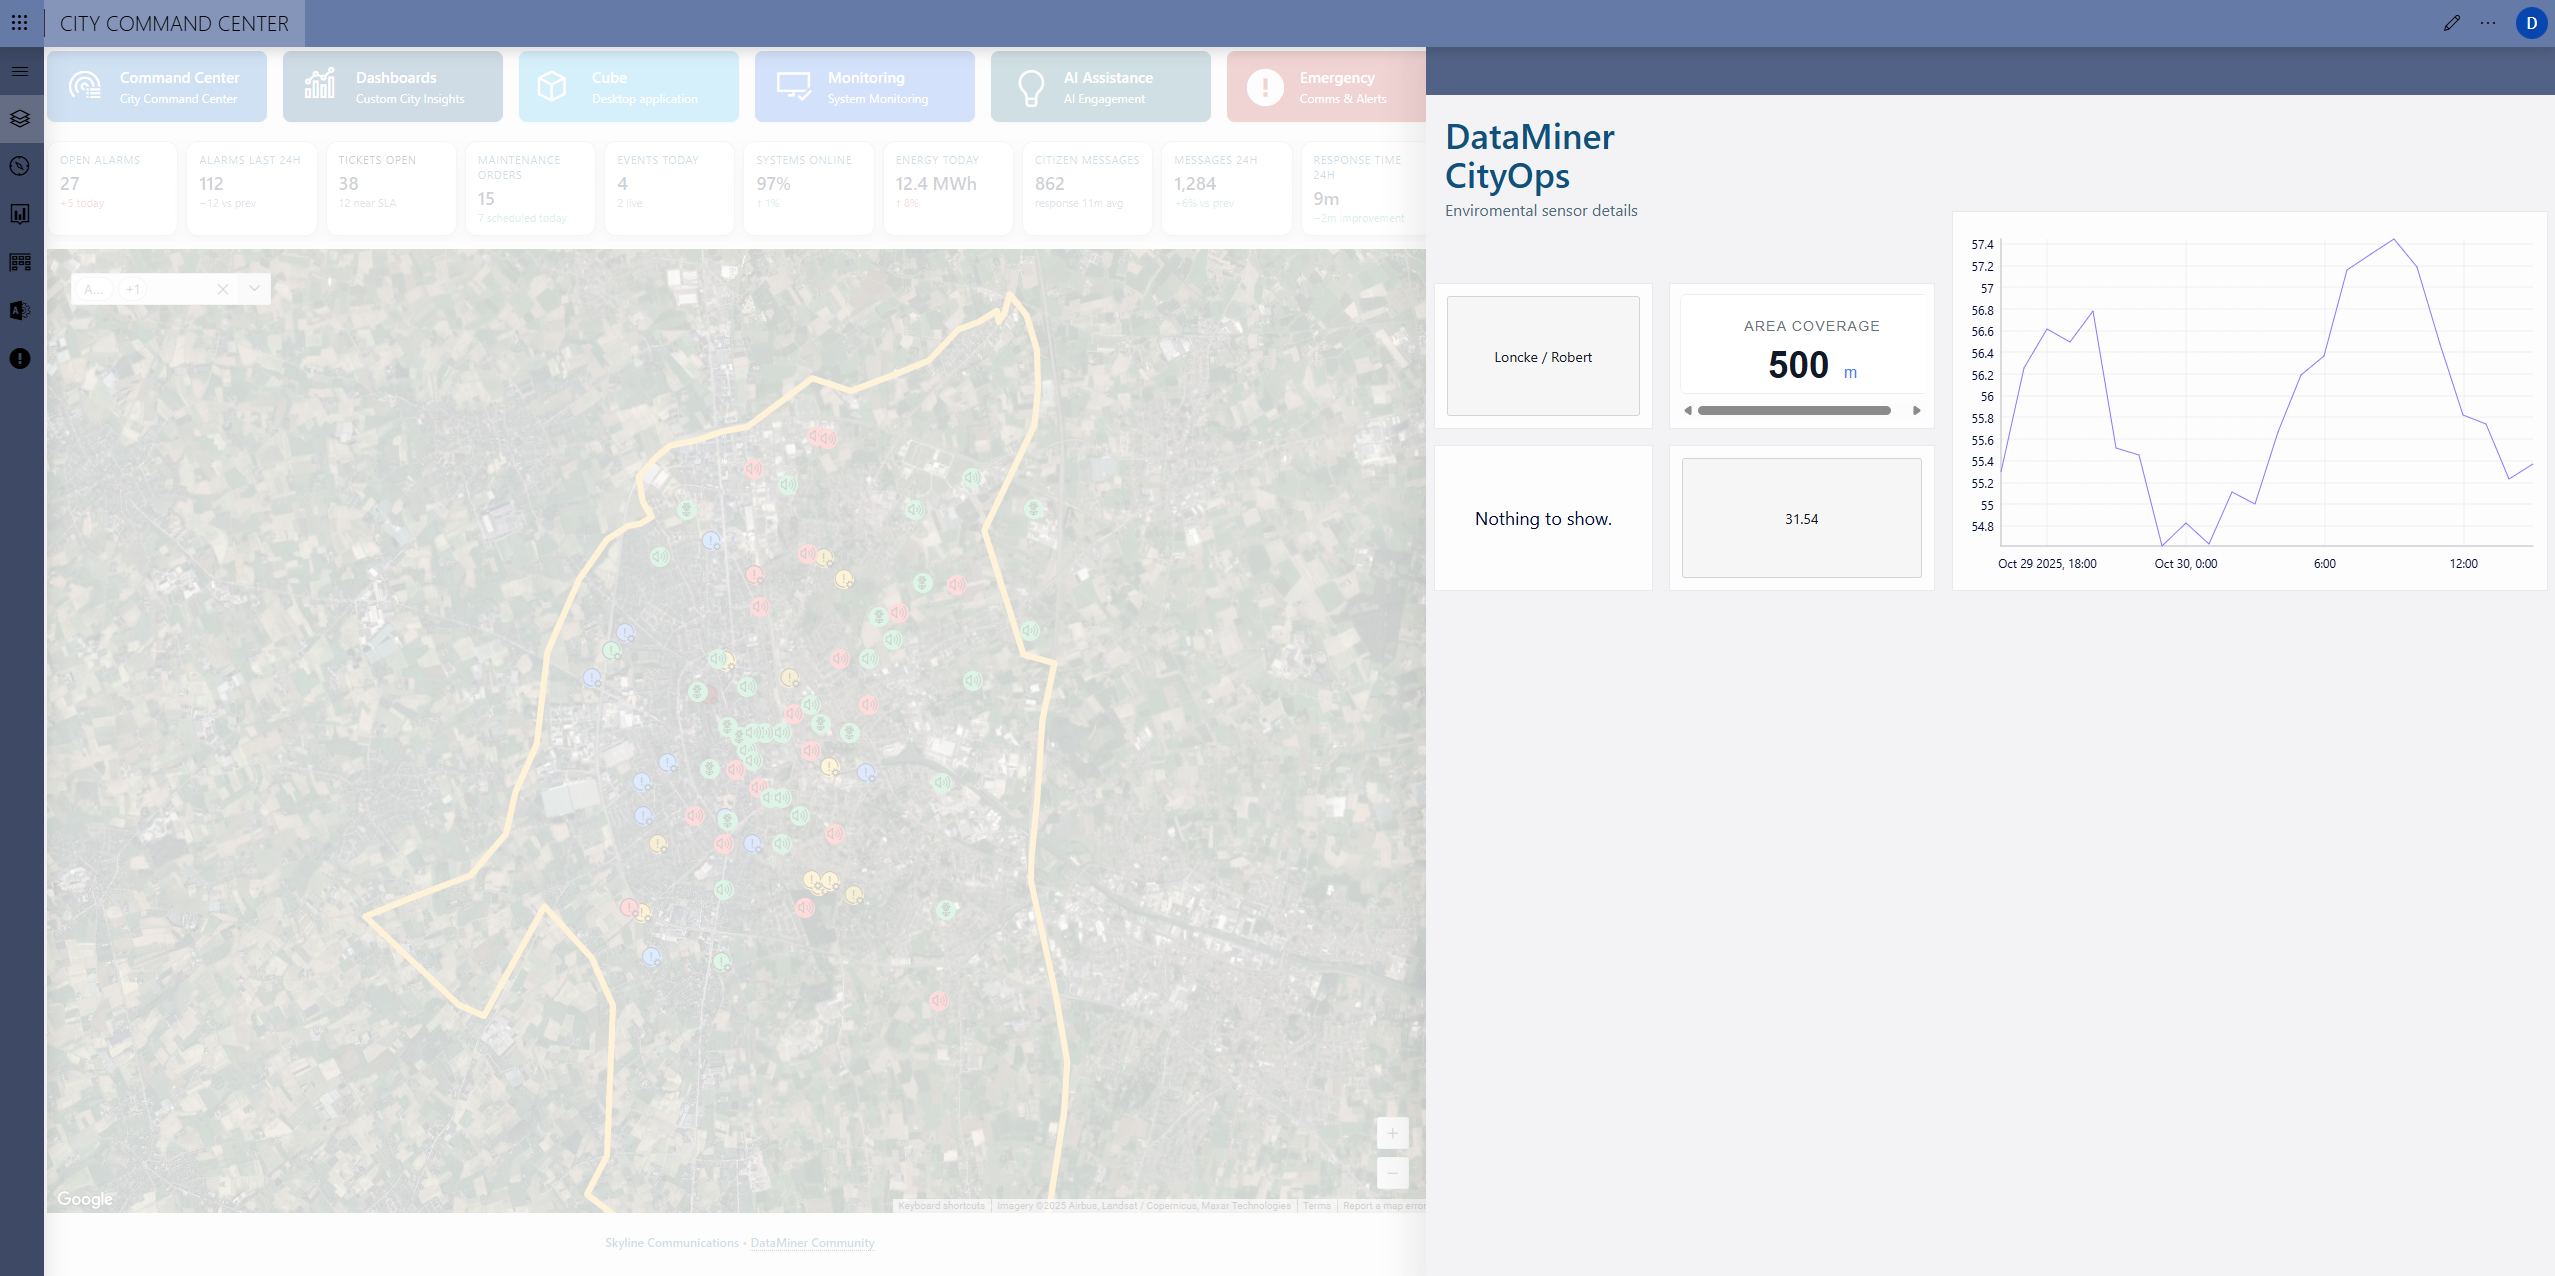
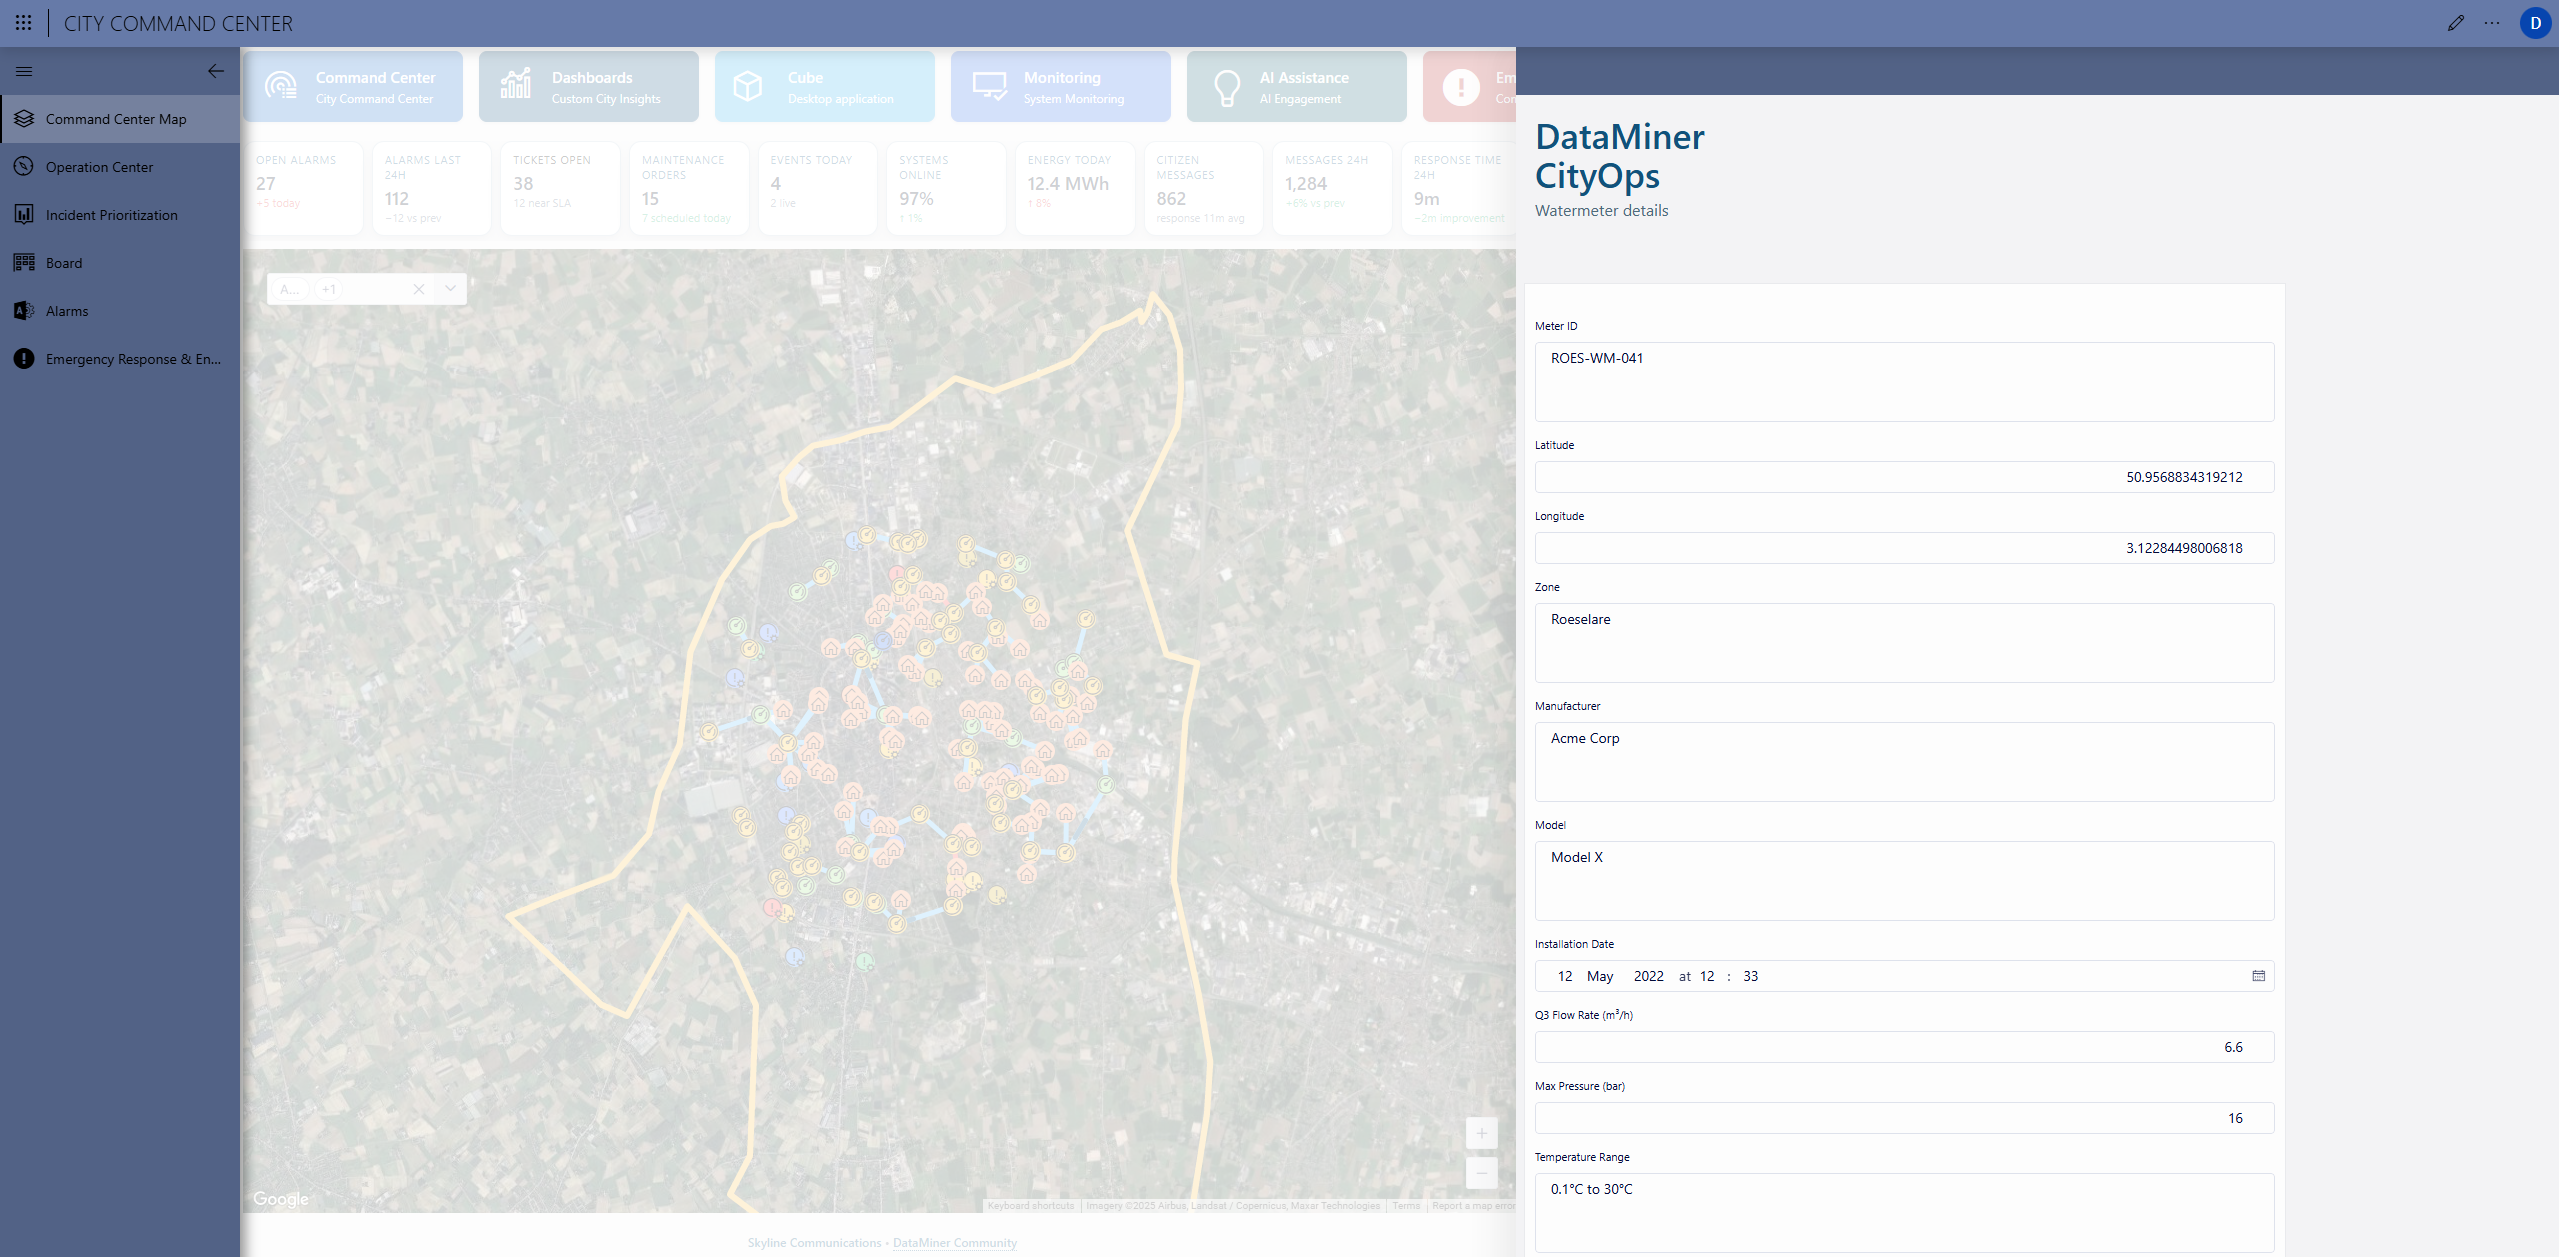 Operators can drill down into each device to see model details, installation data, and performance metrics.
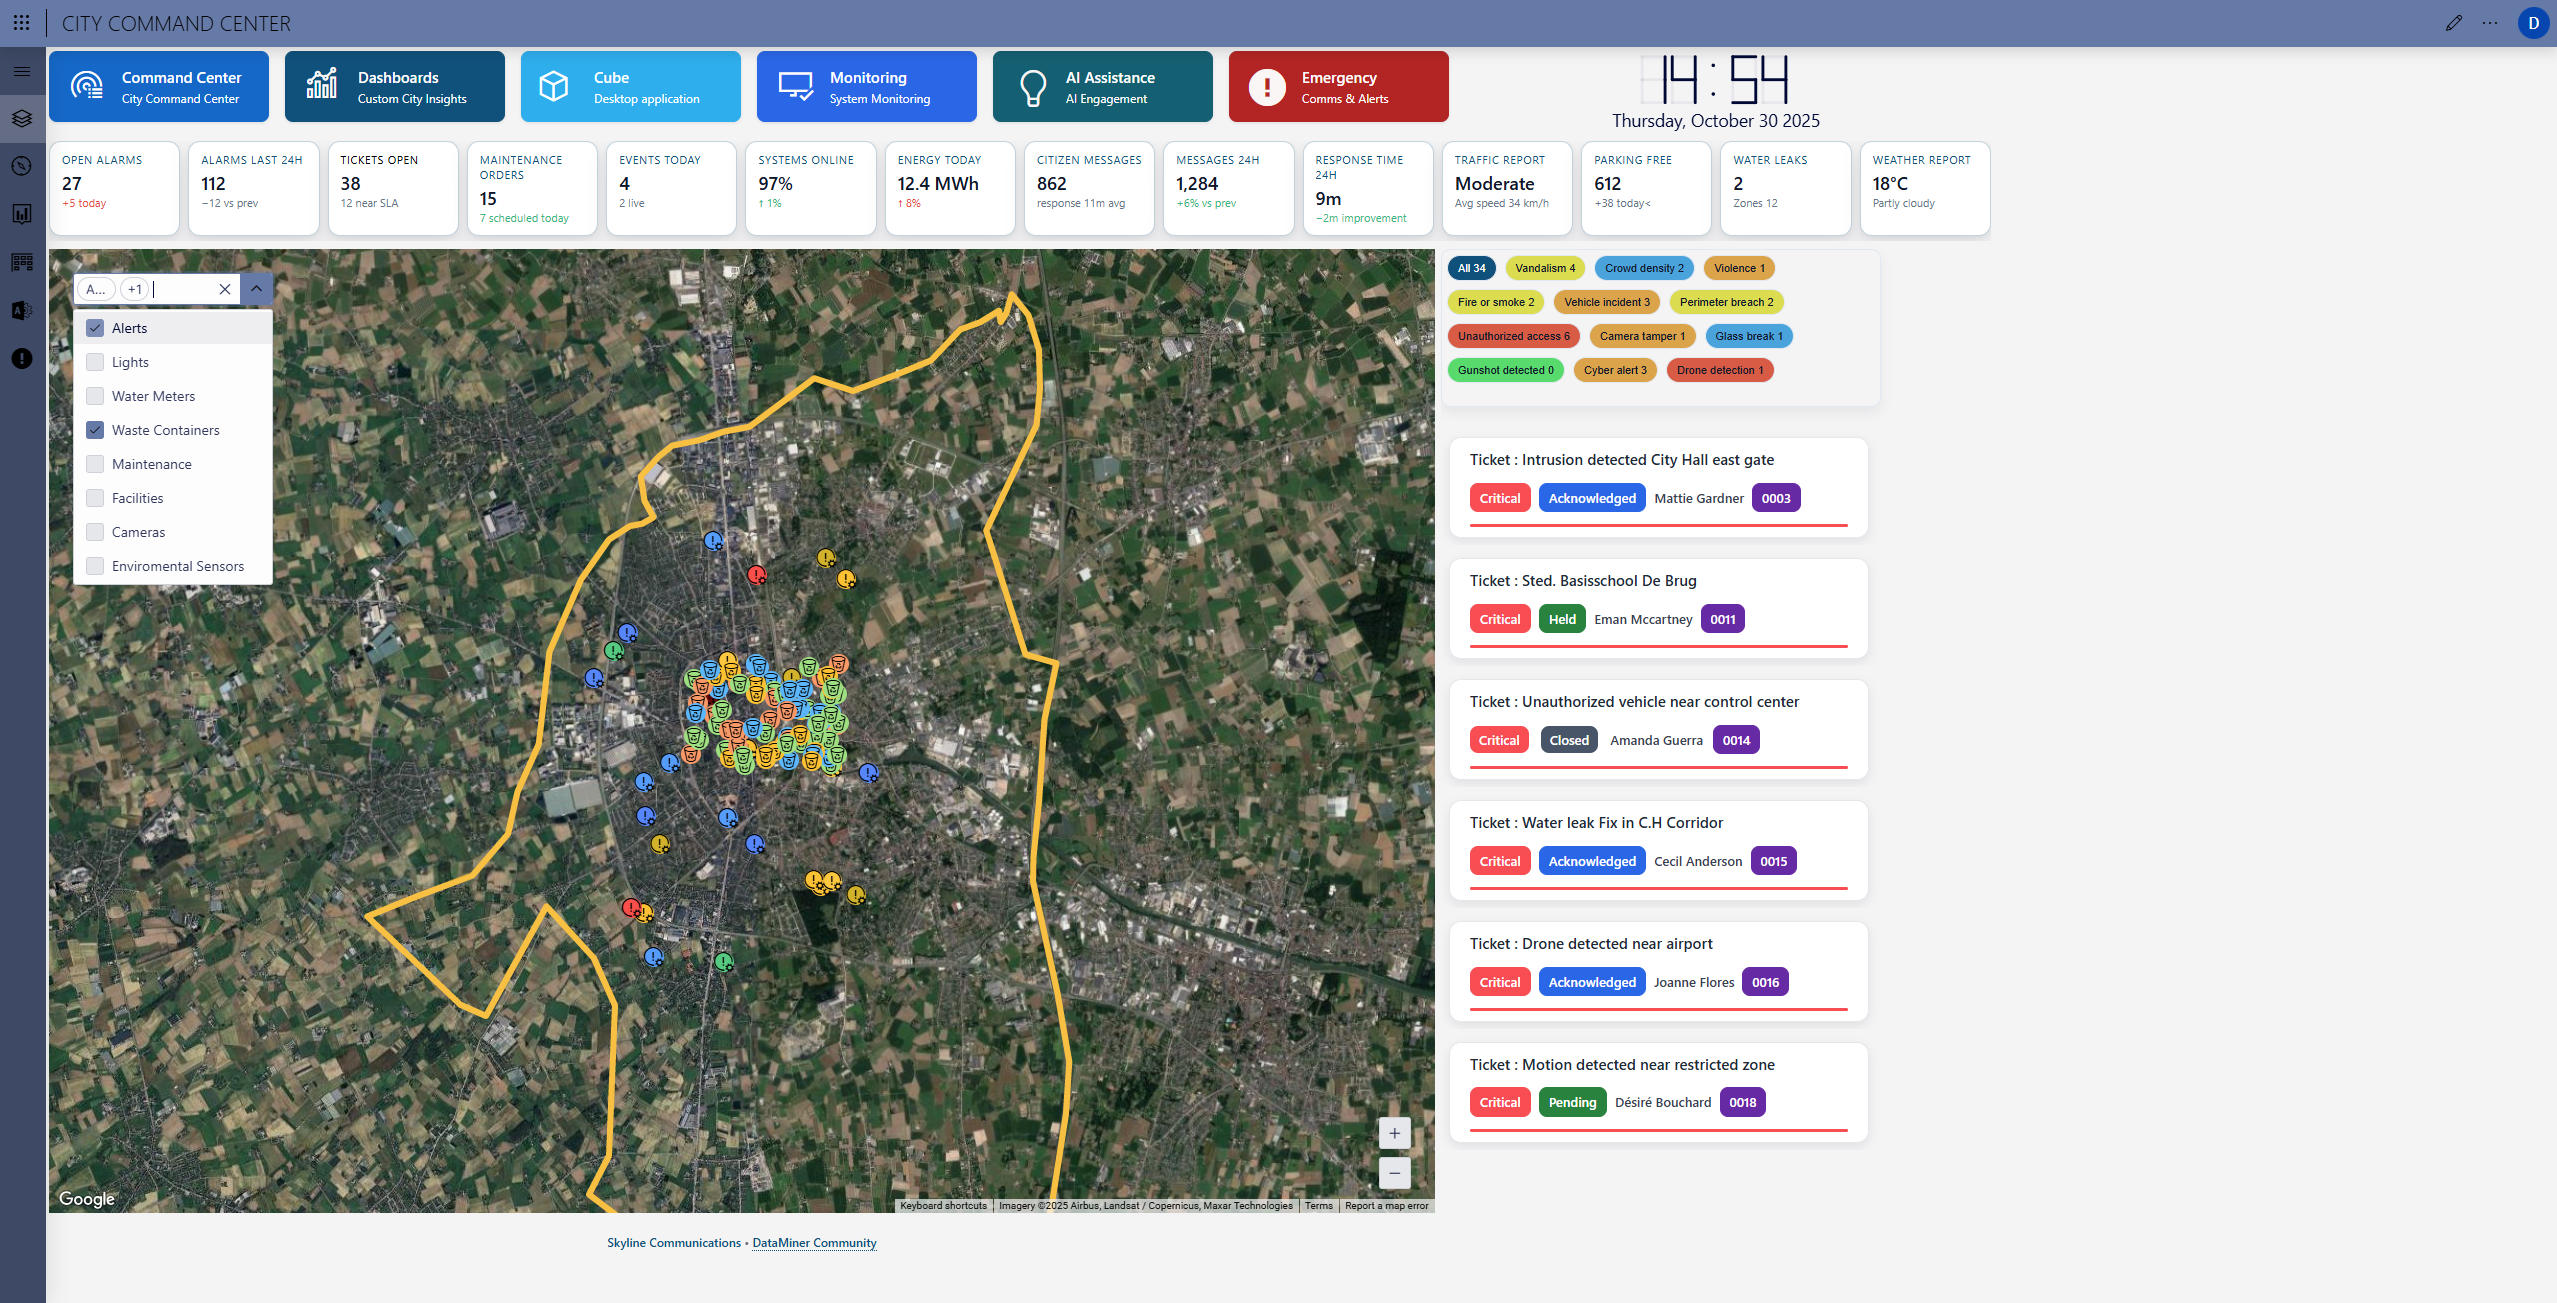 Waste management visualization provides a complete overview of bin locations, fill levels, and collection zones.
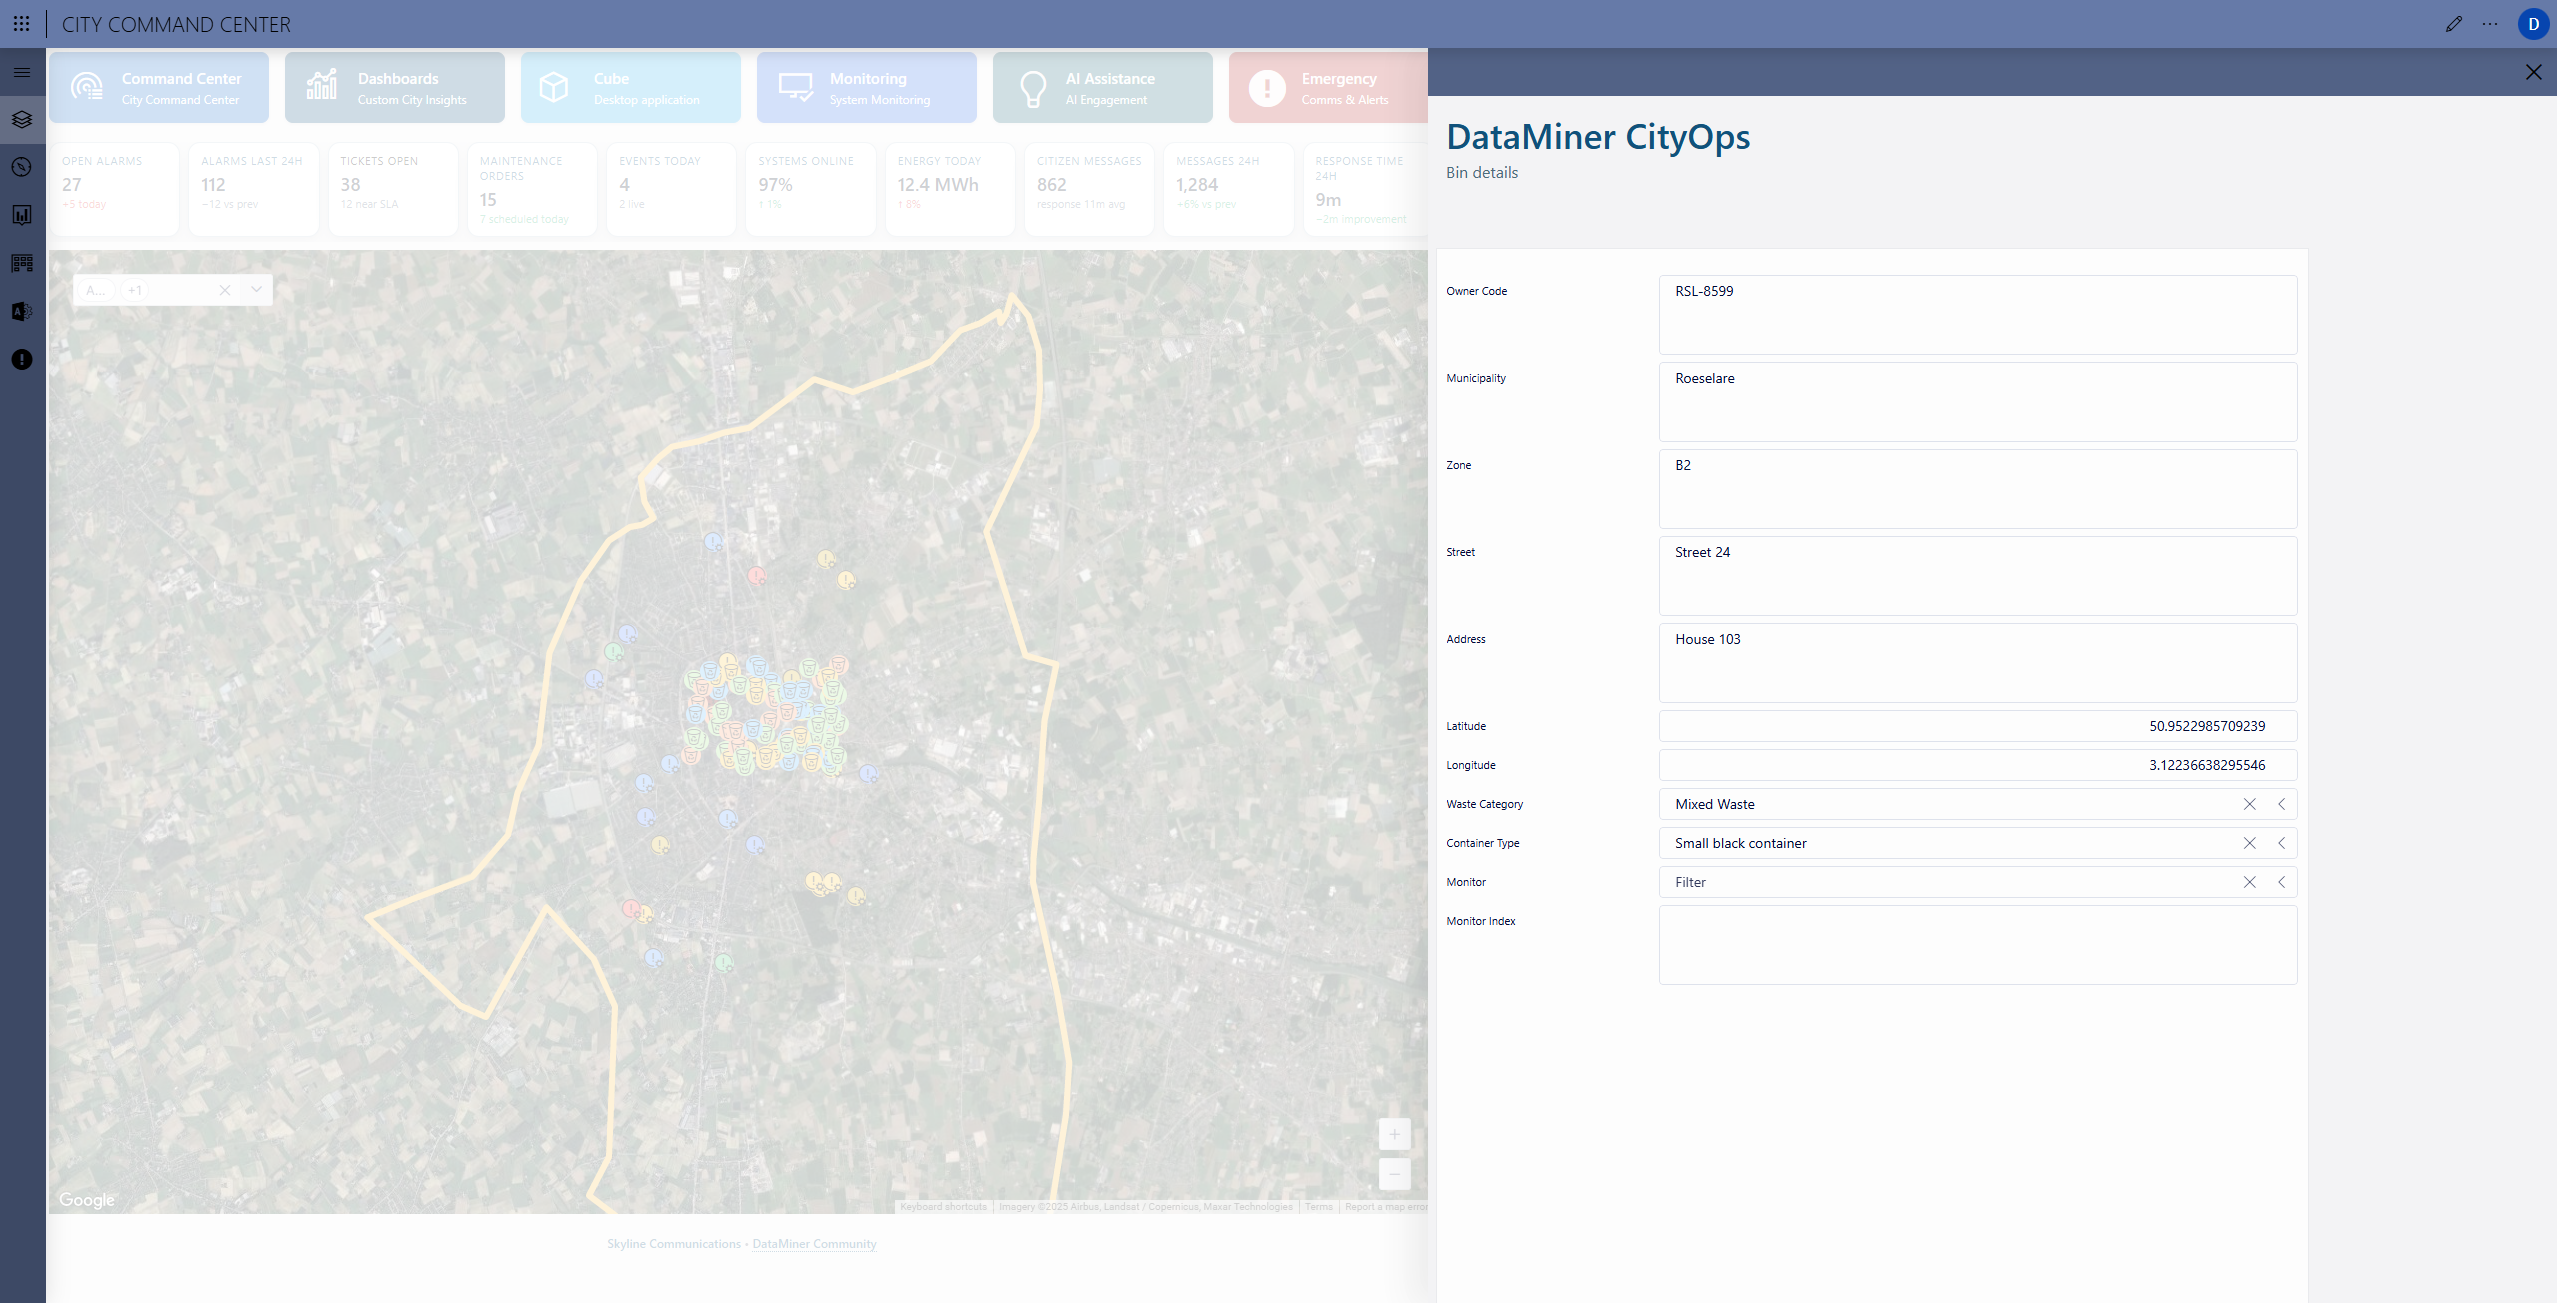 Operators can check the status of each container and correlate it with maintenance schedules or collection efficiency.
 The maintenance layer connects real-time operational events with ongoing work orders.
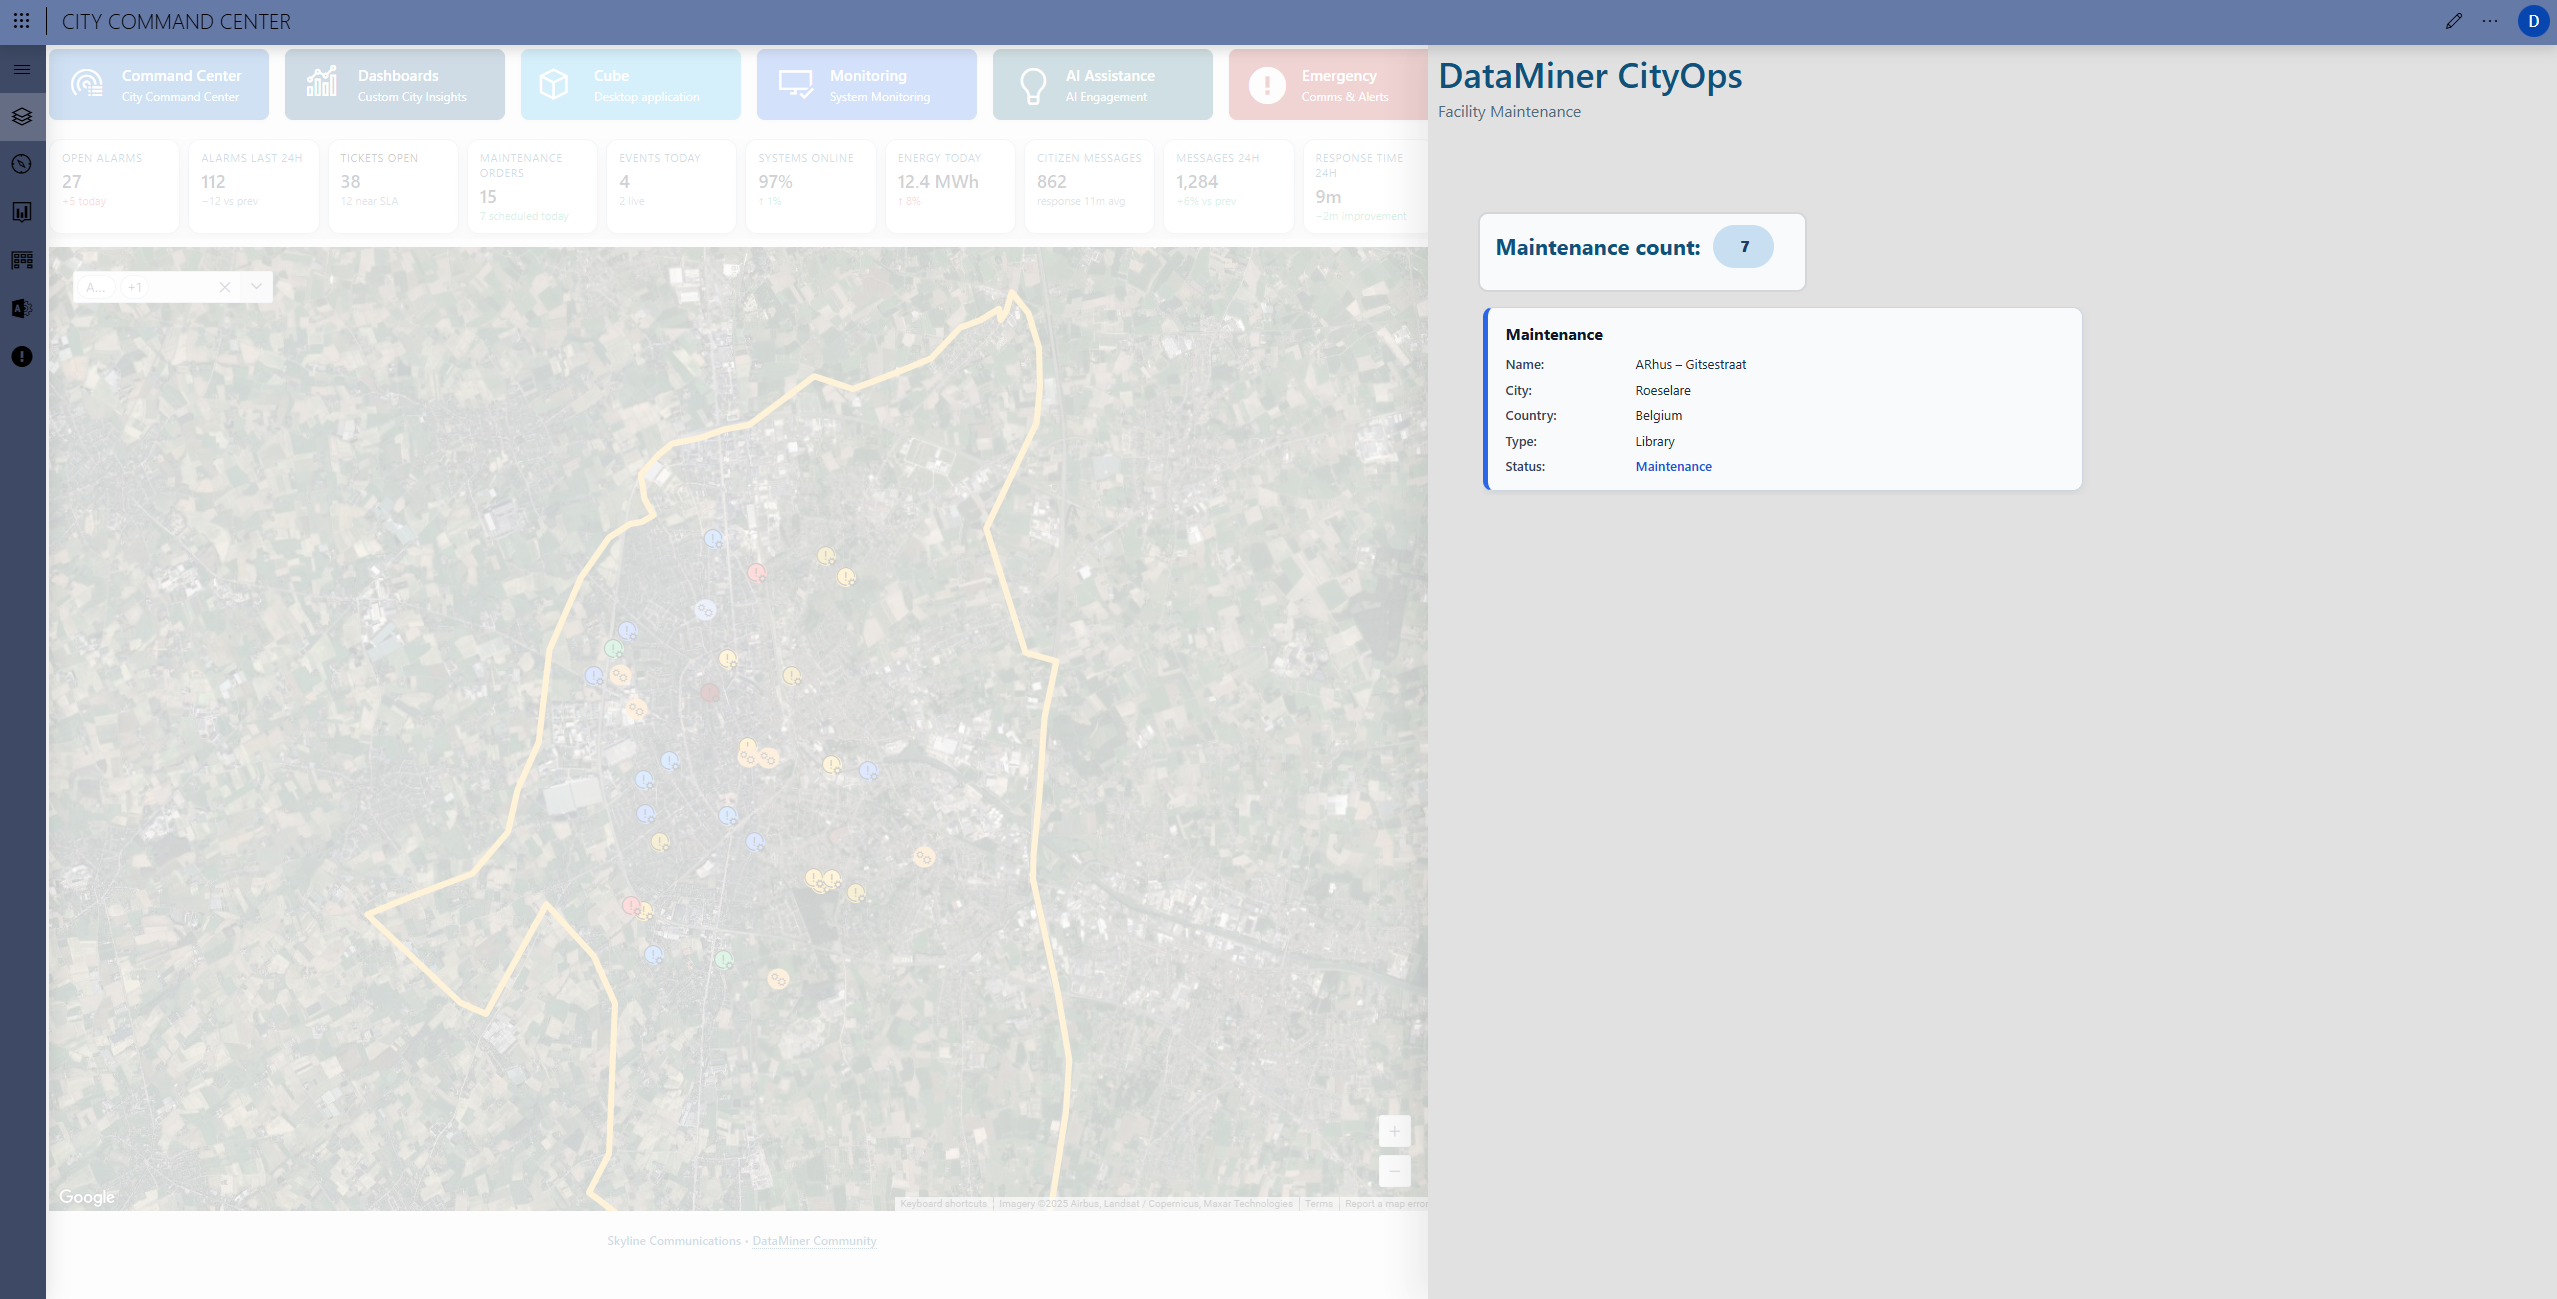 Active maintenance sites are displayed directly on the map, along with details such as site type, responsible teams, and task progress.
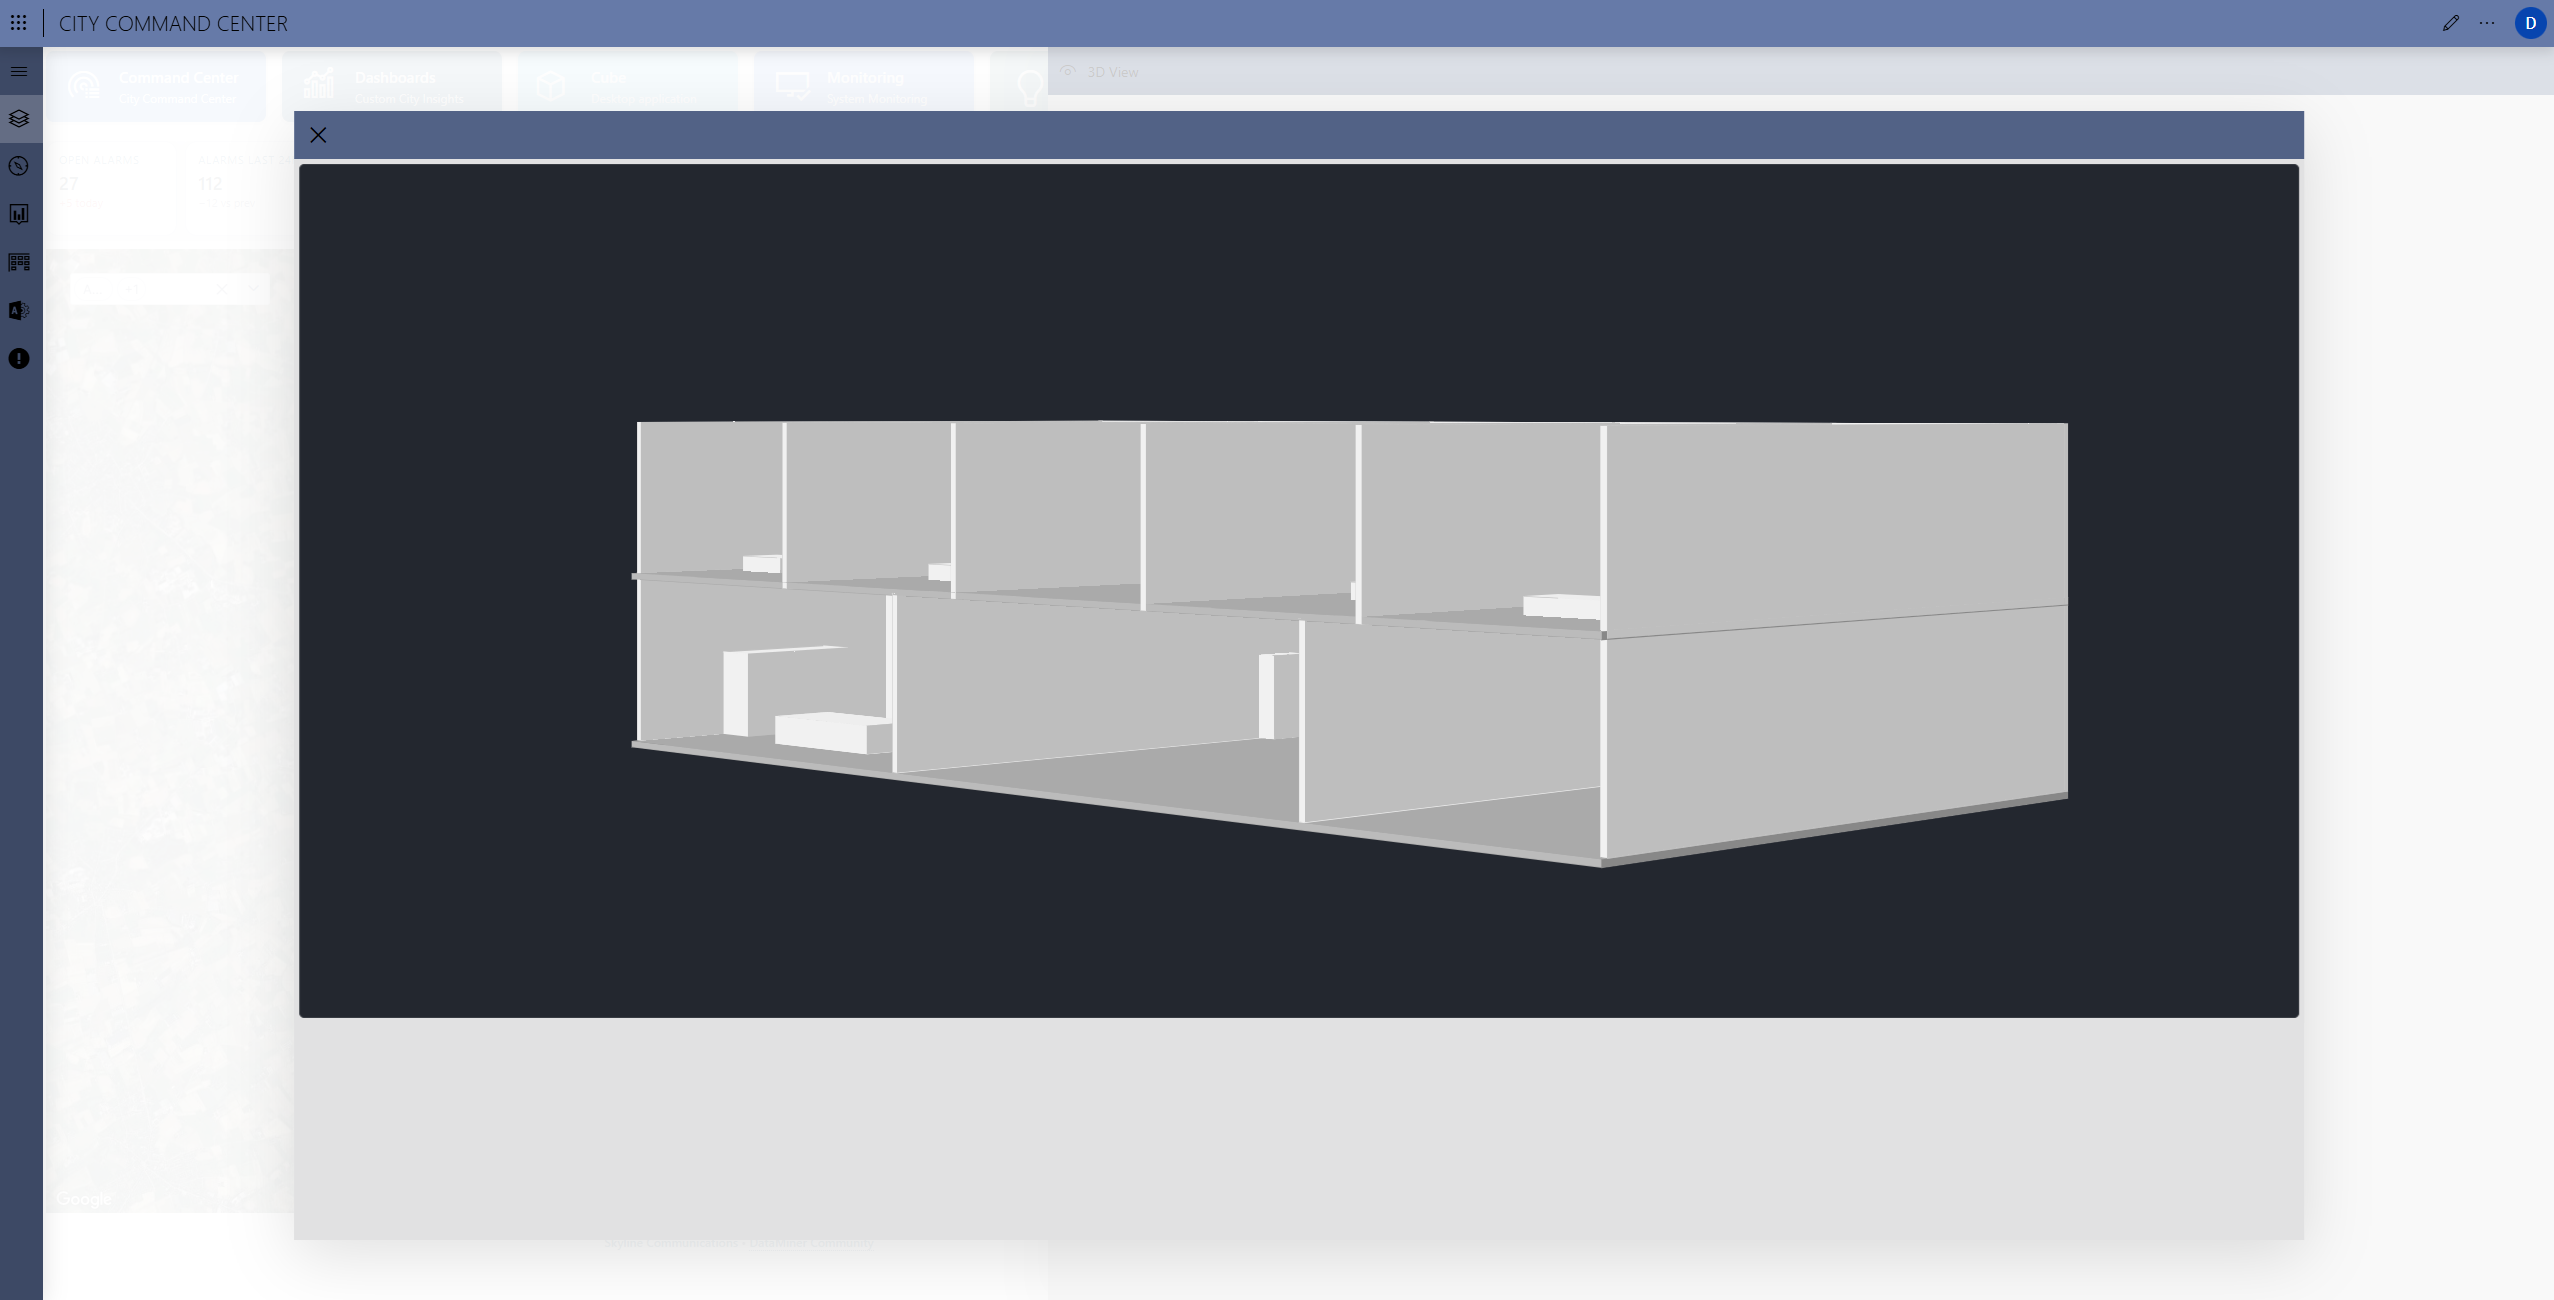
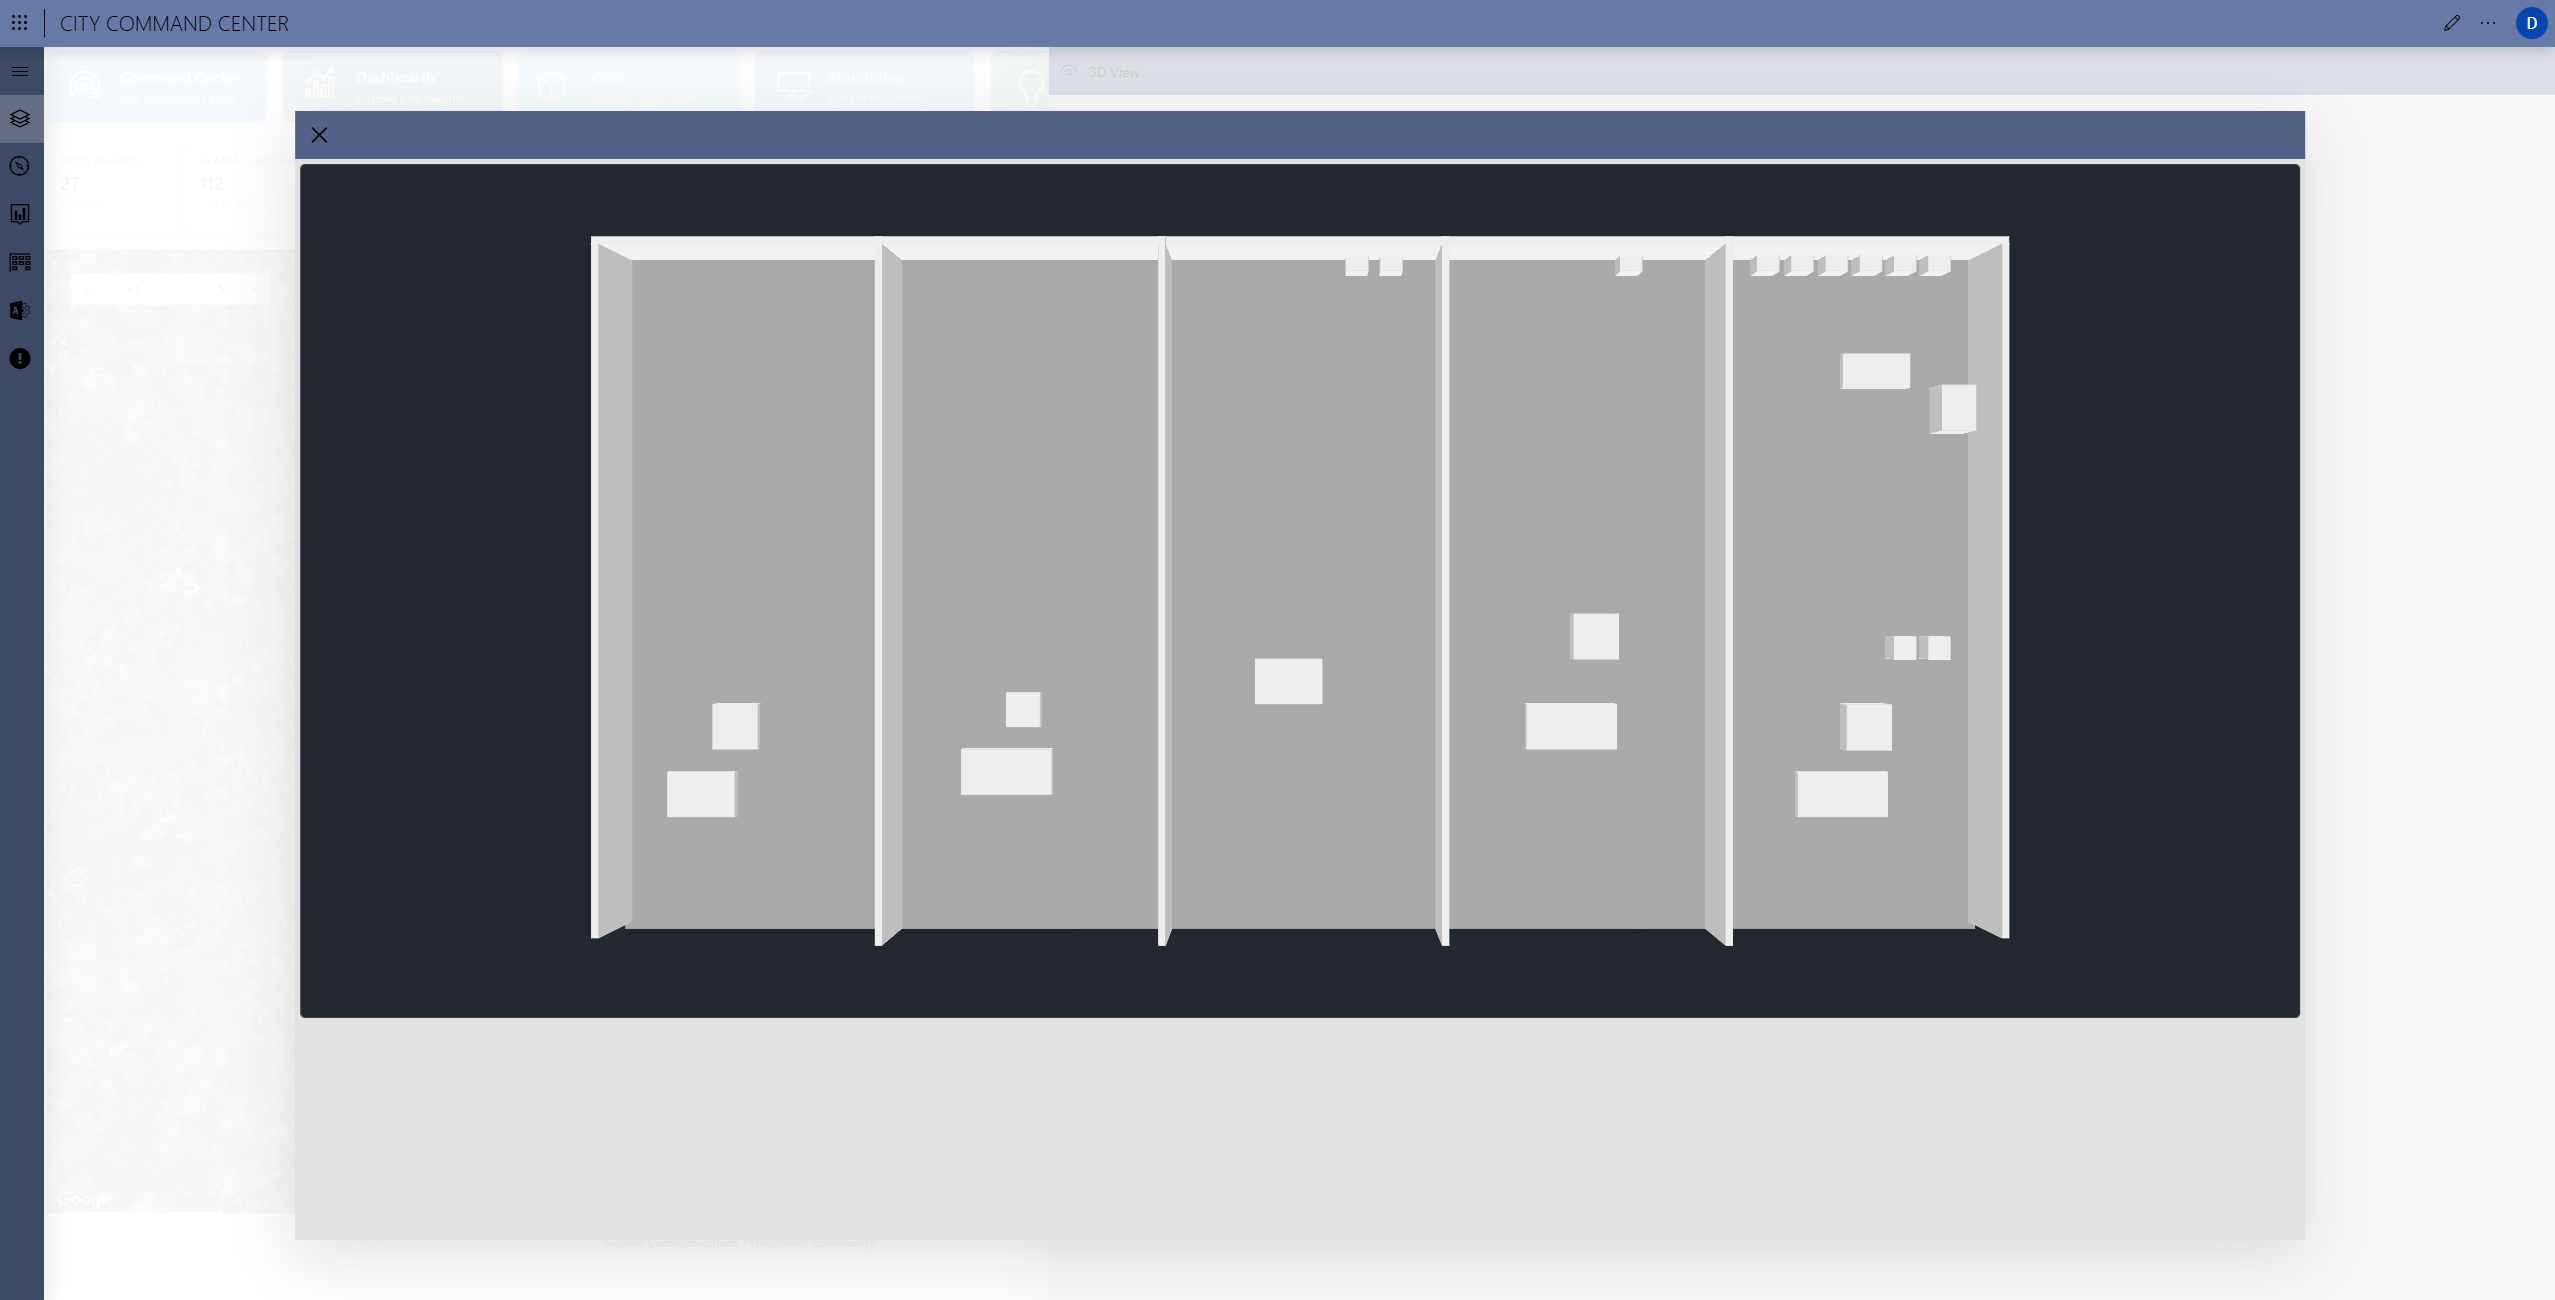
 Facility views enable a closer look into key buildings, with DataMiner’s 3D visualization providing insight into subsystems like energy, water, temperature, and occupancy.
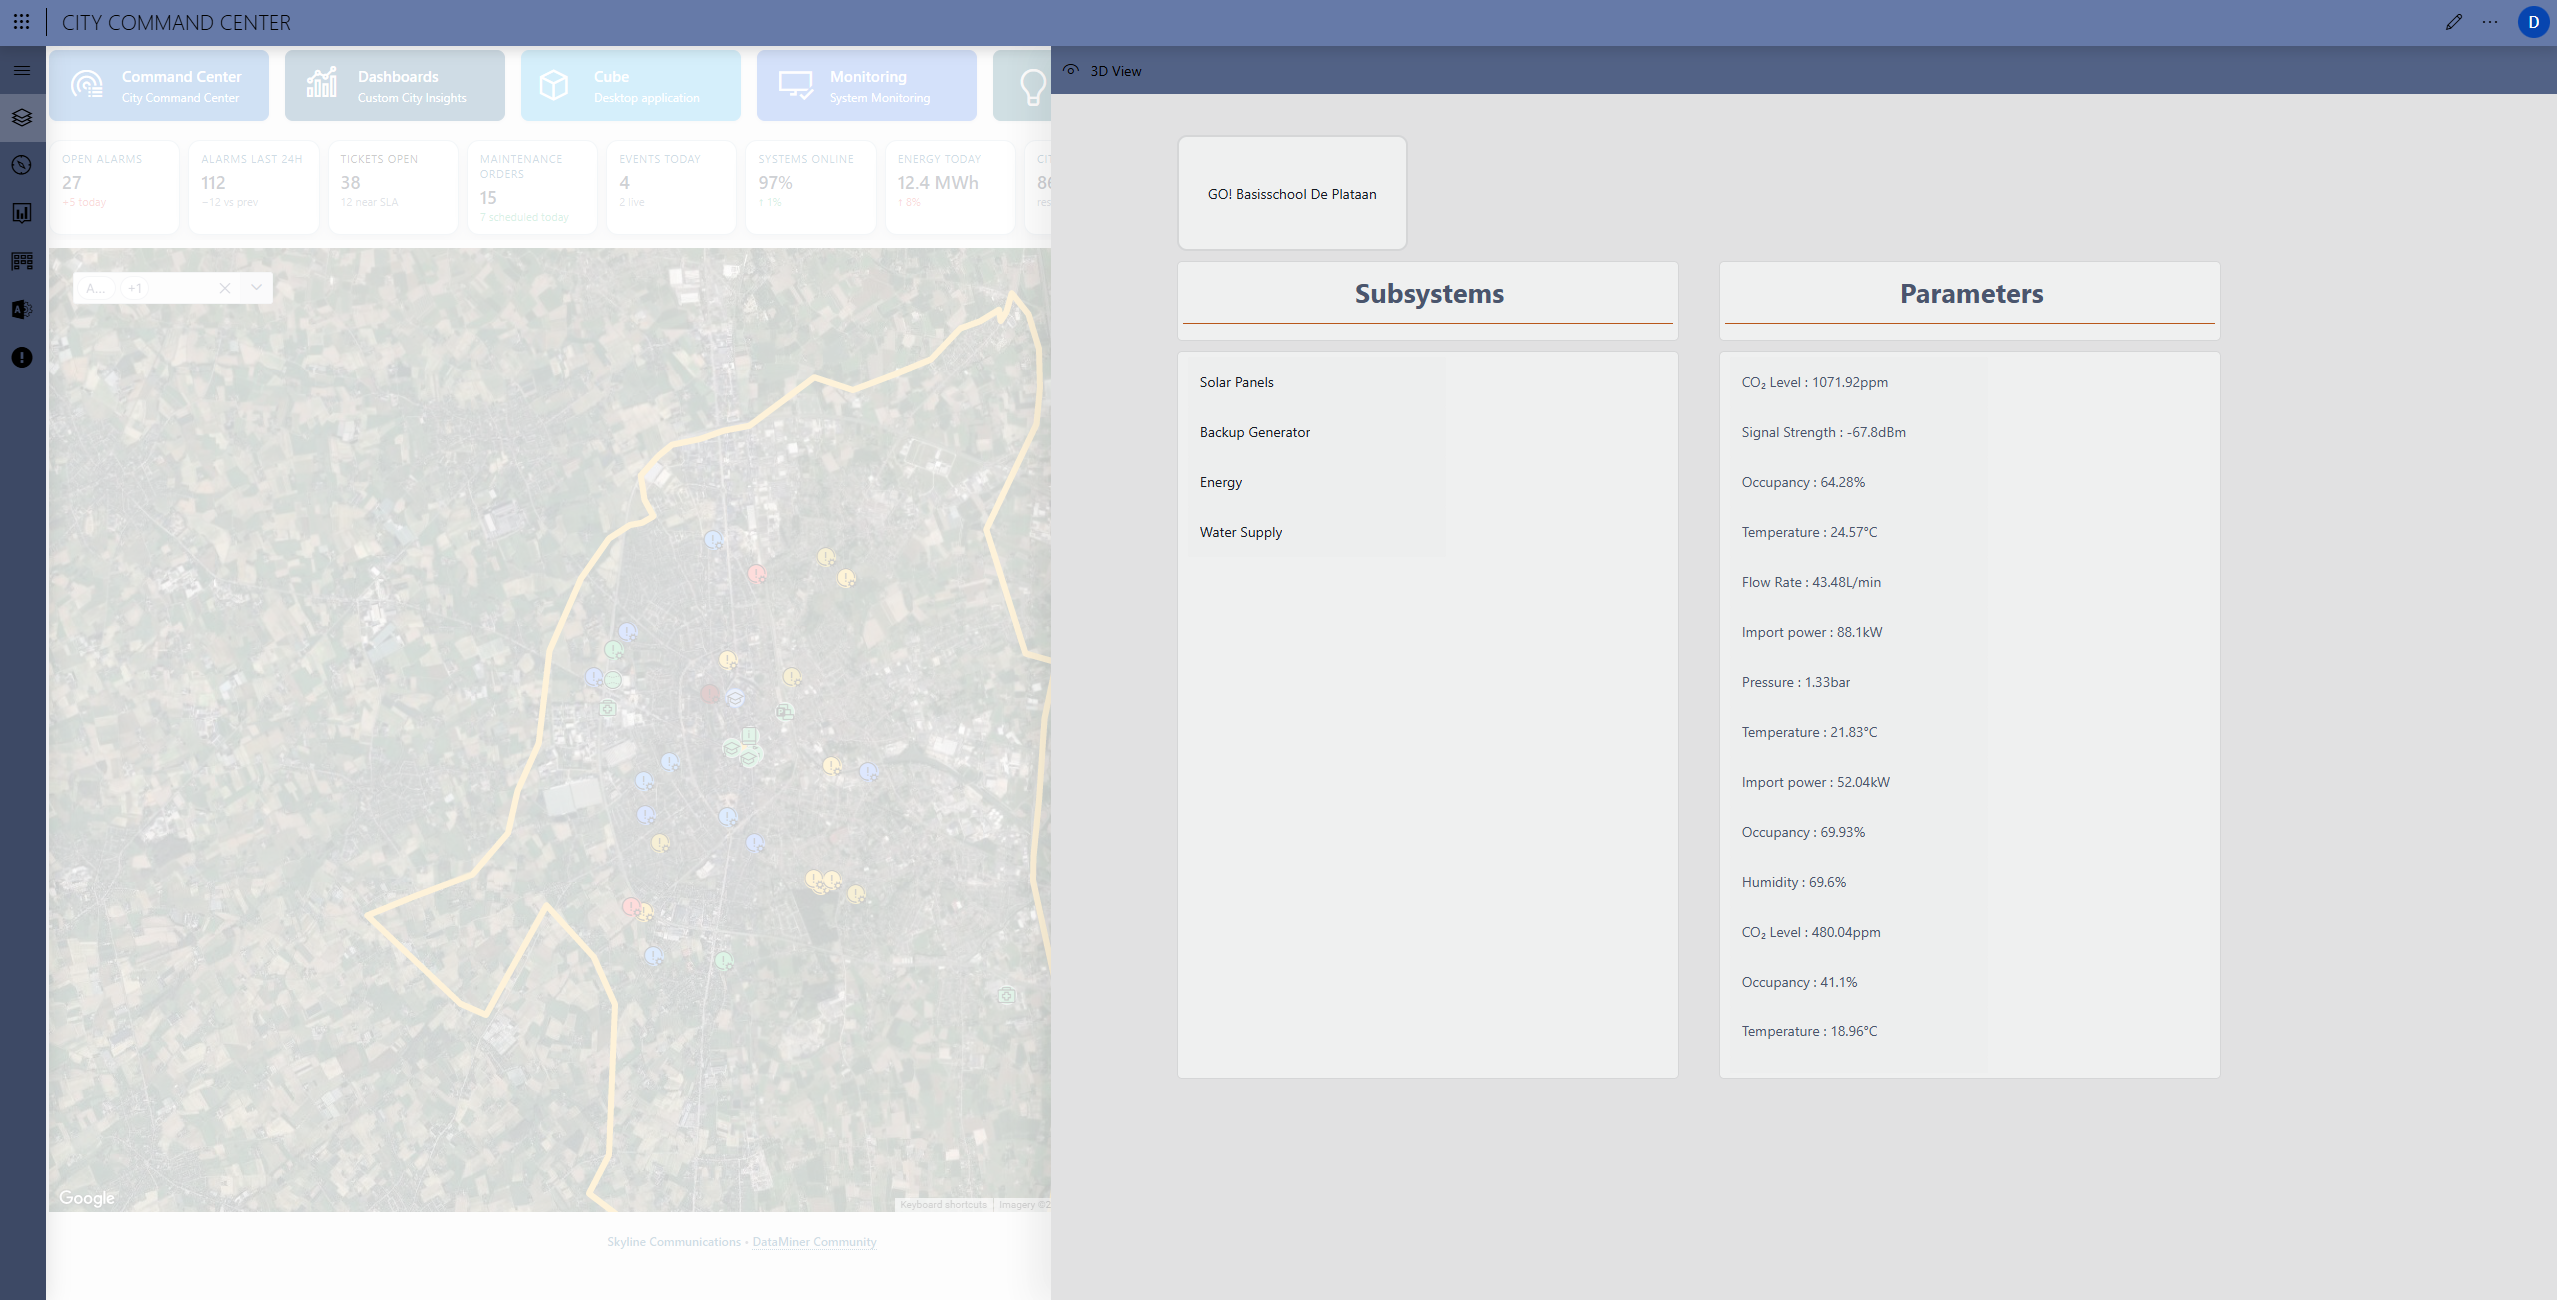 This creates a complete situational picture of how every city asset performs and interacts within the urban environment.
 The security camera layer offers a real-time overview of all connected surveillance points across the city.
 Operators can open live feeds or review detection timelines directly within the Command Center. When an anomaly or intrusion is detected, the system automatically associates it with nearby alarms or incidents, providing immediate situational awareness and enabling rapid verification or escalation. This seamless integration of video analytics enhances public safety monitoring and supports coordinated emergency response.
 Environmental layers provide access to sensor networks monitoring air quality, temperature, noise, or humidity across city zones. Each reading is displayed geographically, allowing patterns and anomalies to be quickly identified and addressed.
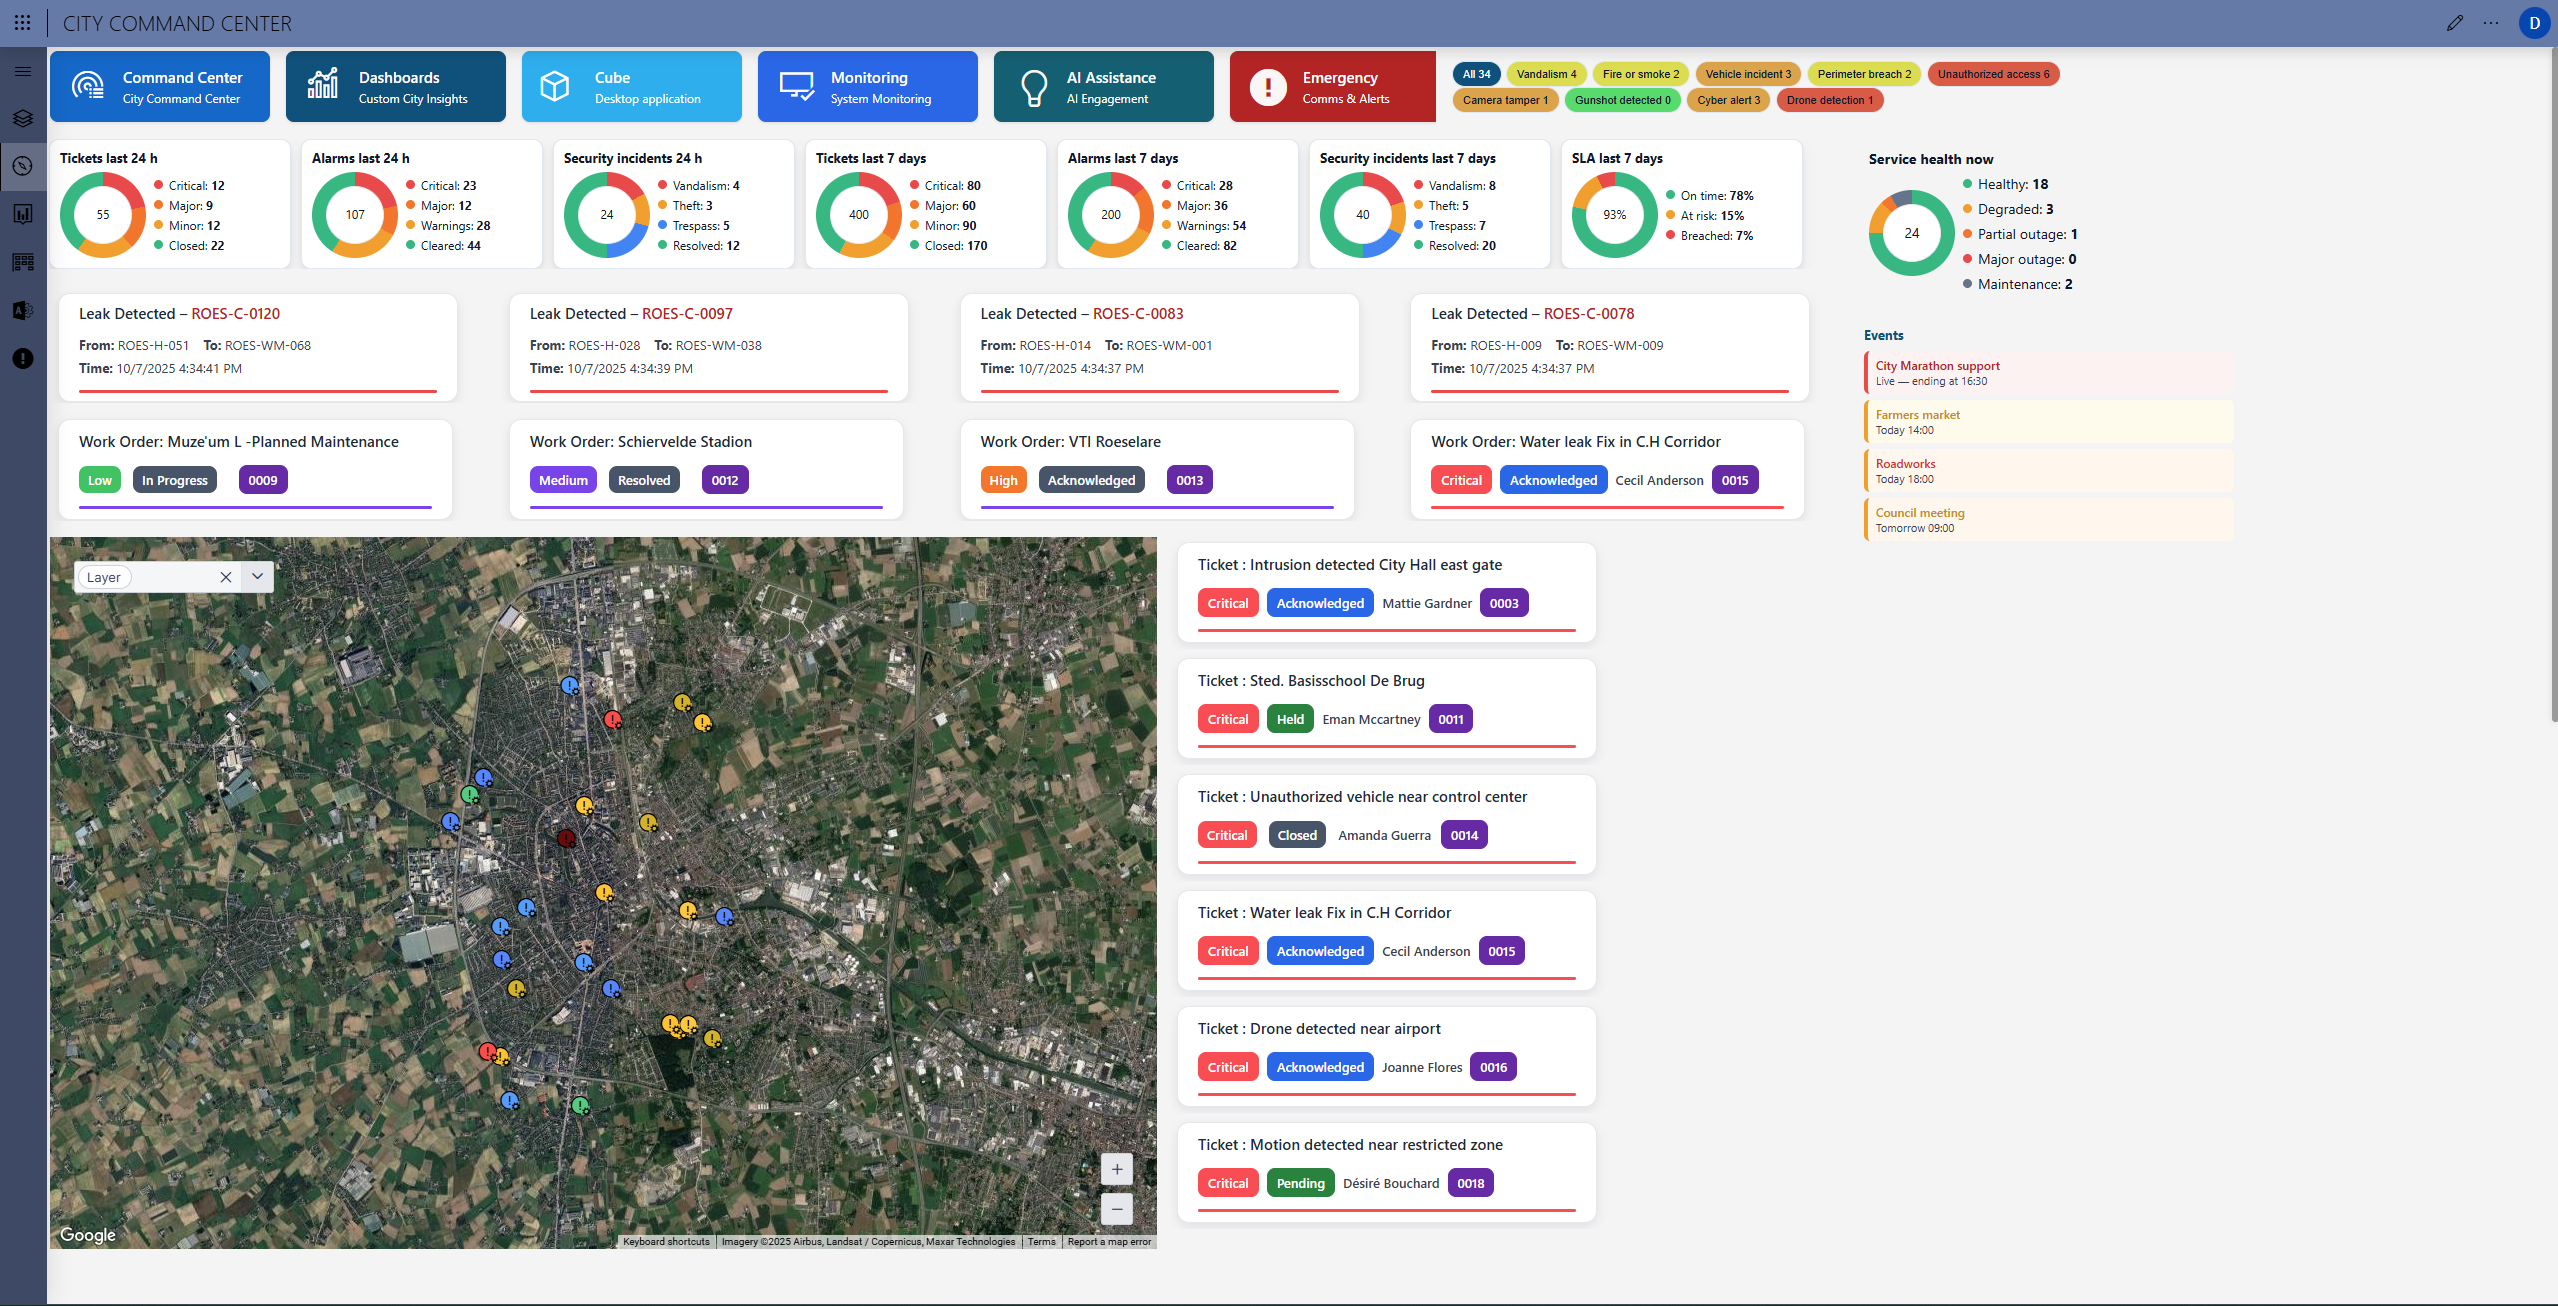
 Through this layered view, city operators can immediately access detailed information, acknowledge alarms, or open related incidents with a single click. Aggregated dashboards above the map display key indicators such as alarms, maintenance orders, ticket counts, and system availability, creating a concise operational summary of the city at a glance.
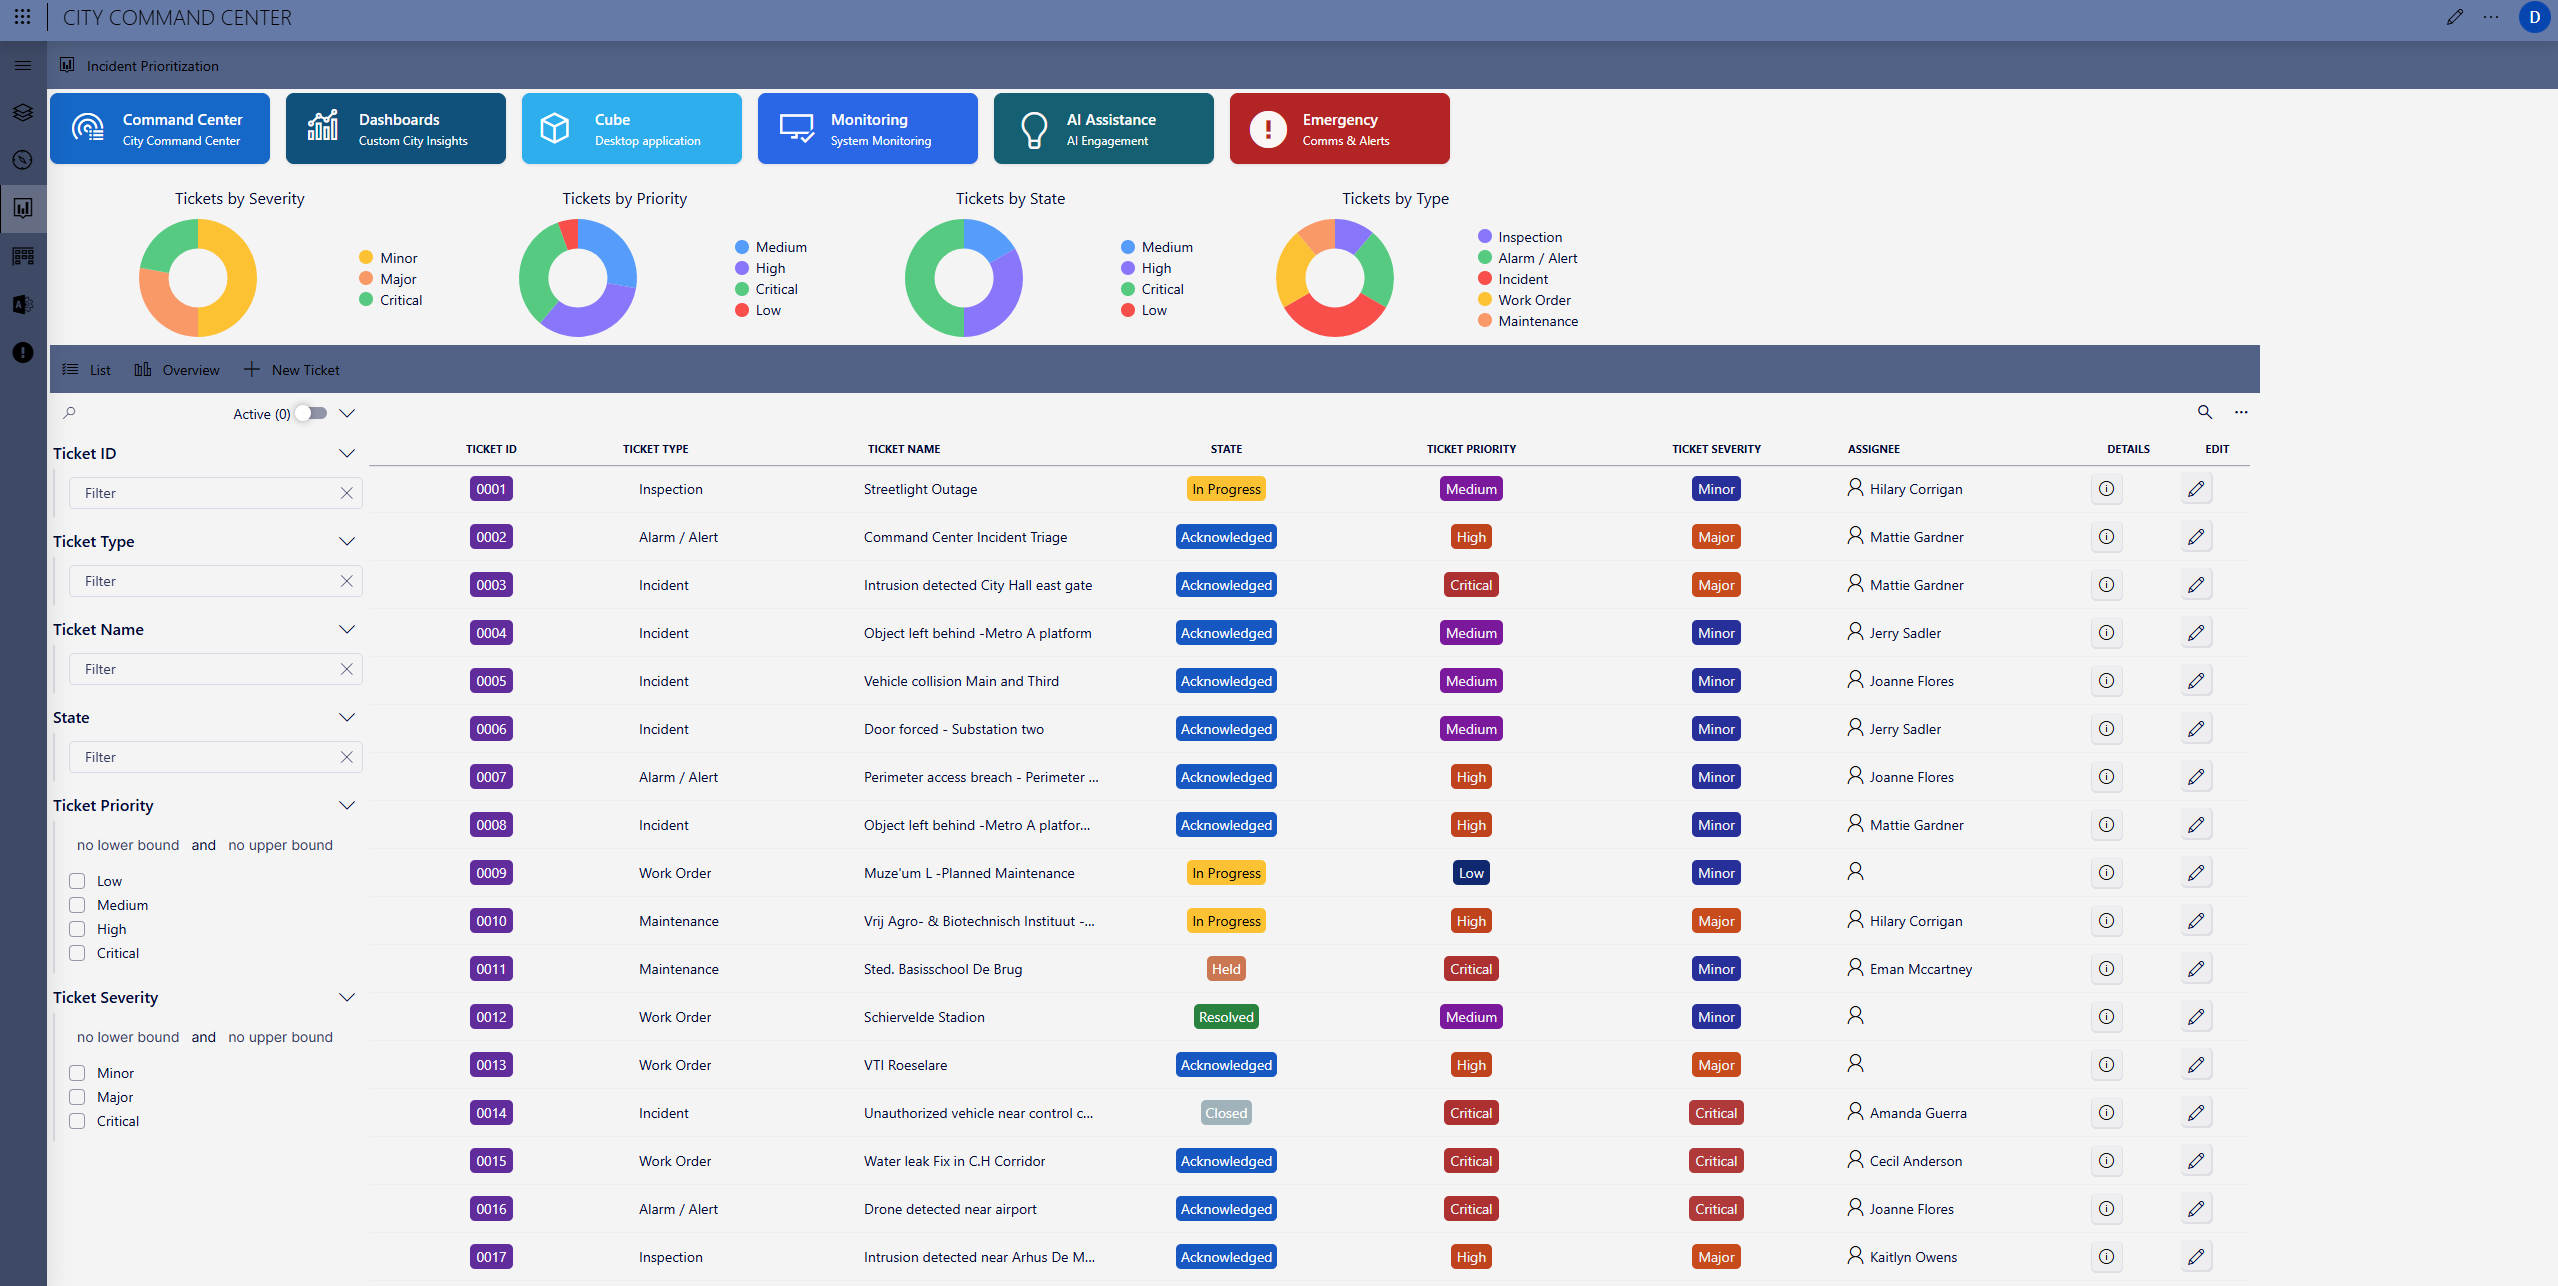
Incident prioritization
The Incident Prioritization page gives operators a clear and actionable overview of all ongoing and historical incidents across the city. It transforms complex operational data into an intuitive workspace where every alert, ticket, and work order is organized by severity, priority, and type.Visual dashboards at the top summarize the city’s live operational load, showing the number of tickets by severity, priority, and type. These charts provide an instant understanding of how many incidents are critical, which ones are approaching SLA deadlines, and how resources are currently distributed across maintenance, inspection, or emergency work.
The interactive ticket table lists every active record with real-time filtering by category, ticket type, or state. Operators can instantly find any issue, from streetlight outages and unauthorized access alerts to maintenance tasks and planned works. Each entry is linked directly to its geographic position on the Command Center map, providing full contextual awareness.
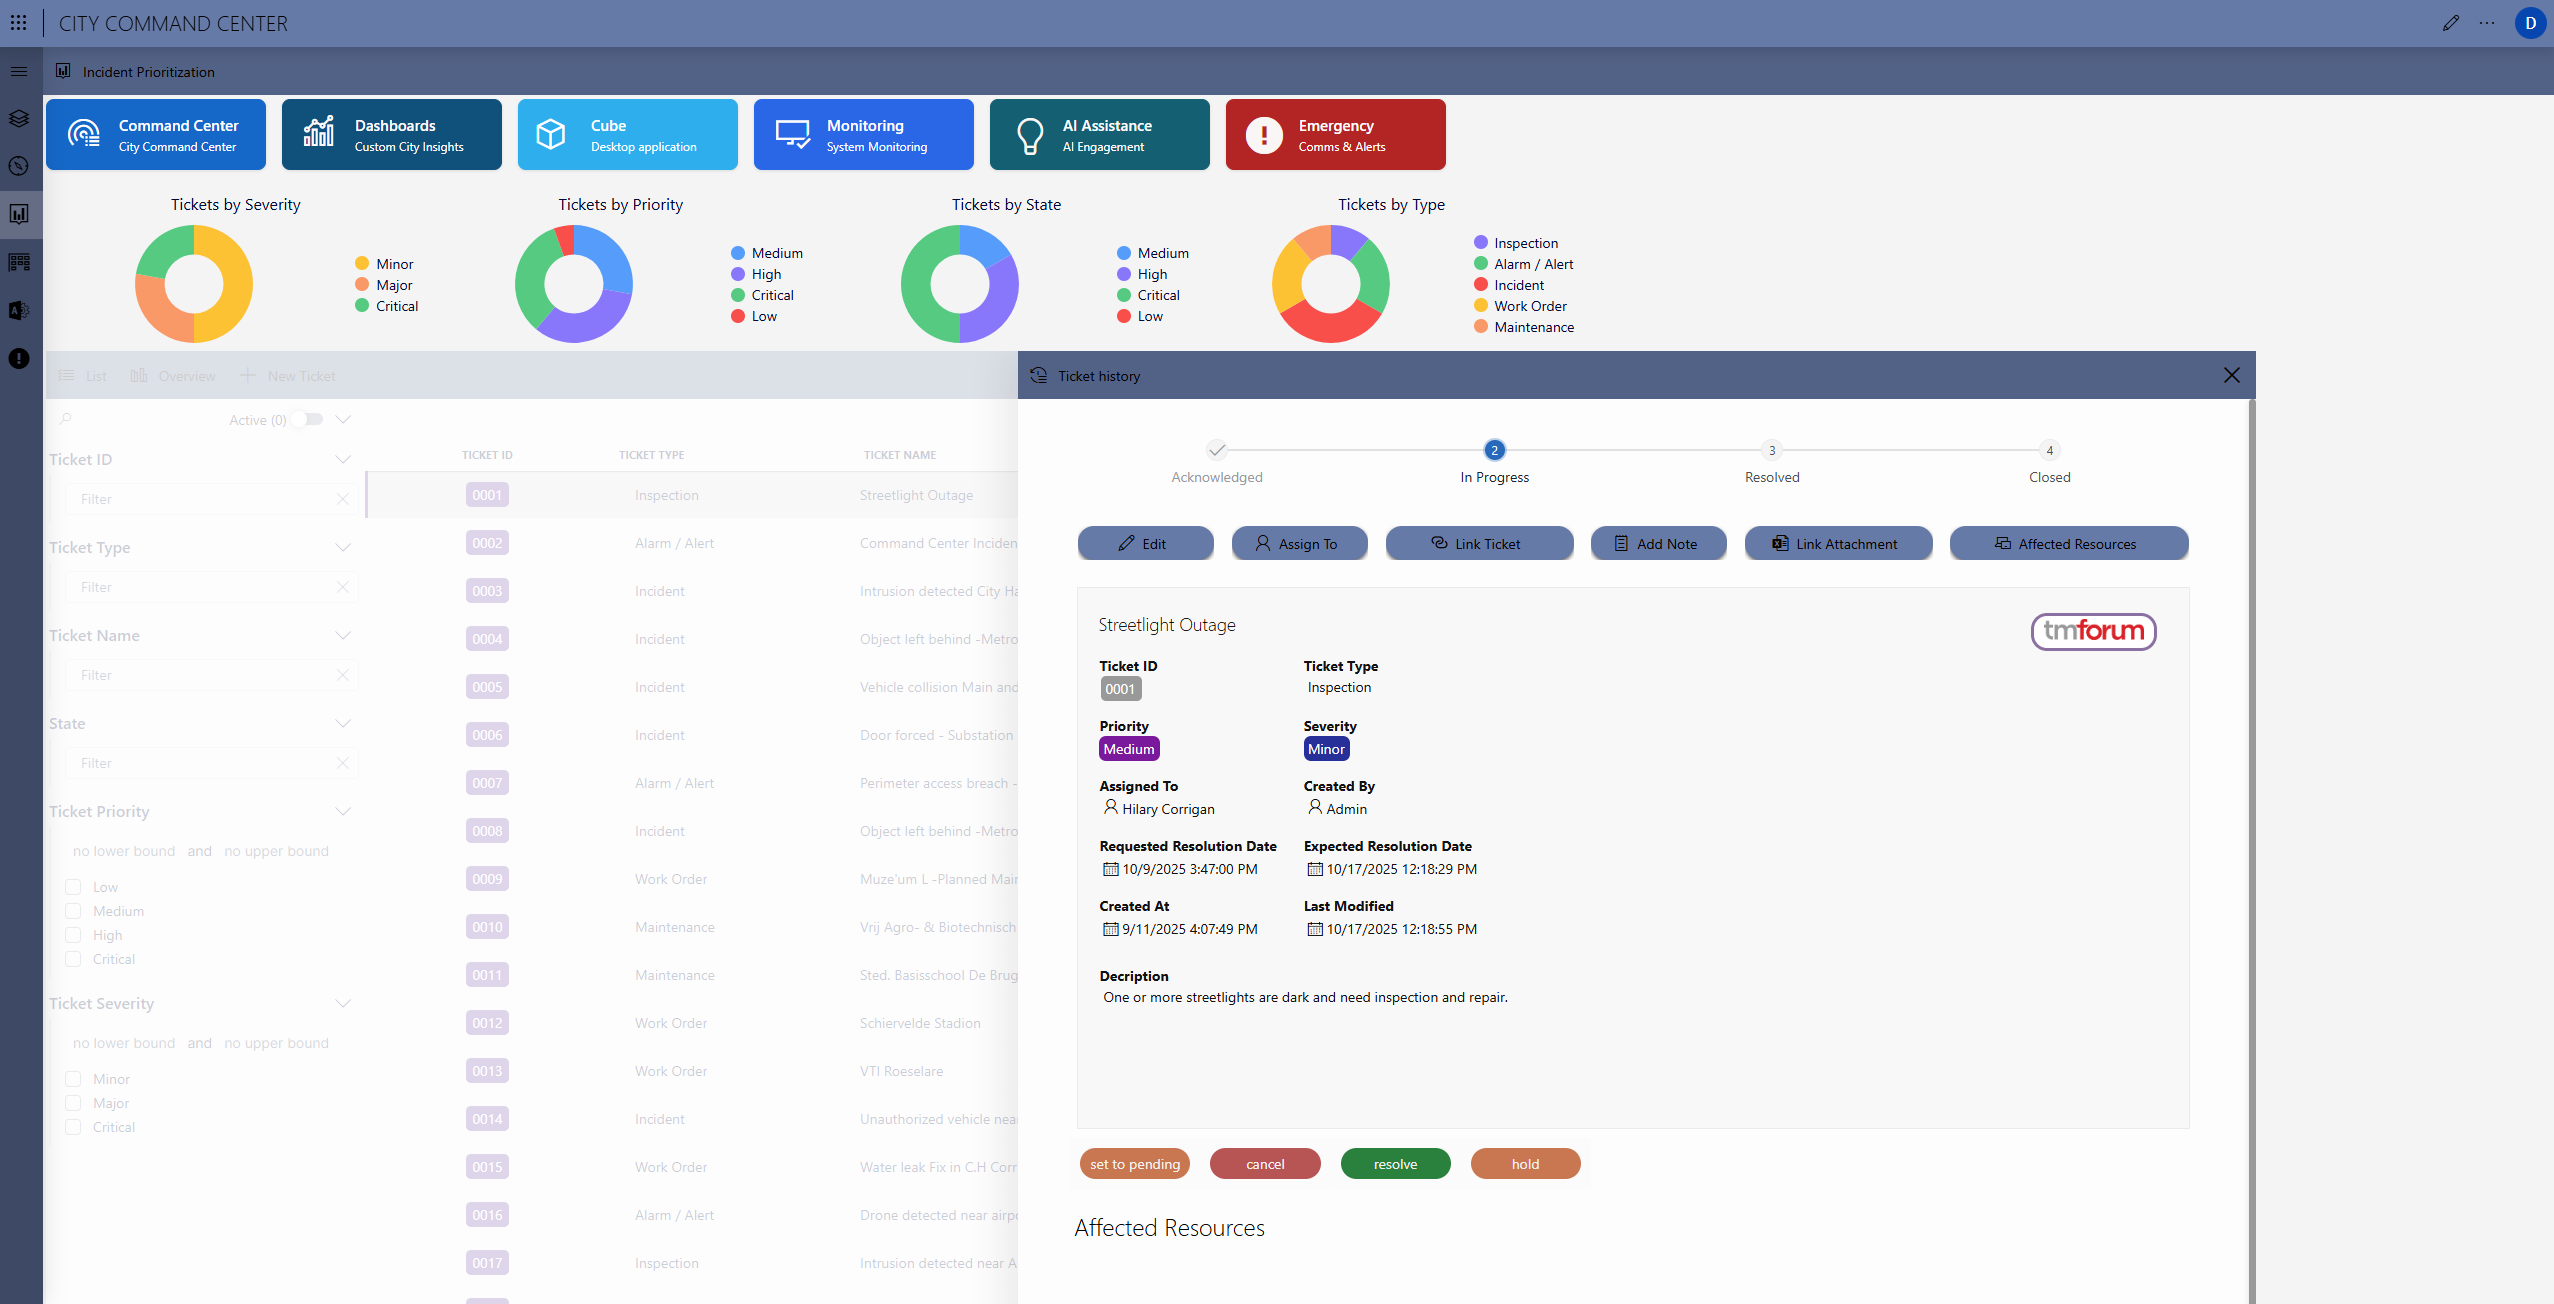 Within each ticket, details such as assignee, creation time, priority, and expected resolution date are automatically tracked. DataMiner ensures that incidents are managed according to standardized workflows, aligned with compliant procedures. Teams can update the state of any ticket, link it to related alarms or work orders, and add notes or attachments for documentation and collaboration.
The system automatically correlates related events, highlighting patterns like repeated alarms in the same area or multiple tickets affecting a single facility. This allows the city to move from reactive handling to proactive planning, focusing first on the incidents with the highest operational or safety impact.
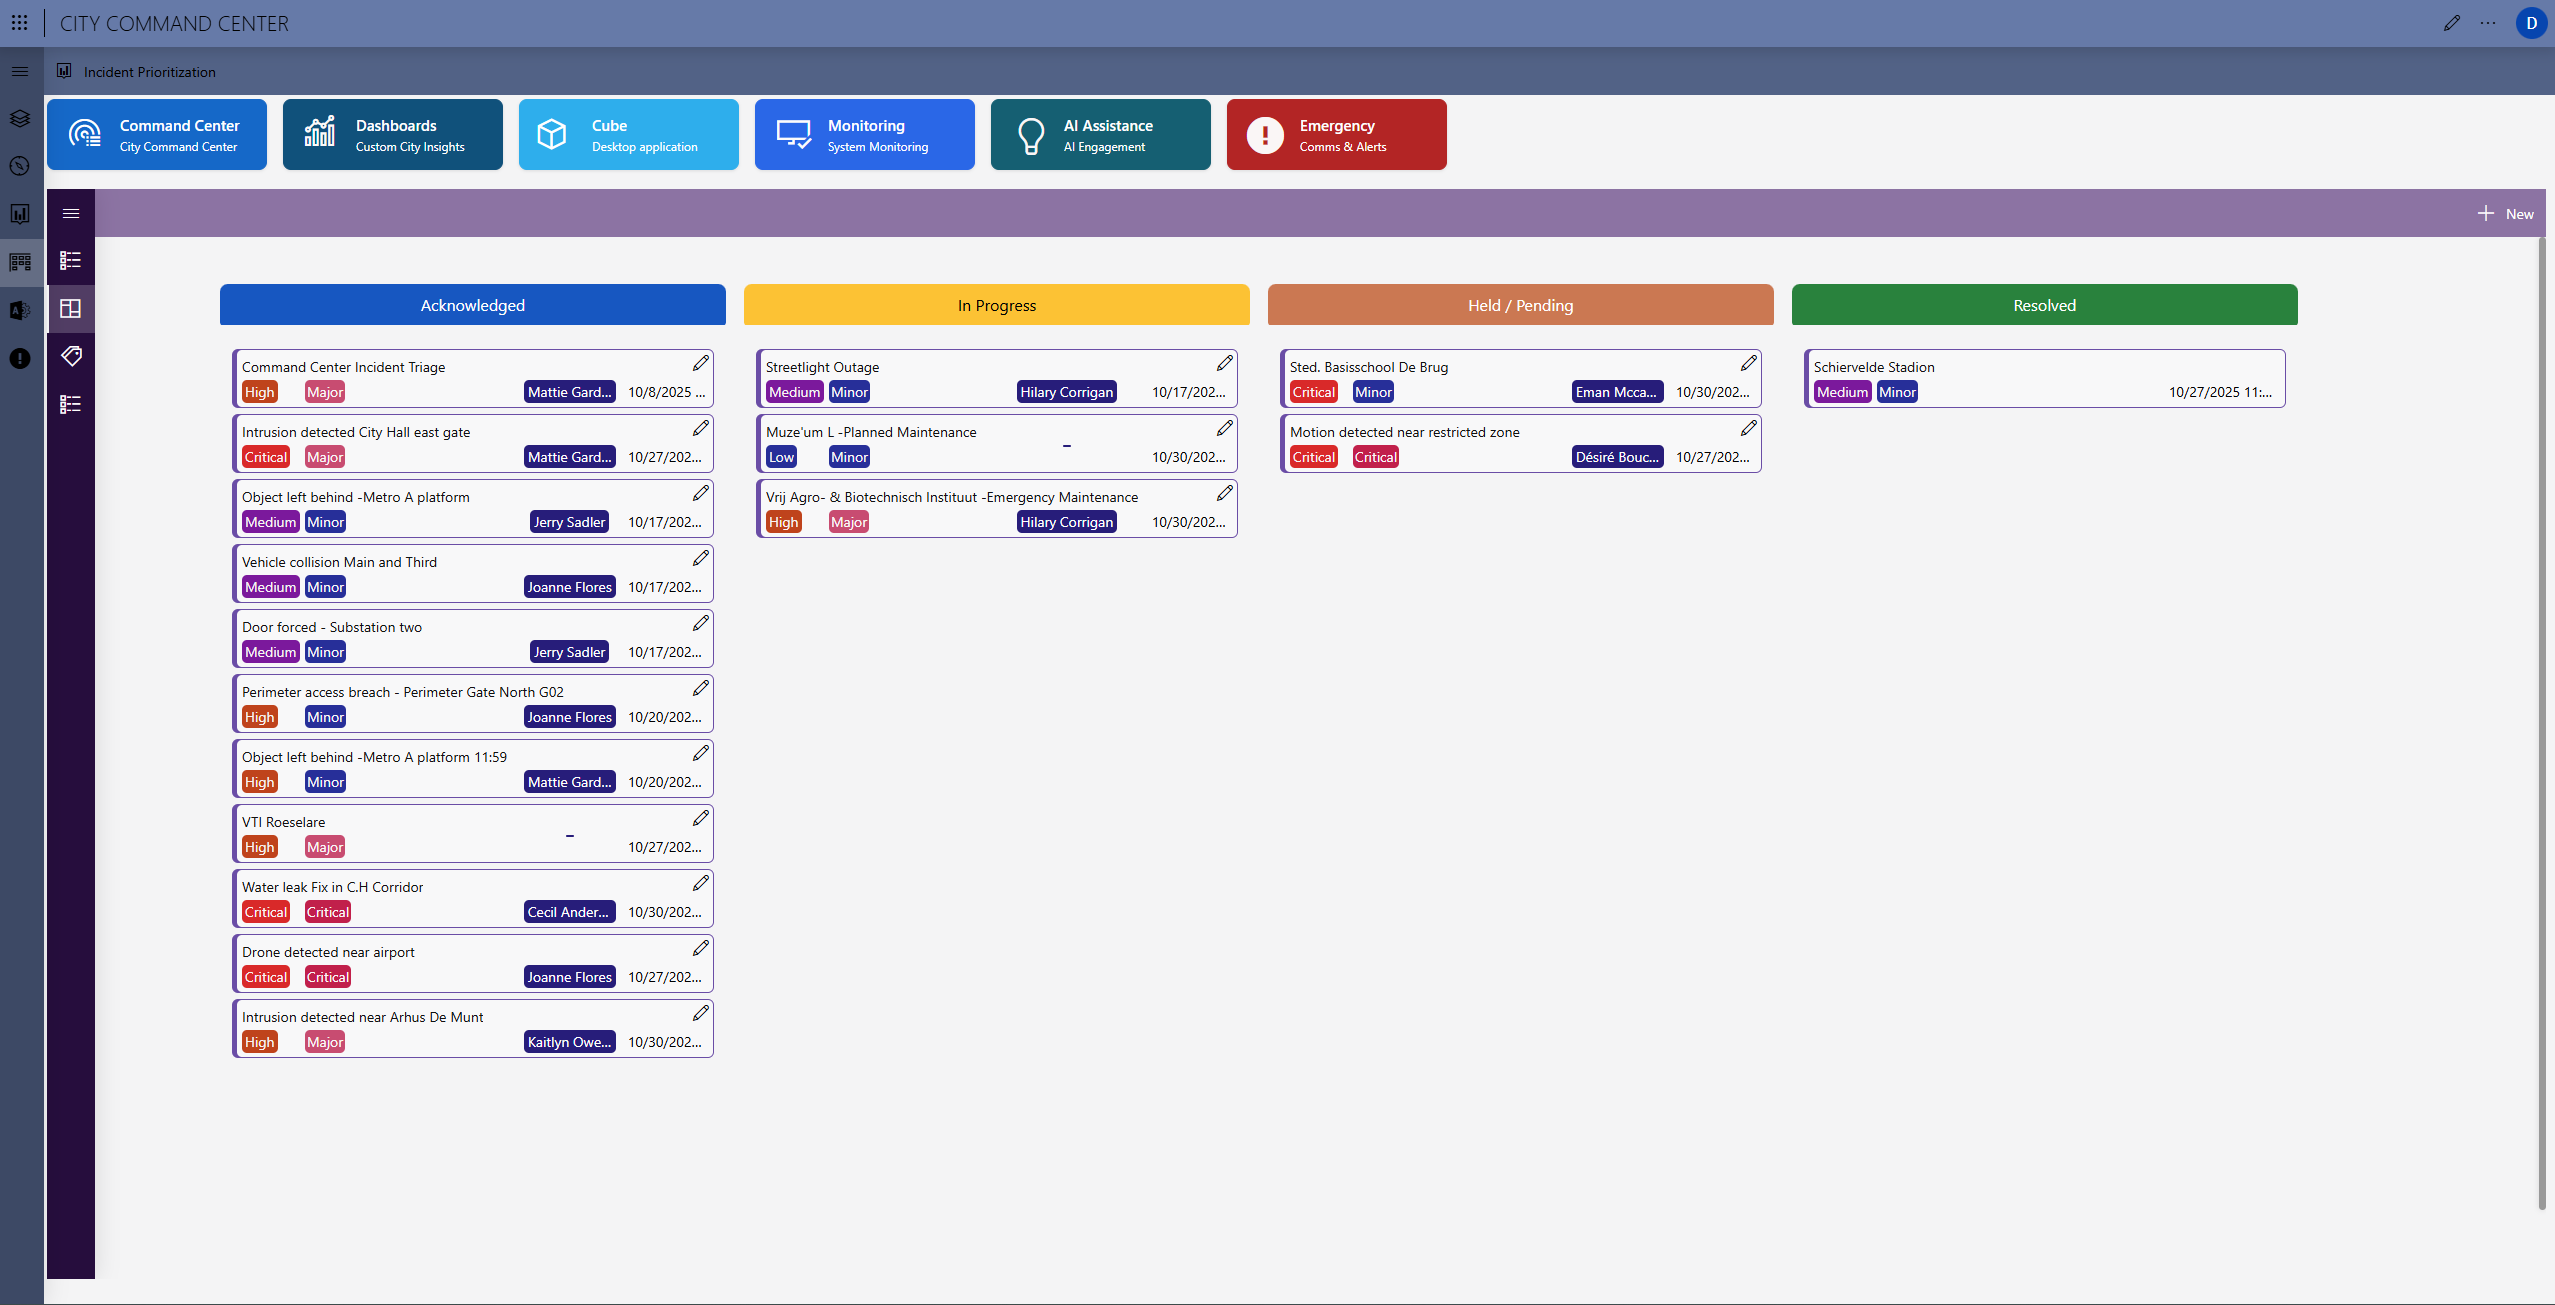
Tickets and Work Orders board
The Tickets and Work Orders board provides a centralized and transparent workspace for managing all ongoing activities across city operations. It brings together incidents, work orders, inspections, and maintenance tasks into one unified view, allowing every team to coordinate seamlessly from acknowledgment to resolution.The board organizes tasks visually by status (acknowledged, in progress, held or pending, and resolved), giving operators an instant overview of operational workload and task progression. Each card represents a live ticket, complete with priority, severity, assigned operator, and due dates. This layout makes it easy to track who is working on what and how each task contributes to restoring or maintaining service continuity.
 DataMiner automatically synchronizes information from correlated alarms and incidents, ensuring that every work order is tied to its originating event. This correlation helps eliminate duplication, reduces time spent on diagnostics, and provides full traceability of operational actions.
The board also supports predictive and preventive maintenance scheduling, showing planned interventions alongside reactive ones. Teams can prioritize based on urgency, operational impact, or SLA deadlines, ensuring that critical services receive immediate attention while routine maintenance continues without disruption.
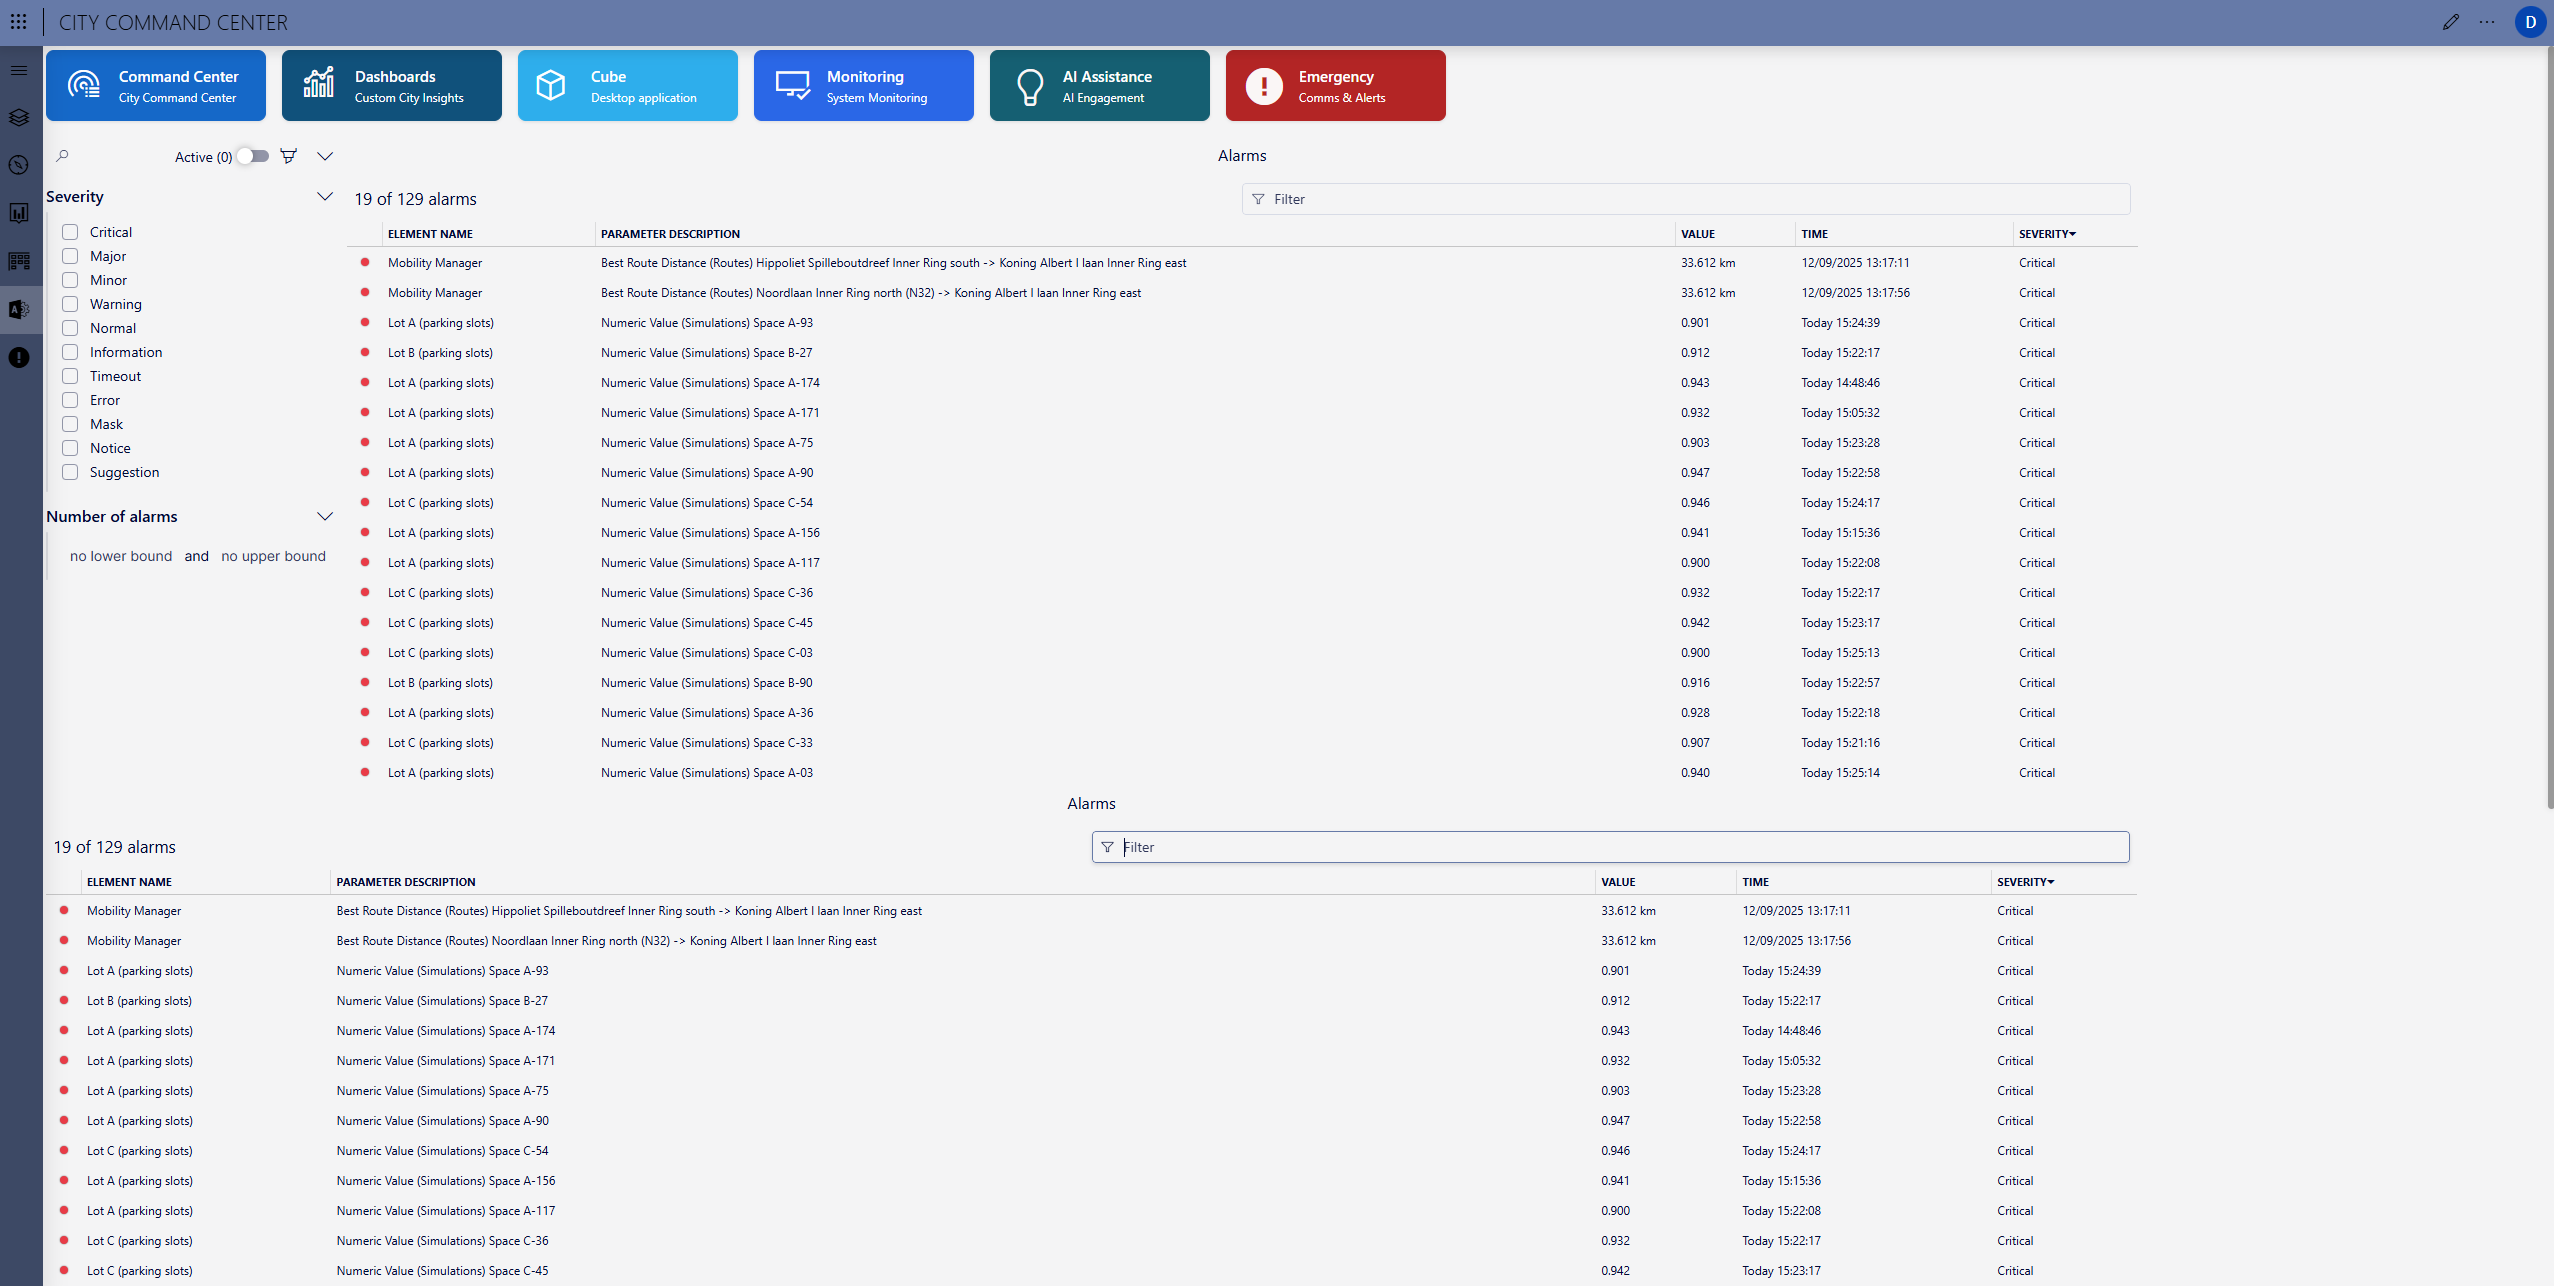
Alarms and events
The Alarms and Events page brings together every alert, notification, and system event across the entire smart city ecosystem. It provides a complete real-time overview of operational status across all domains, helping operators identify, filter, and act on what truly matters.Every connected system, from traffic and energy networks to lighting, facilities, and environmental monitoring, sends live data to the Command Center. When conditions exceed predefined thresholds or anomalies are detected, DataMiner automatically generates alarms that appear in this centralized view. Operators can immediately see the affected element, the event description, time of occurrence, and severity level.
The interface allows quick filtering by severity, type, or domain, ensuring that critical alarms are instantly visible while informational messages remain accessible for later review. This structured visibility prevents alert fatigue and ensures the team’s focus remains on priority events that could impact operations or public safety.
DataMiner’s advanced Correlation Engine automatically links related alarms across systems and domains. A single event such as a power outage may generate multiple alarms from lighting, traffic control, and building systems, all automatically grouped and enriched with context to simplify investigation. From this view, operators can acknowledge alarms, trigger tickets or maintenance work orders, and monitor their resolution status in real time.
Historical tracking and trend analysis are also available, helping the city identify recurring issues, system vulnerabilities, or early indicators of degradation. Over time, this data enables predictive maintenance and continuous optimization of city infrastructure.

Emergency response & engagement
The Emergency Response & Engagement page empowers operators to manage citywide communications during critical events from a single control environment. It connects every communication channel and digital endpoint across the city, allowing fast, accurate, and coordinated public messaging.Operators can select the source of an alert or announcement, such as emergency services, maintenance teams, city hall, or social media. Messages can then be broadcast to multiple destinations including public digital signage, radio announcements, police stations, or social media platforms. With a simple two-click process, alerts and updates can be shared instantly with the right audience, ensuring consistent and timely information delivery across all channels.
The interface visualizes active communication links in real time. Sources such as weather warnings, infrastructure updates, or public safety alerts are displayed on the left, while destinations such as city squares, transport hubs, or communication platforms appear on the right. Operators can easily connect or disconnect sources and destinations, controlling exactly where and how each message is broadcast.
This unified communication hub allows cities to act decisively during emergencies or planned events. Whether it is sending a severe weather alert, issuing a traffic diversion notice, or activating a citywide evacuation message, DataMiner ensures full situational coordination between agencies and the public.