example Use Case
Spectrum Assurance and Teleport Interference
This use case focuses on a solution to find, log, and alarm RF interference and impairments across the infrastructure of a leading satellite provider during the 5G C-band transition. This enables different teams to work quickly and precisely, minimizing operational costs, maintaining customer satisfaction, and improving KPIs and KQIs.
The project started as a Carrier Transition Automated Transponder Monitoring Solution for the 5G roll-out migration of 280 Mhz from the satellite C-band to an upper band. It then expanded into a comprehensive mobile RF diagnostics tool to detect interference from 5G cellular towers reported by customers.
The overall solution consists of two parts. A round-the-clock surveillance system gathers data from spectrum analyzers, IRDs, and satellite databases, and a portable rack system adds a 5G scanner and L-band trace readings to the solution. With the 5G tool, operators can confirm if detected interference is from a 5G tower or from another source, and they can escalate accordingly.
The Automated Transponder Monitoring Solution empowers the end user to look at the RF, power, BW allocation, and historical data in a correlated and straightforward way. It raises alarms in case of faults and allows the end user to detect interference at a quick glance. The solution manages and monitors equipment from multiple vendors, such as SED Decimator, Harmonic PVR, Applied Instruments RFSD, and Viavi SPA, while also collecting data from CellAdvisor and Monics.
The solution has multiple levels of analysis. Contractors in the field can securely access the system and check the status of several transponders determining if the filters and dish replacements were effective. Operators can view the satellite transponders and quickly identify adjacent satellite interference (ASI) or cross-polarization interference (CPI). Finally, beyond all previous features, engineering has interactive capabilities allowing command and control of test equipment to correlate spectrum traces against transponder load levels and readings from all monitored equipment.
The comprehensive multi-level approach, using the same data and visuals, makes system troubleshooting with equipment from multiple vendors easy to interact with and creates a common language across departments.
USE CASE DETAILS
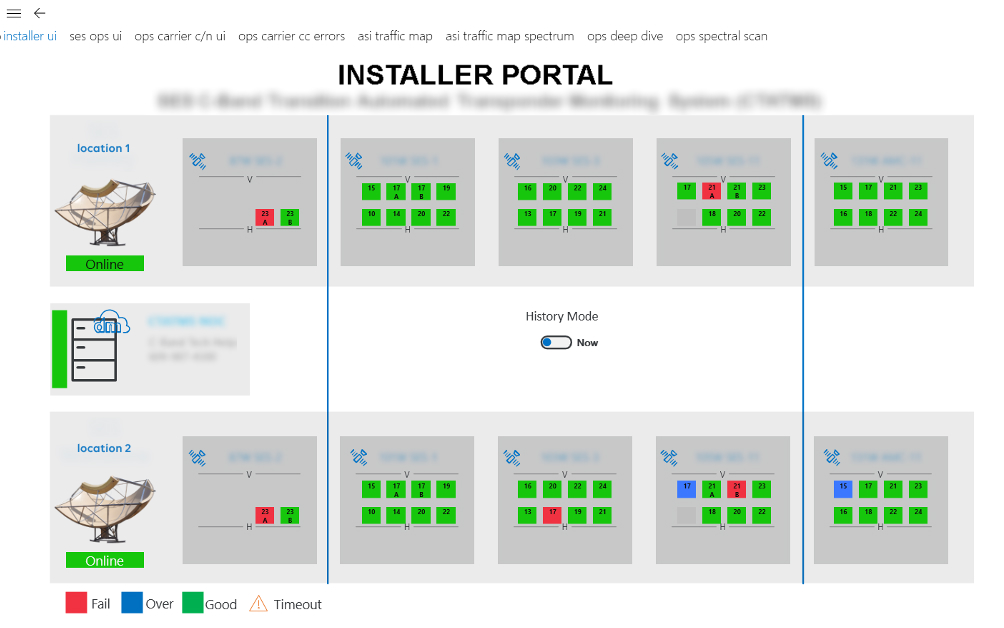 For the Installers team, there is a dedicated section where they can compare the metrics, such as C/N readings, prior to any change and after installing the required filters to verify if no new issues have been introduced.
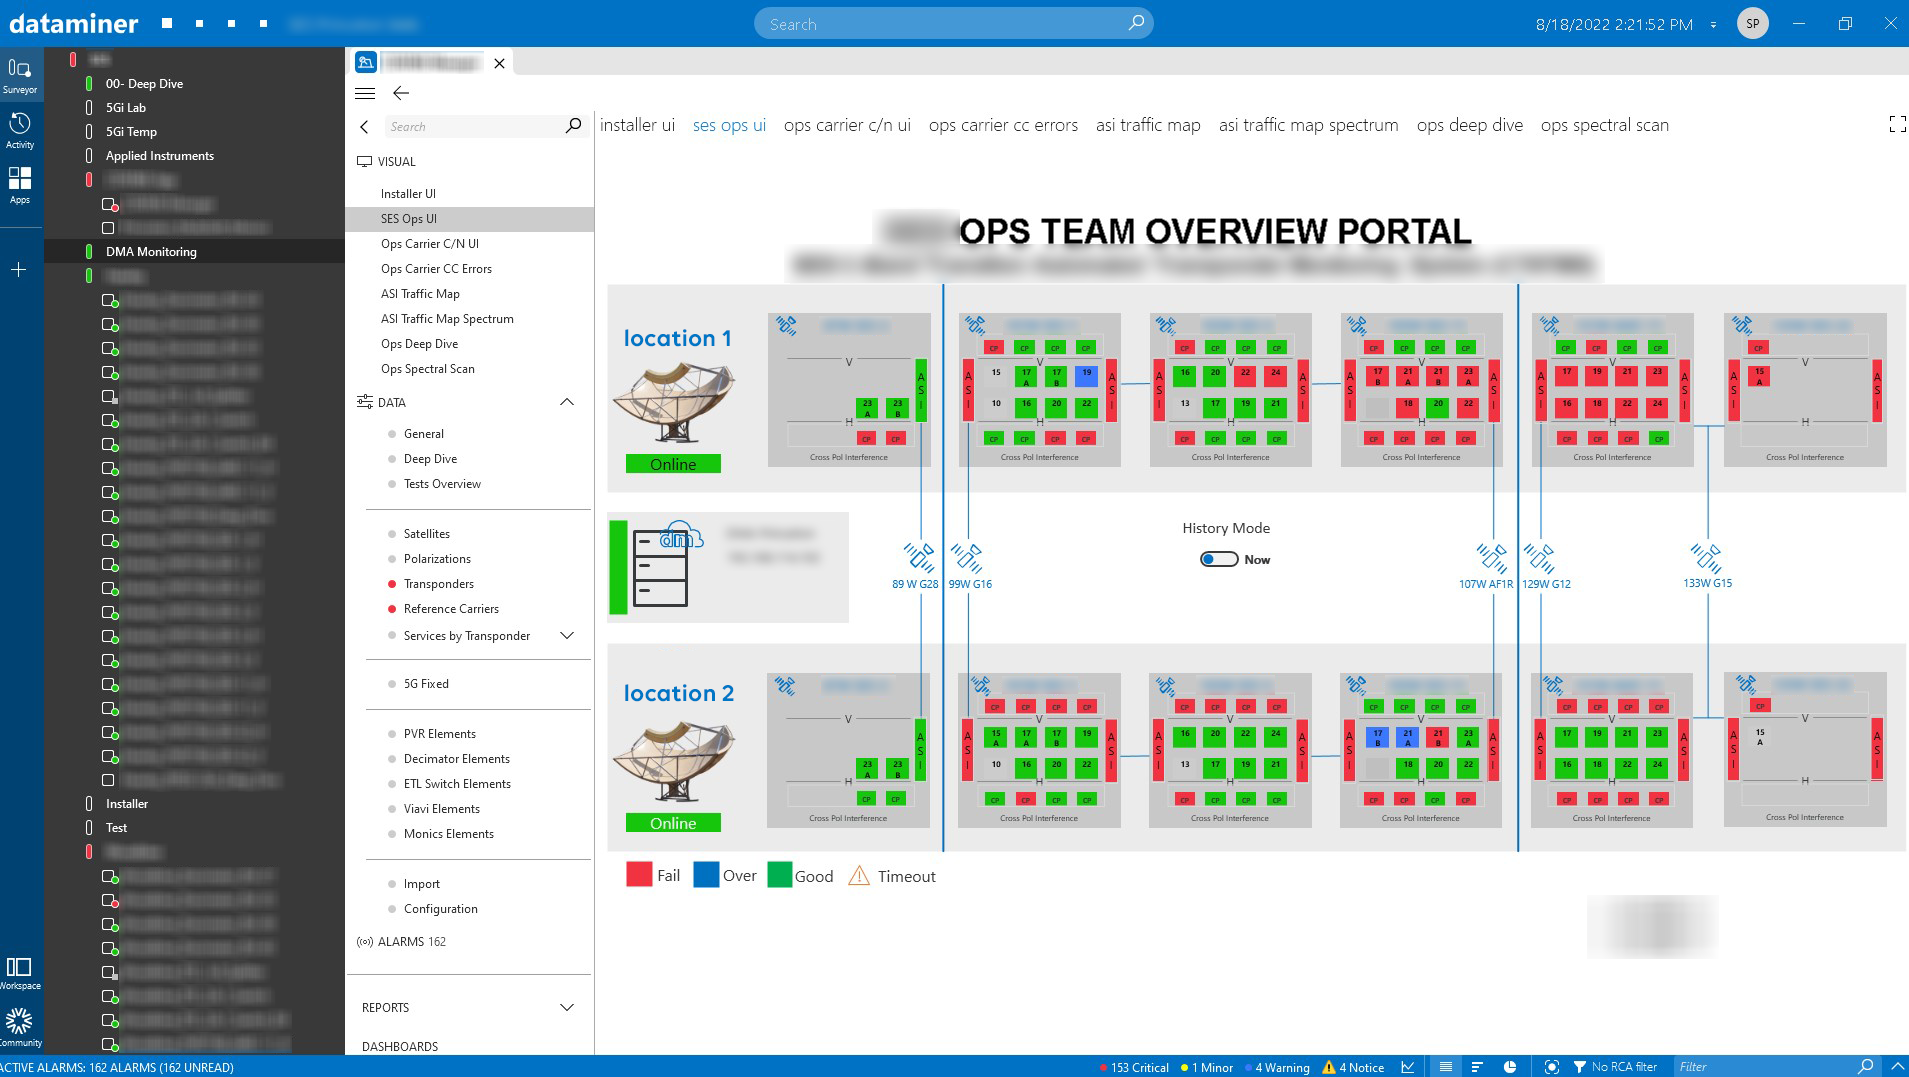
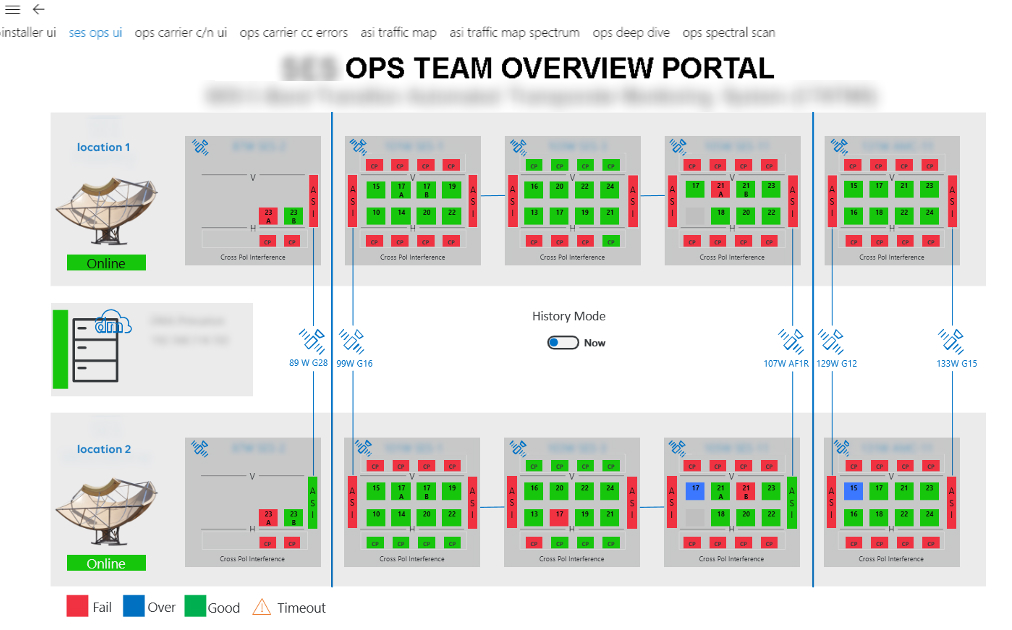 The Operations team has the same view with additional metrics identifying ASI (Adjacent Satellite Interference) and CPI (Cross-Poll Interference) readings based on transponder signal power correlation.
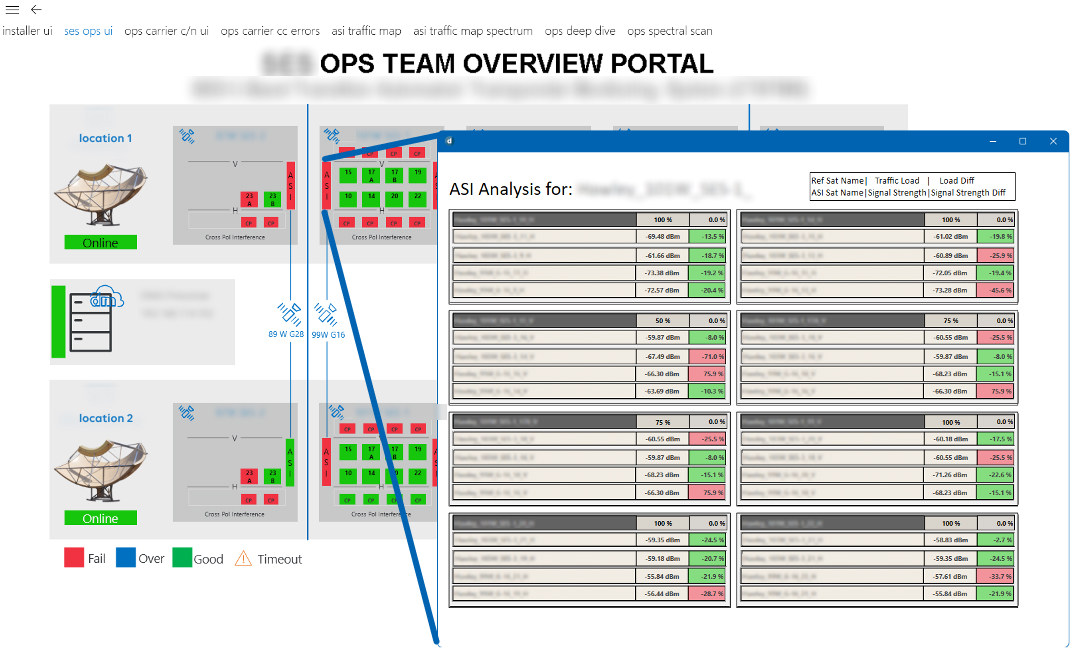 The Operations team has an easy-to-ready interface that maps all transponders in each satellite. You can for instance see the interference from adjacent transponders (ASI analysis).
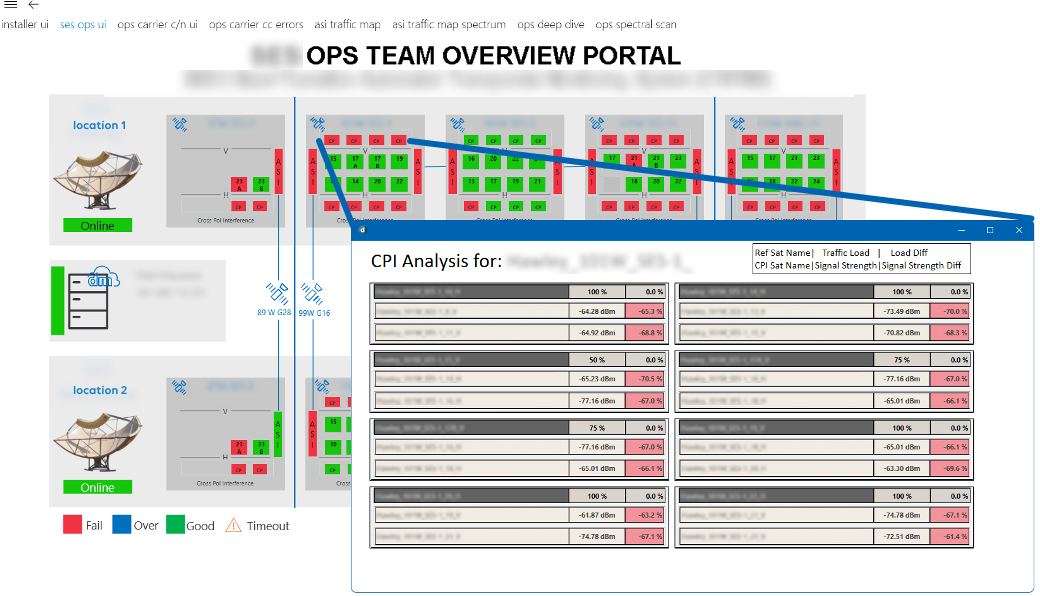 The transponder mapping view of each satellite also shows and alerts operators of CPI (Cross-Poll Interference), so they can easily identify issues and use the deep details for CPI analysis.
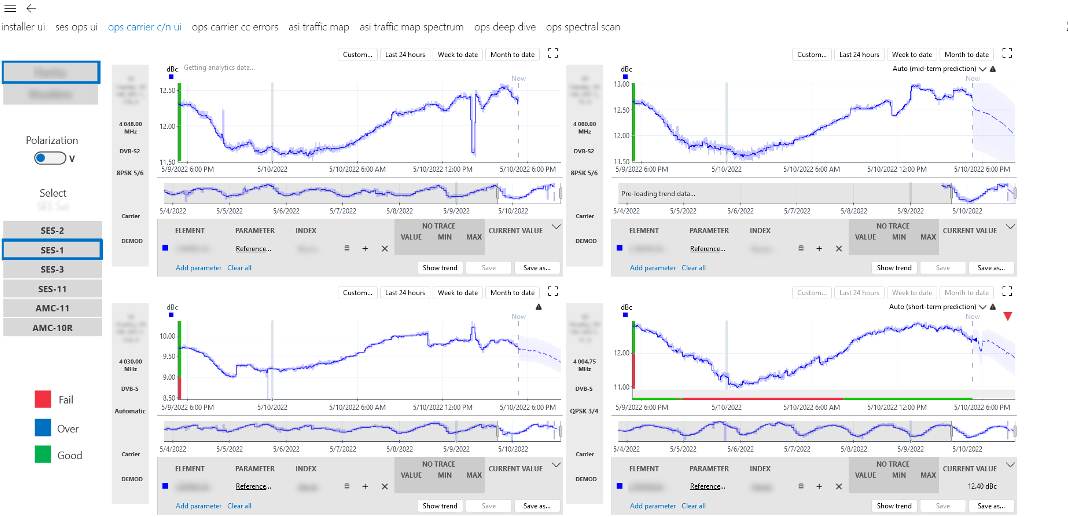 Additional pages are available for the Engineering and Operations teams to track the performance of the metrics over time with visible thresholds, for instance to monitor and track Carrier to Noise (C/N) performance on four different transponders.
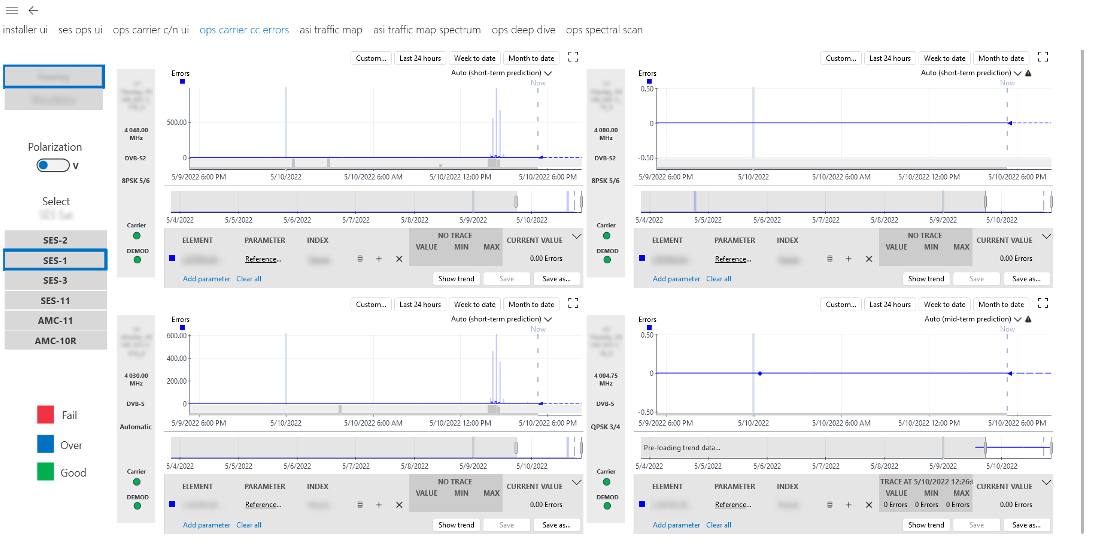 This page allows these teams to monitor and track Continuity Count Errors (CC Errors) performance, which can be used as an indication of feed degradation.
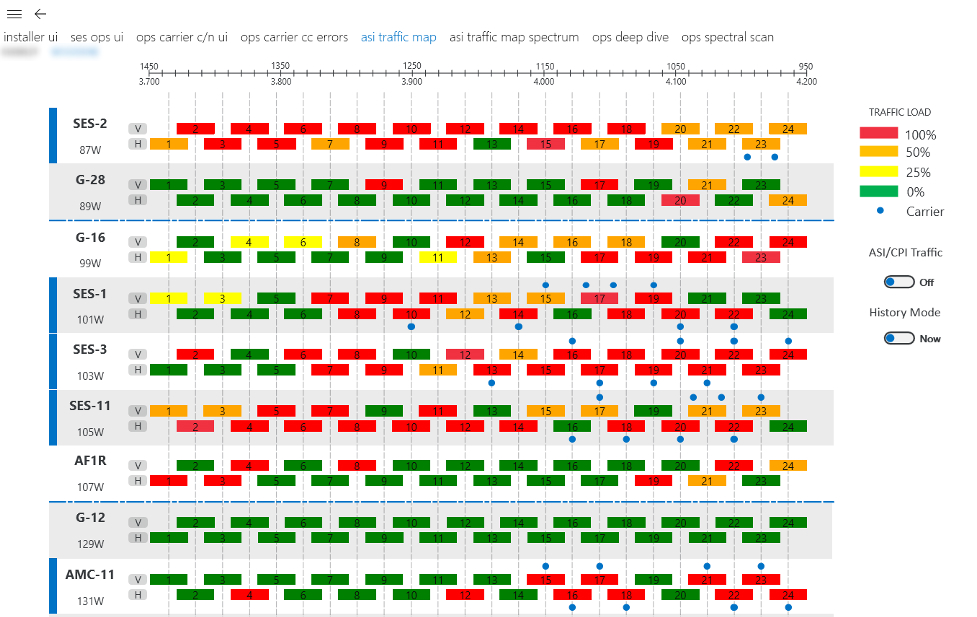 Transponder Traffic Load changes can also be monitored and tracked. This screenshot shows the transponders being transferred from the lower (on the left) to the upper BW (on the right).
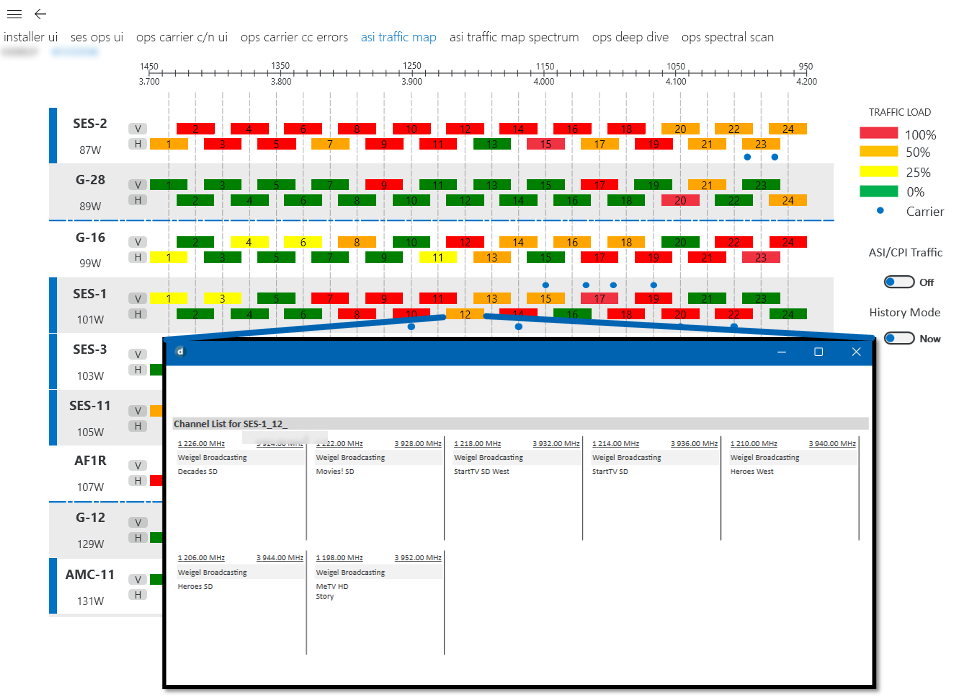 Clicking a transponder shape displays a list of services carried, making it easier for the operator to identify the channels in the transponder without consulting external data.
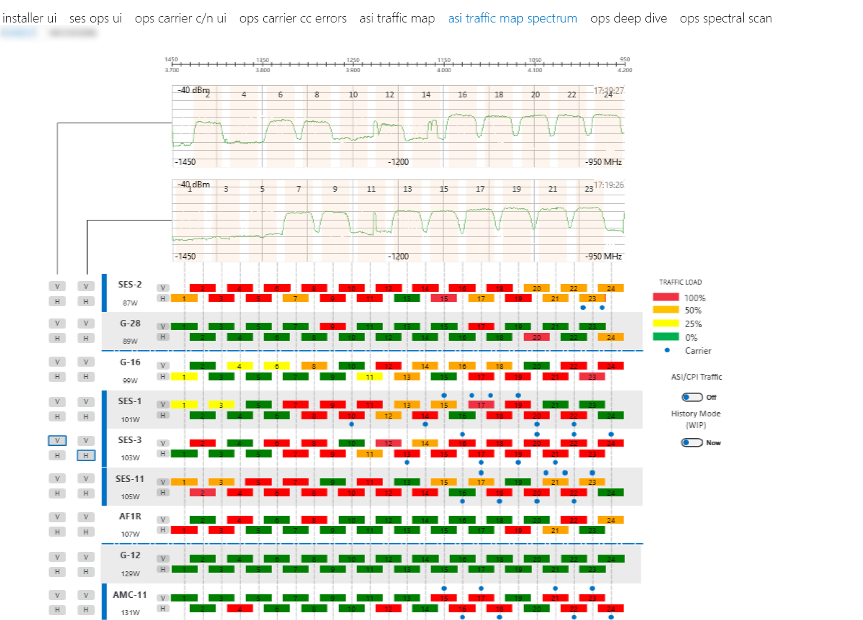 Transponder traffic load changes can be displayed against the current spectrum capture for the selected satellite. This way, operators can compare the real performance, looking at the spectrum display at the top, against the traffic map table from operations, represented by the LEDs.
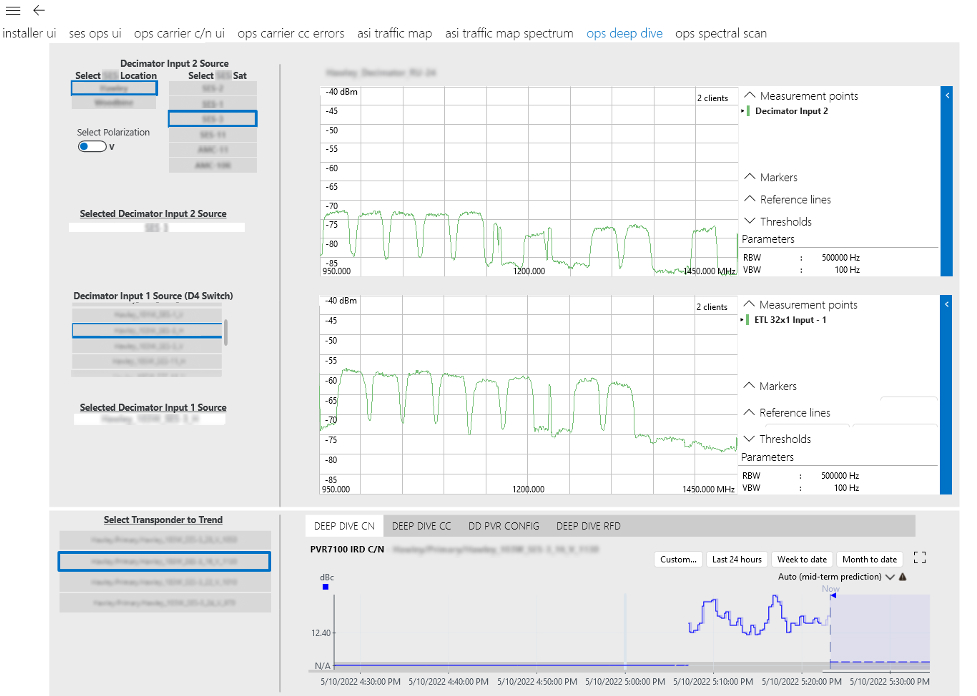 For the Engineering team, there is an interactive deep-dive page. This allows the setup and control of a separate set of equipment for the full-time monitoring user, which allows for interactive deeper analysis when needed.
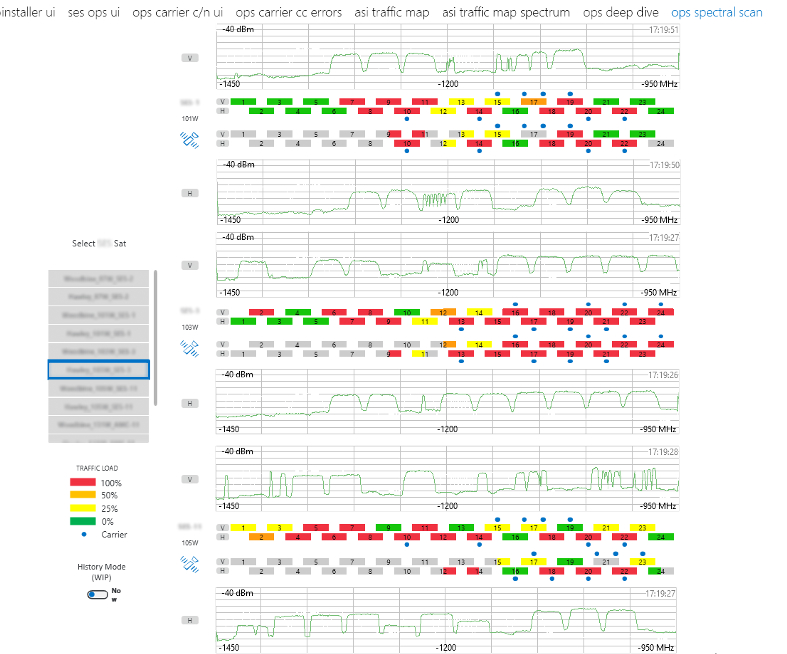 The Operations Team also has access to a Spectral Scan page, which displays a simultaneous trace across adjacent satellites to help visualize any interference that may be present.
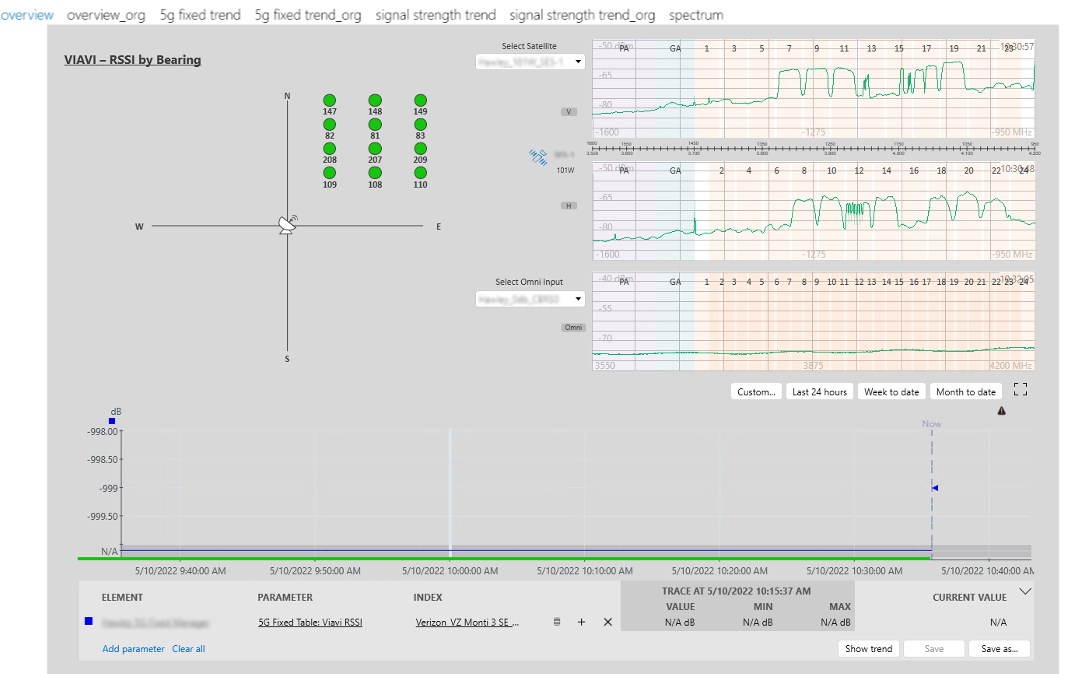 The main page for the 5G interference monitoring provides a summary view of the analysis. The displayed RSSI reading is correlated to the location of the antenna. Selecting a PCI value will populate the trend graph at the bottom of the page. Spectrum traces for both Satellite and Omni Antenna inputs are shown. The easy correlation among different data sources makes it easy to identify interference.
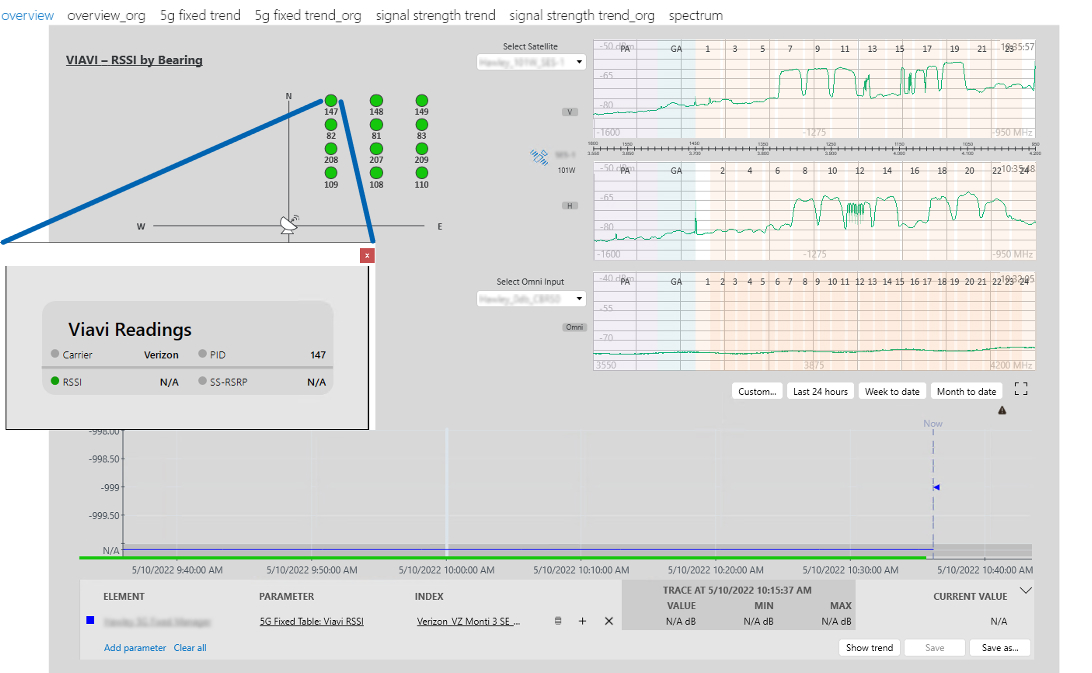 Clicking on the PCI number will display the specifics for that PCI data point.
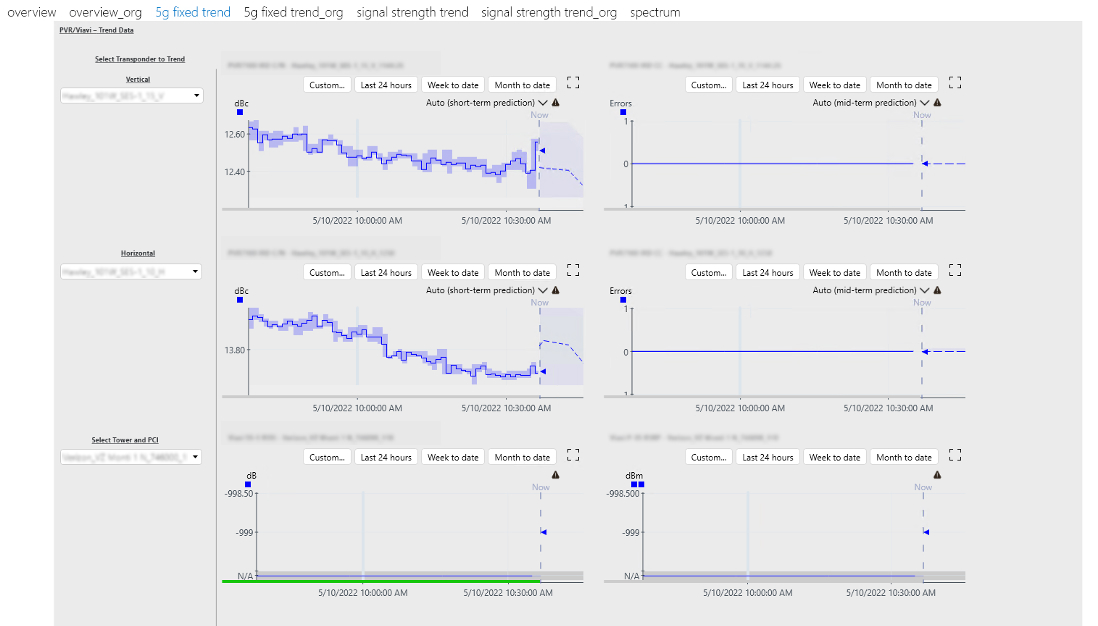 Additional pages show trending for C/N (Carrier to Noise), CC (Continuity Count), and RSSI (Received Signal Strength Indicator) readings for user-selectable inputs.
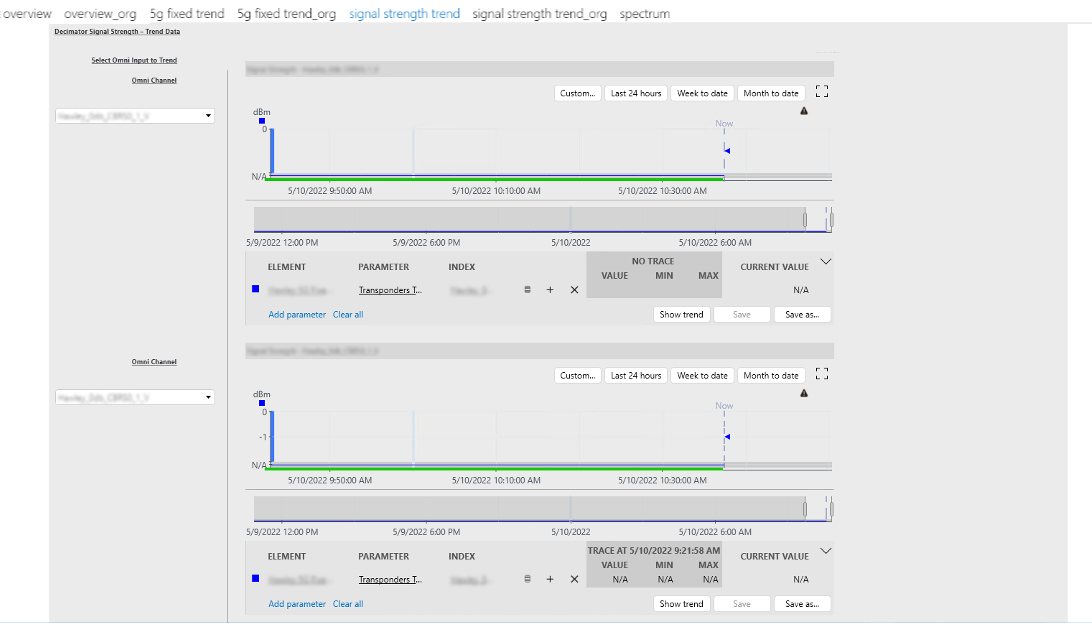 You can also check a signal strength comparison for different Omni Antenna inputs with different padding levels.
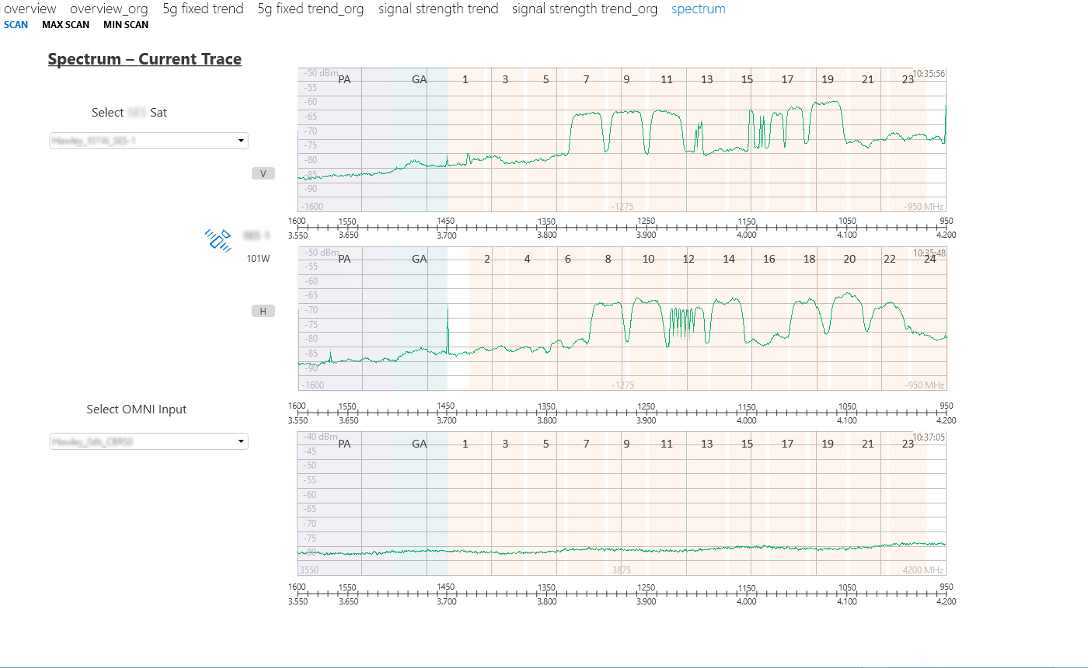 You can view spectrum trace data for Satellite and Omni Antenna inputs at the same time, so you can easily compare different points of the system. You can choose between current scan, max scan, and min scan. In this case, the current scan spectrum trace data is shown.
 Here the max scan spectrum trace data is shown.
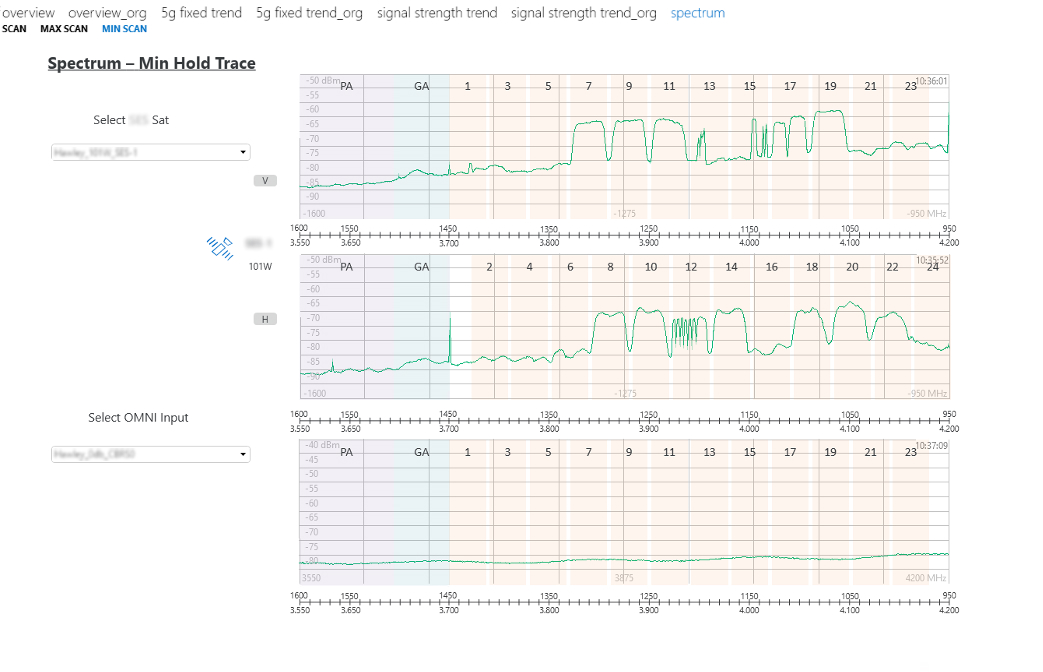 And finally, here the min scan spectrum trace data is shown.
1 thought on “Spectrum Assurance and Teleport Interference”
Leave a Reply
You must be logged in to post a comment.
WOW, amazing!! Well done!