example Use Case
Technical Infrastructure & Power Management
Apac
Alpha
Atal
Benning
Carel
Circutor
ComAp
Deep Sea Electronics
Eaton
General Electric
Generex
Honeywell
Invertomatic Victrom
Intesis
Lumel
Moxa
Murphy
Priva
Ractivity
Realtime Control
Socomec
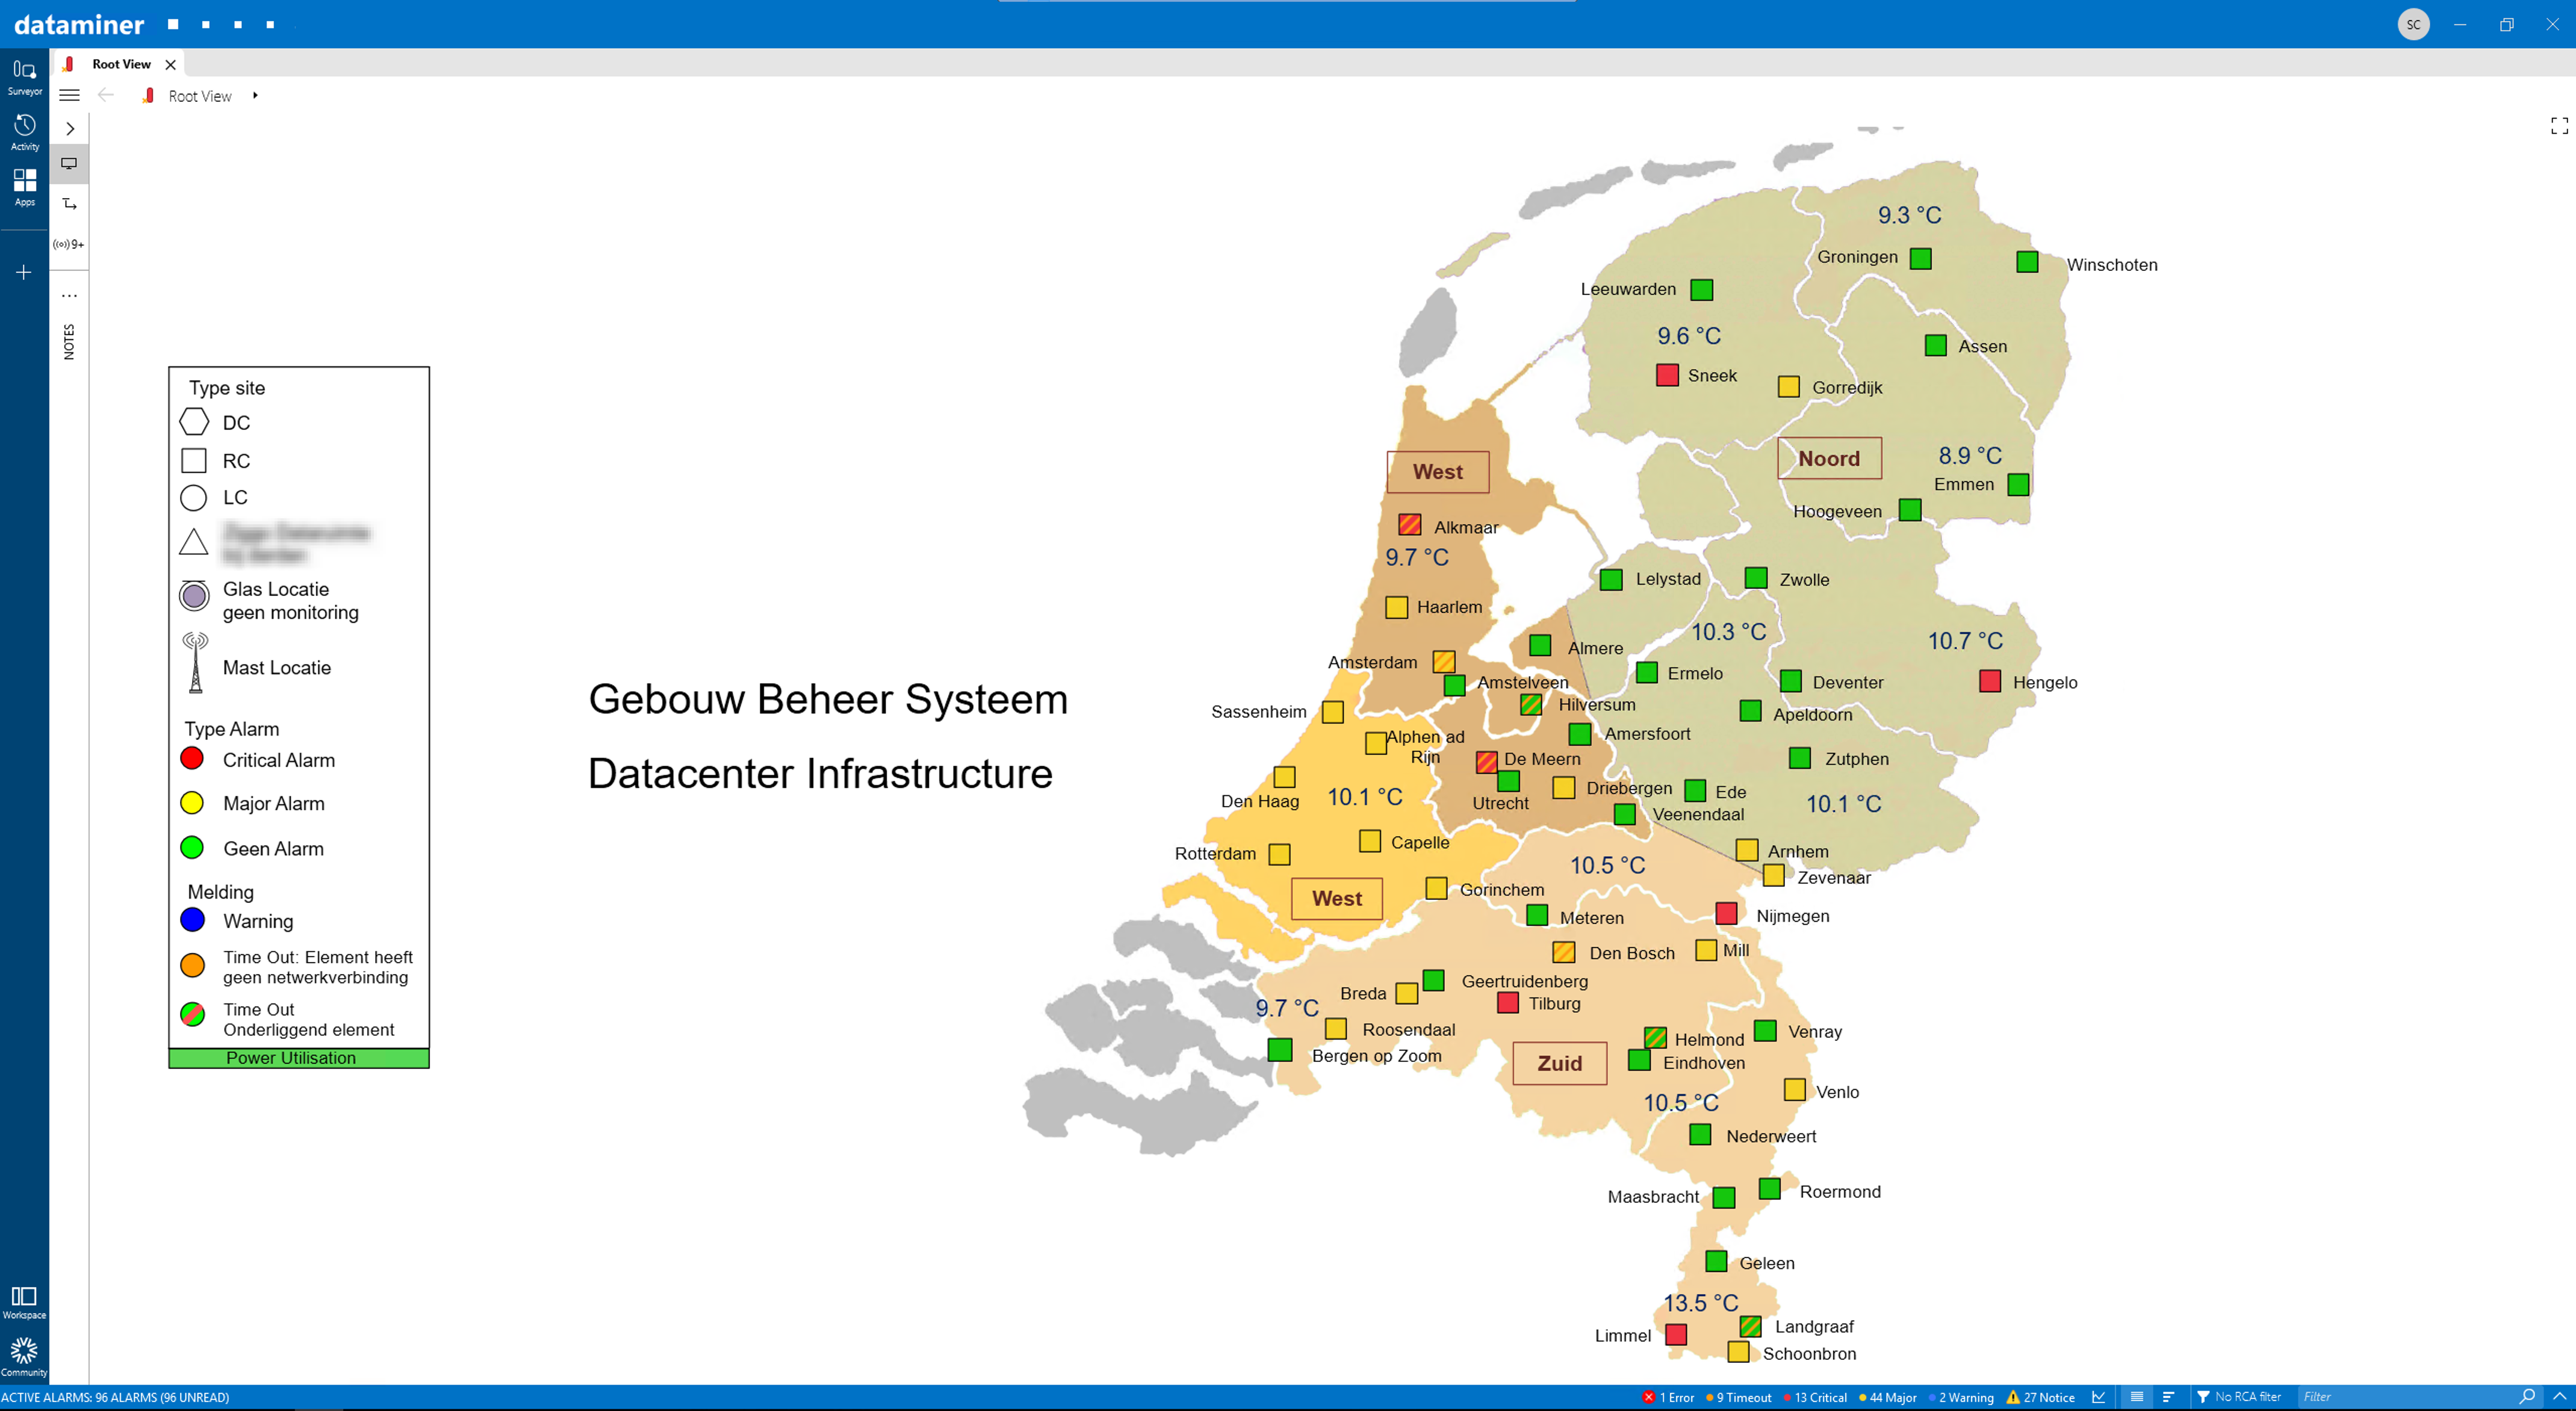
This use case illustrates how DataMiner Visual Overview can be used to dynamically map and monitor infrastructure. In this case, the infrastructure associated with a specific service provider is distributed over more than 900 different locations, ranging from full-size multi-story data centers, over regional distribution centers, to smaller container sizes facilitating subscriber access networks and transformer and electricity distribution sites.
USE CASE DETAILS
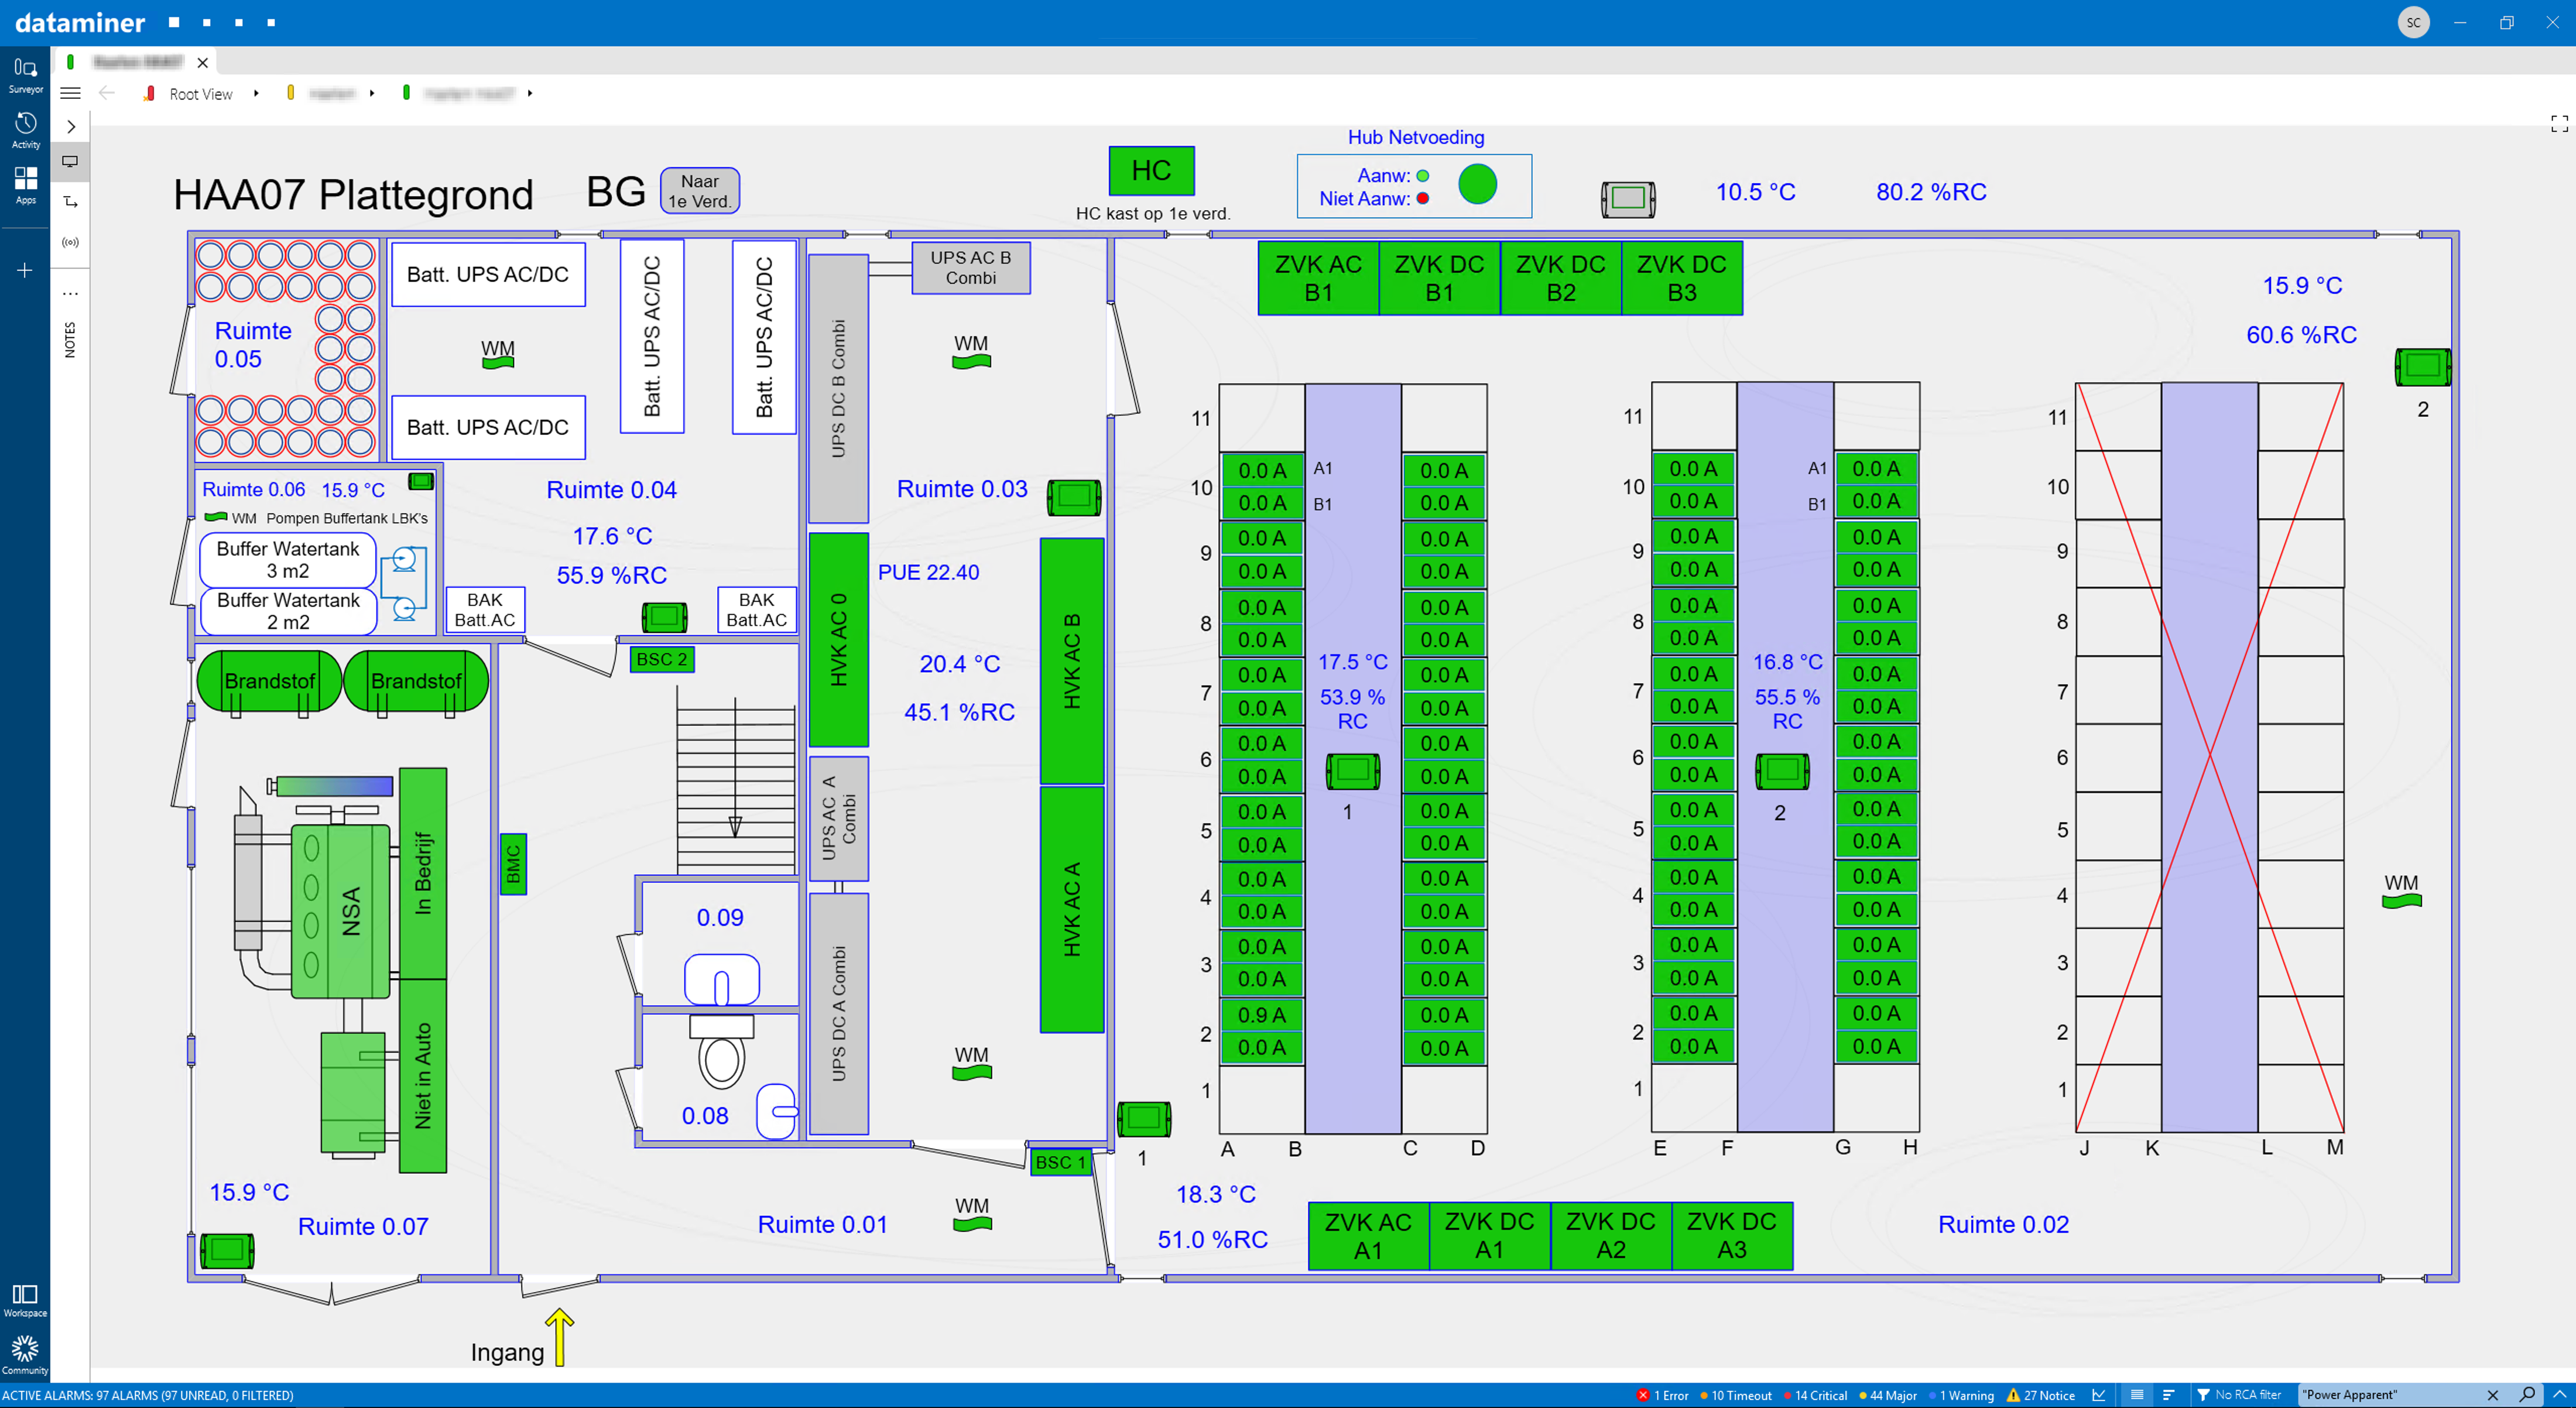 If users drill down from the map to the city overview and from there to a specific location, a full detailed floor plan is shown. In the example here you can see a good overview is provided of what is in scope, including e.g. temperature, humidity, water level, mains power, UPS, backup generator, and aircon. Details for each of the subsystems are accessible directly from the overview. Note also that the current drawn by each of the racks is already displayed here.
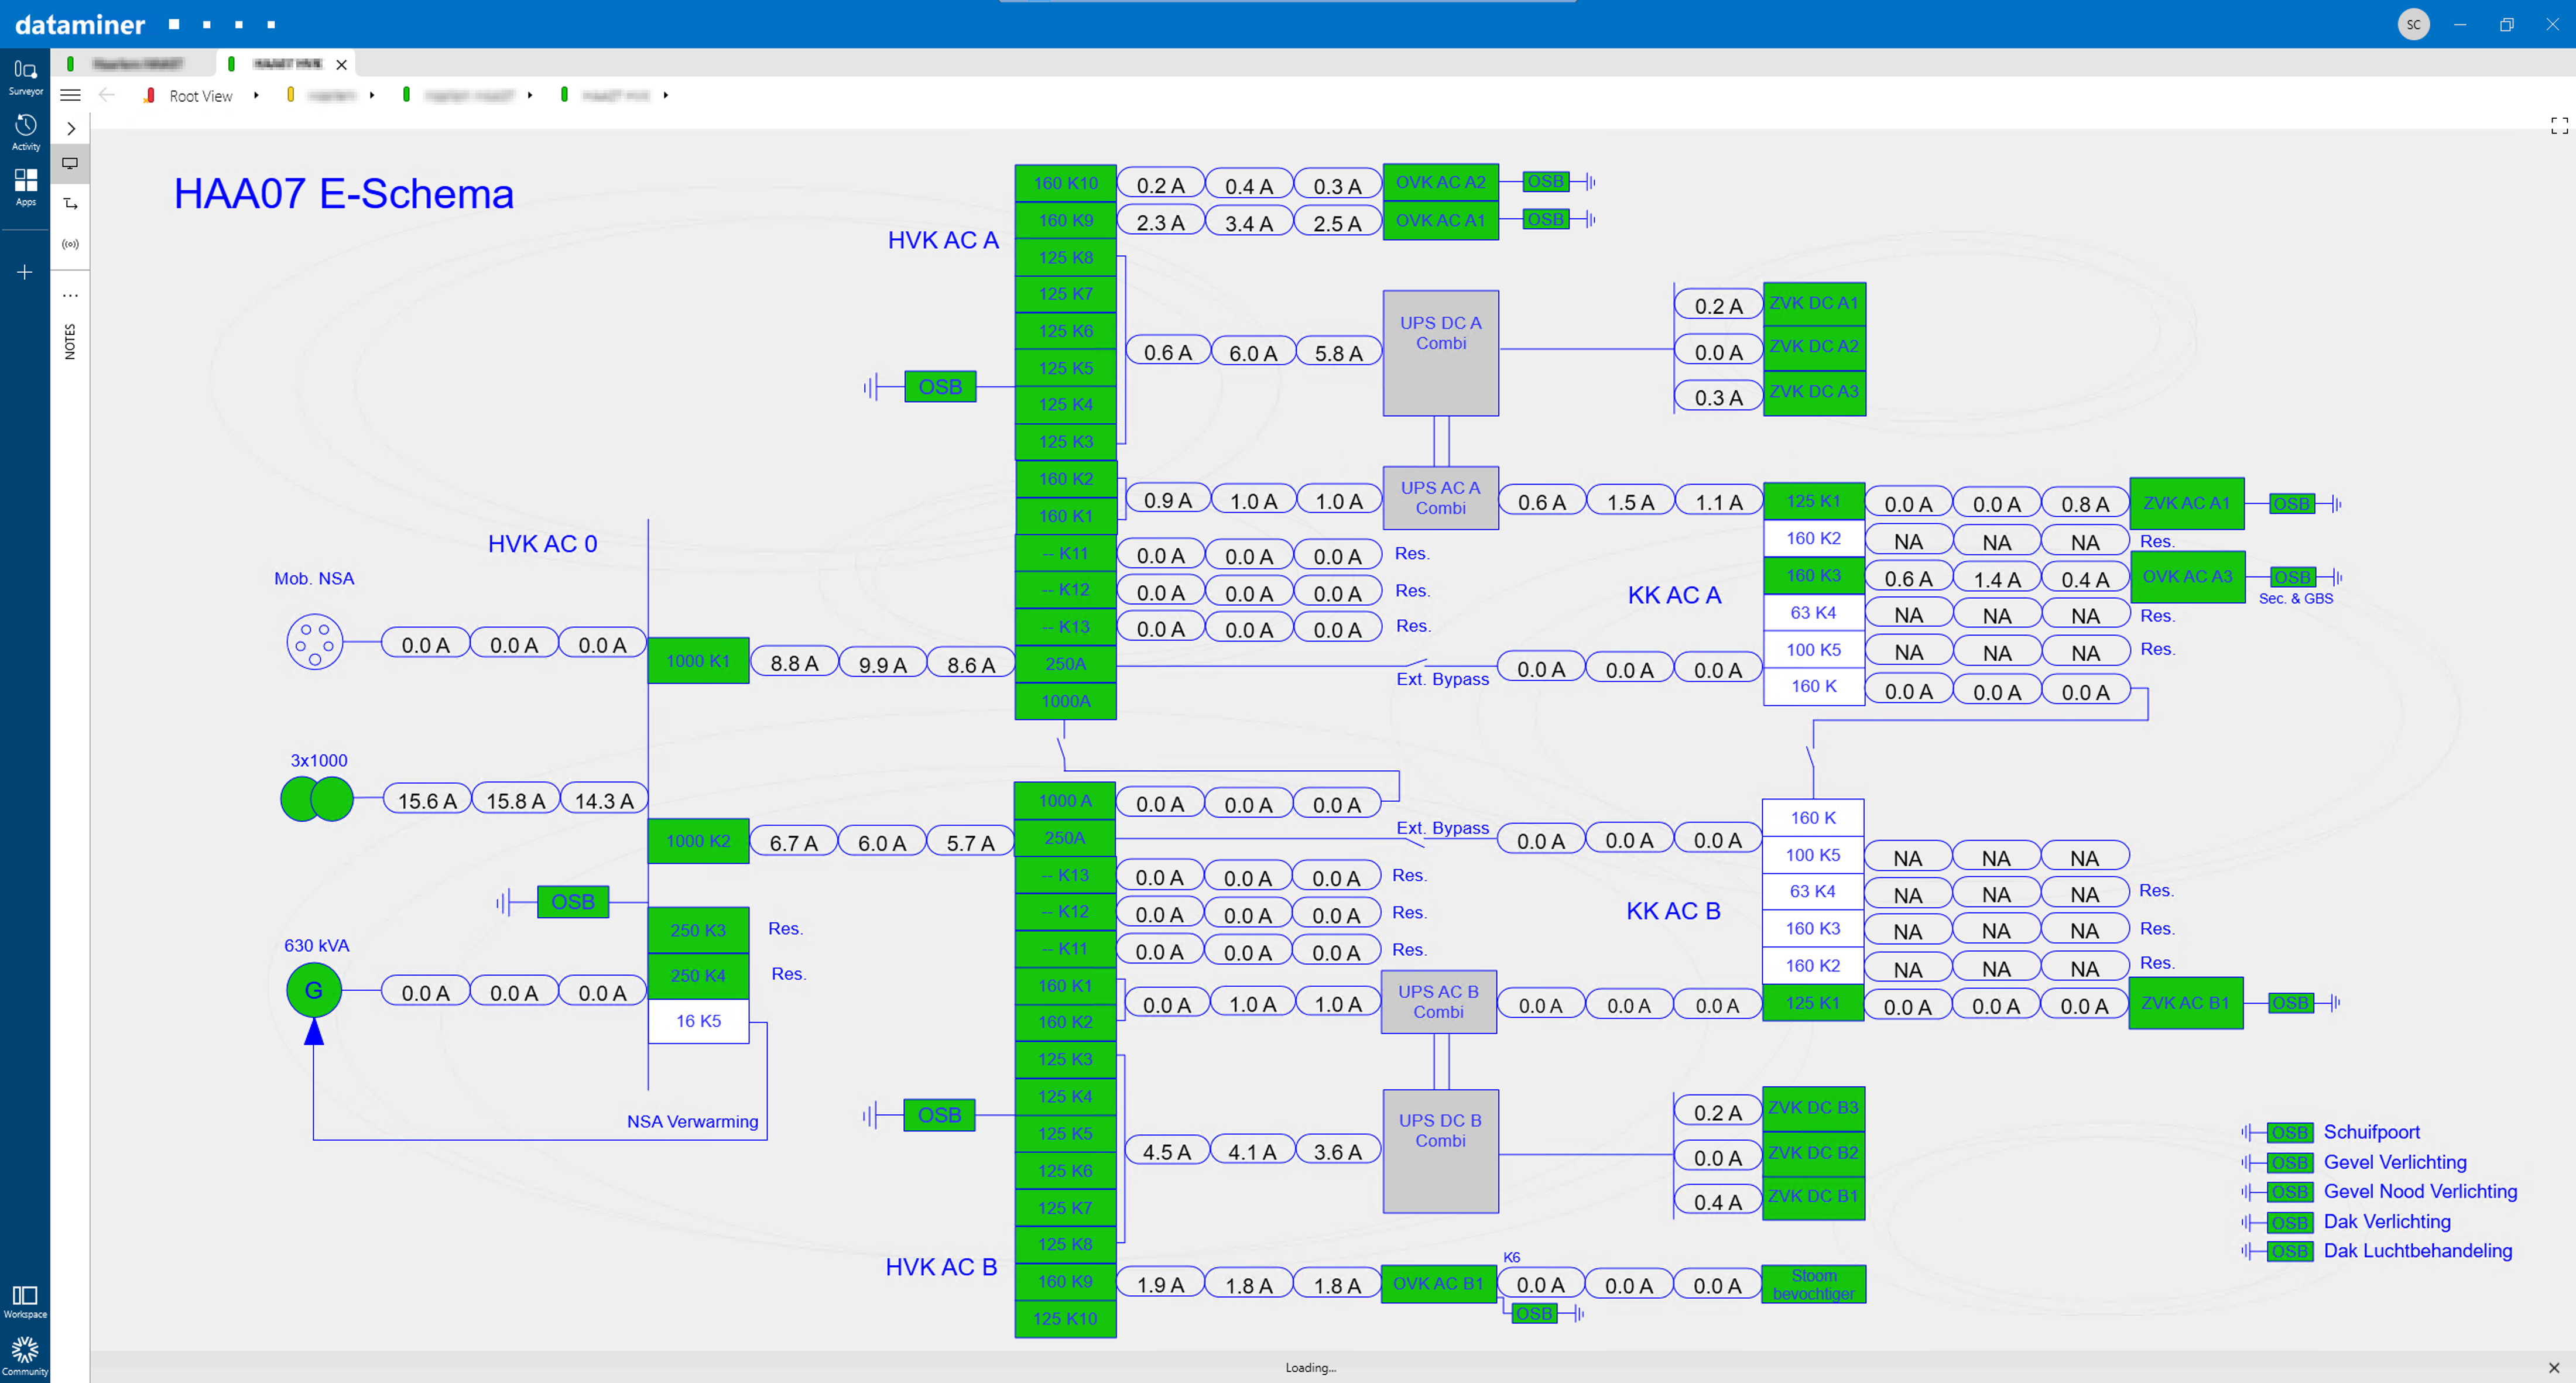 A schematic of the electrical installation provides full details on the interconnection of the different subsystems as well as the current sourced or sunk by each of the these.
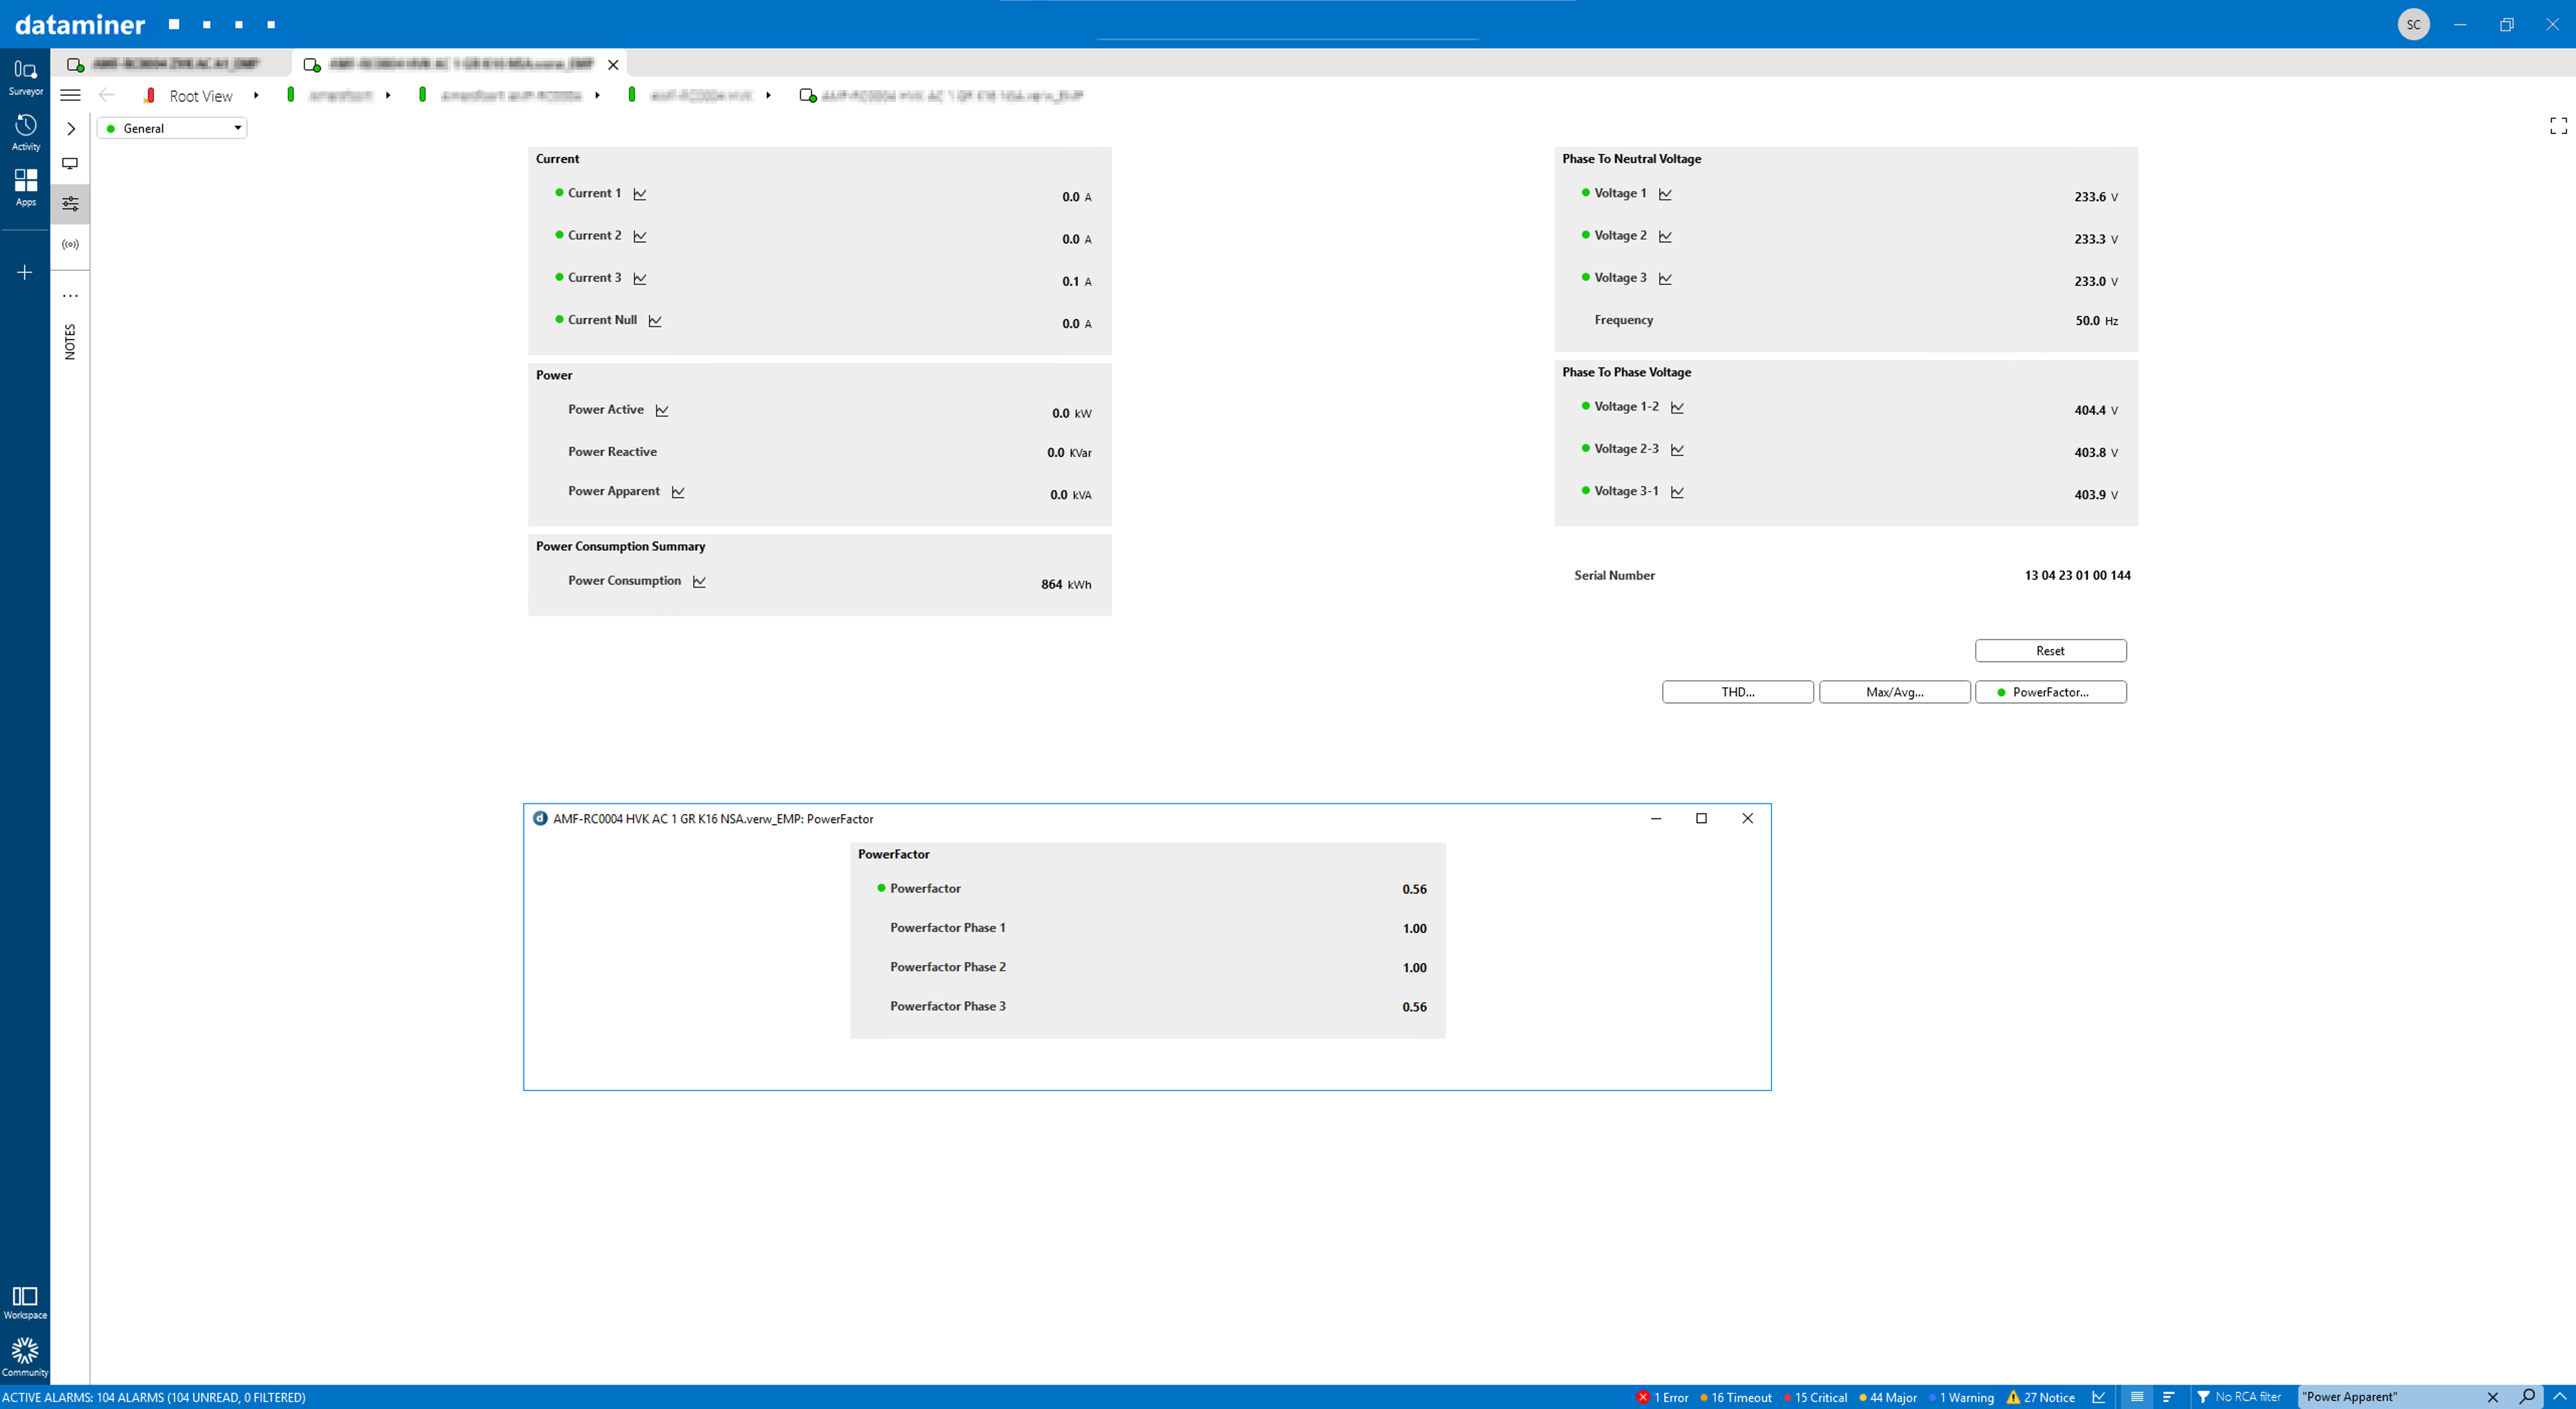 For all power lines (main, backup, and generator) full details are accessible on the voltage, current, power consumption, and power factor, as well as the harmonic distortion.
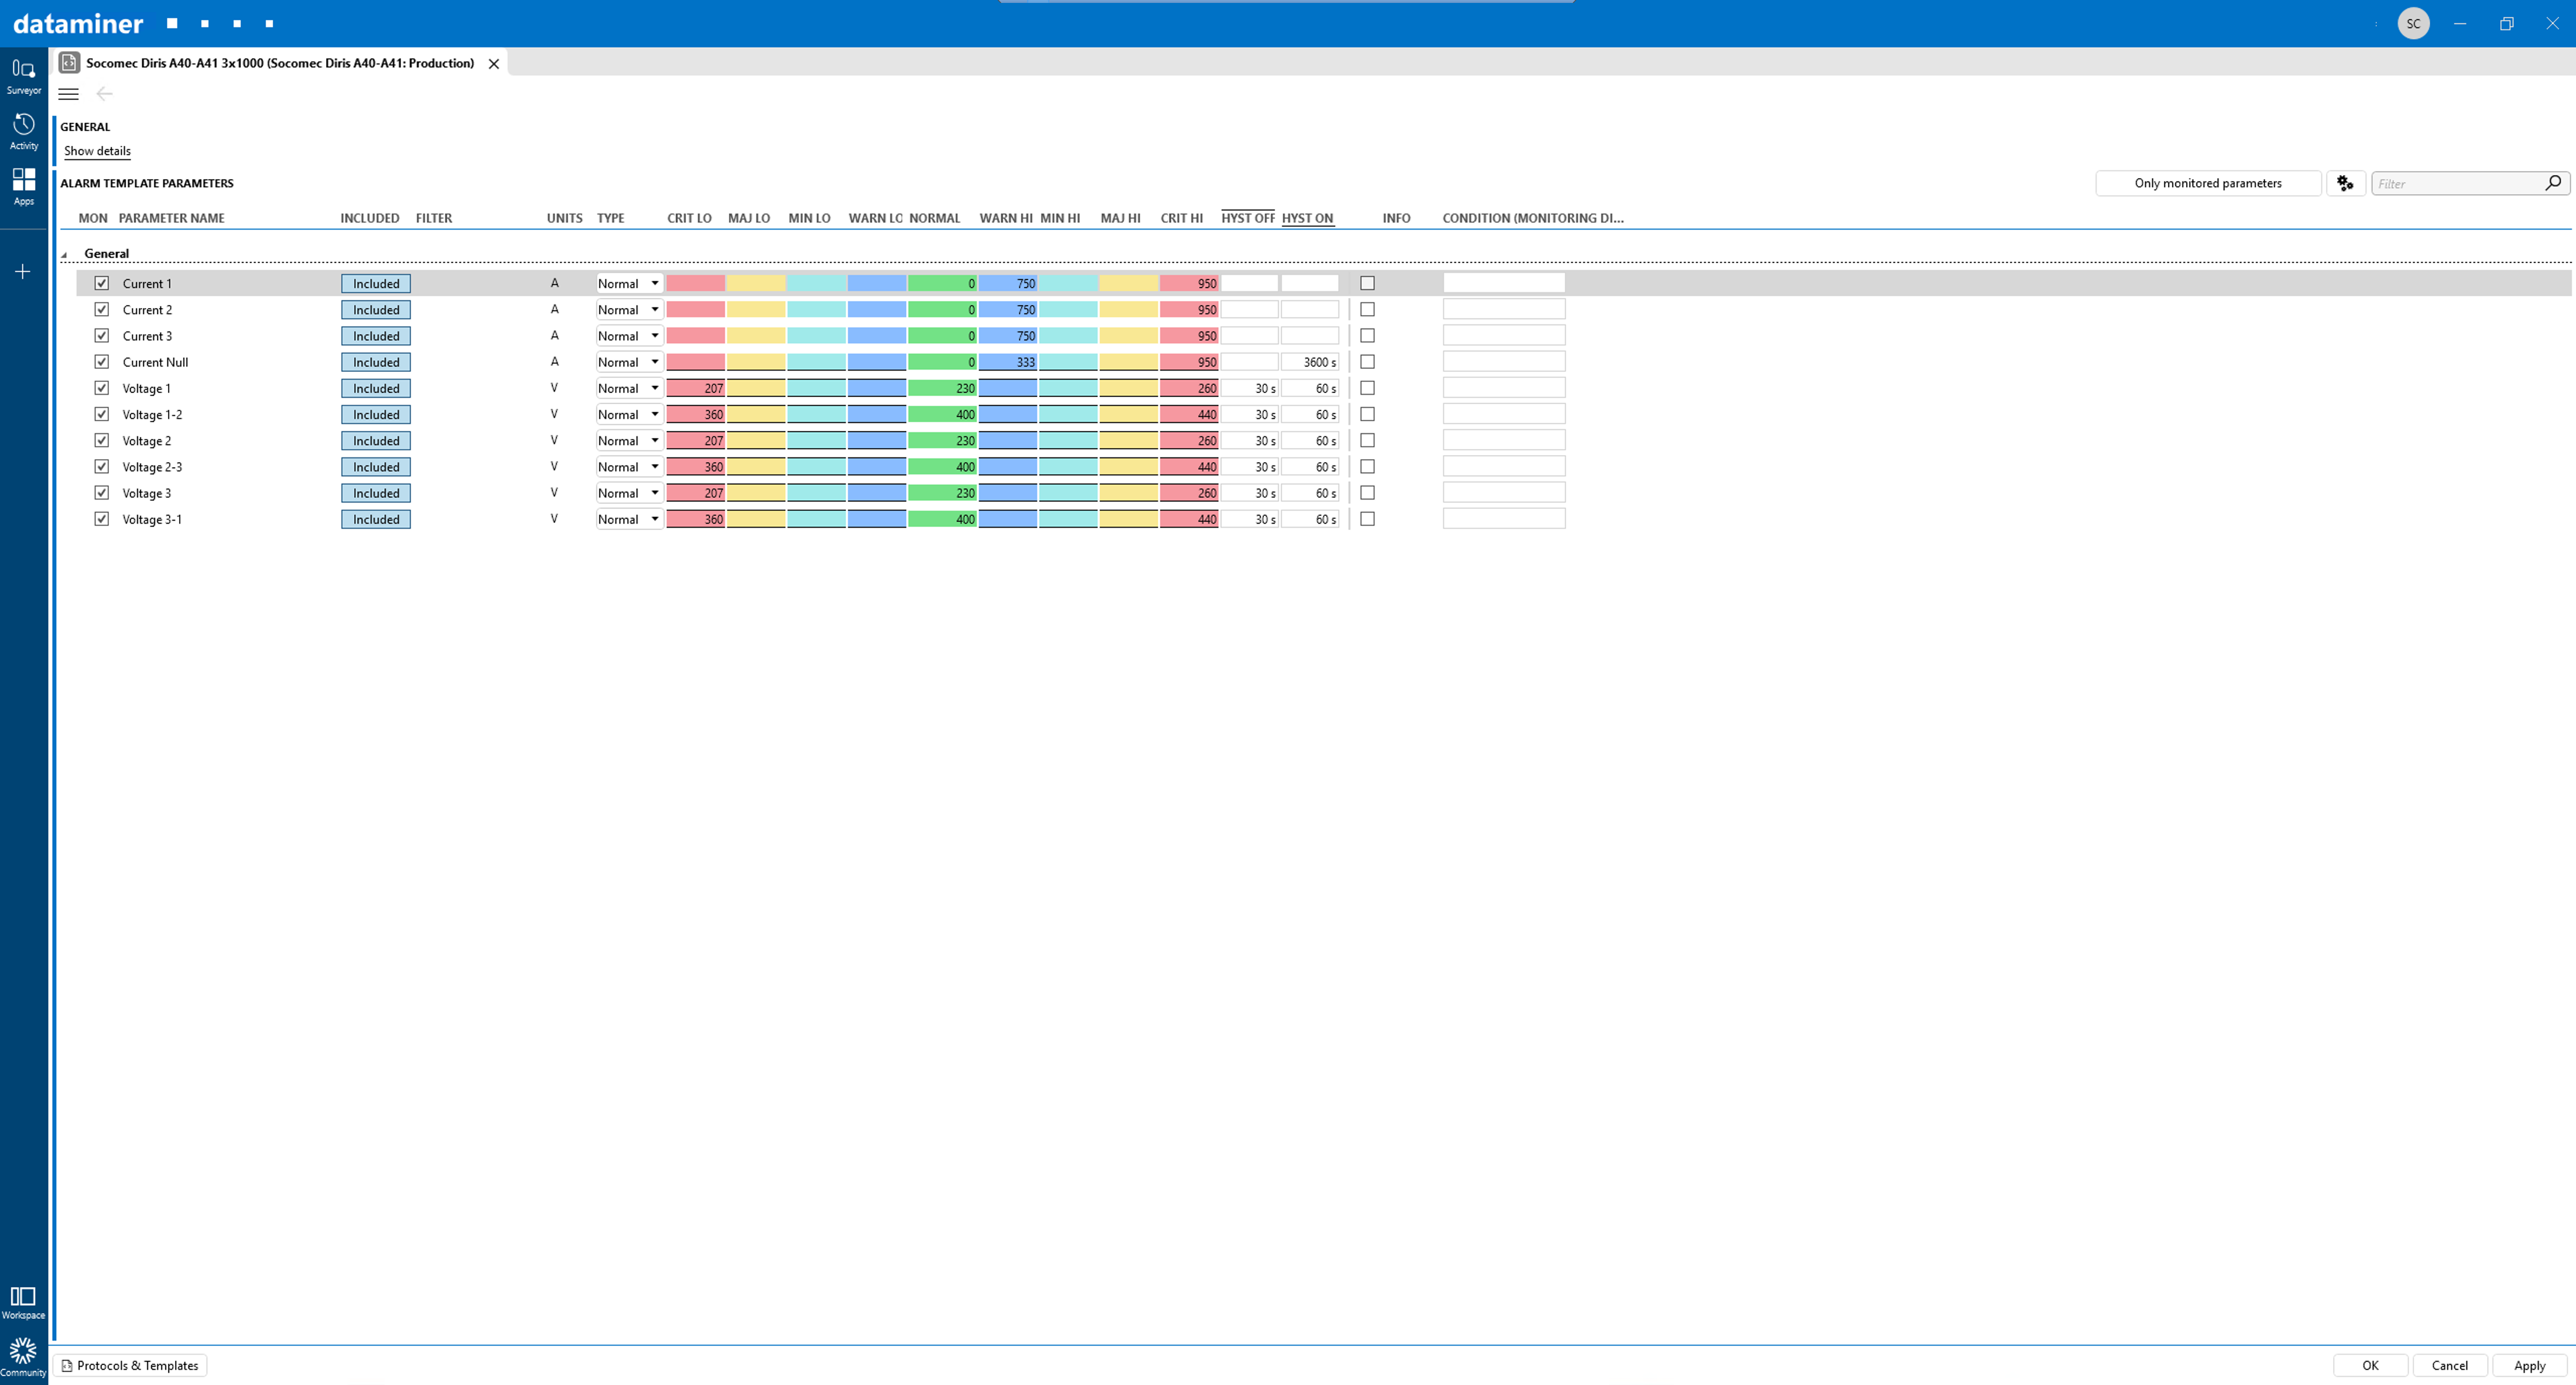 Alarm templates determine which KPI values will trigger an alarm condition. Hysteresis or other conditions will be taken into account as well.
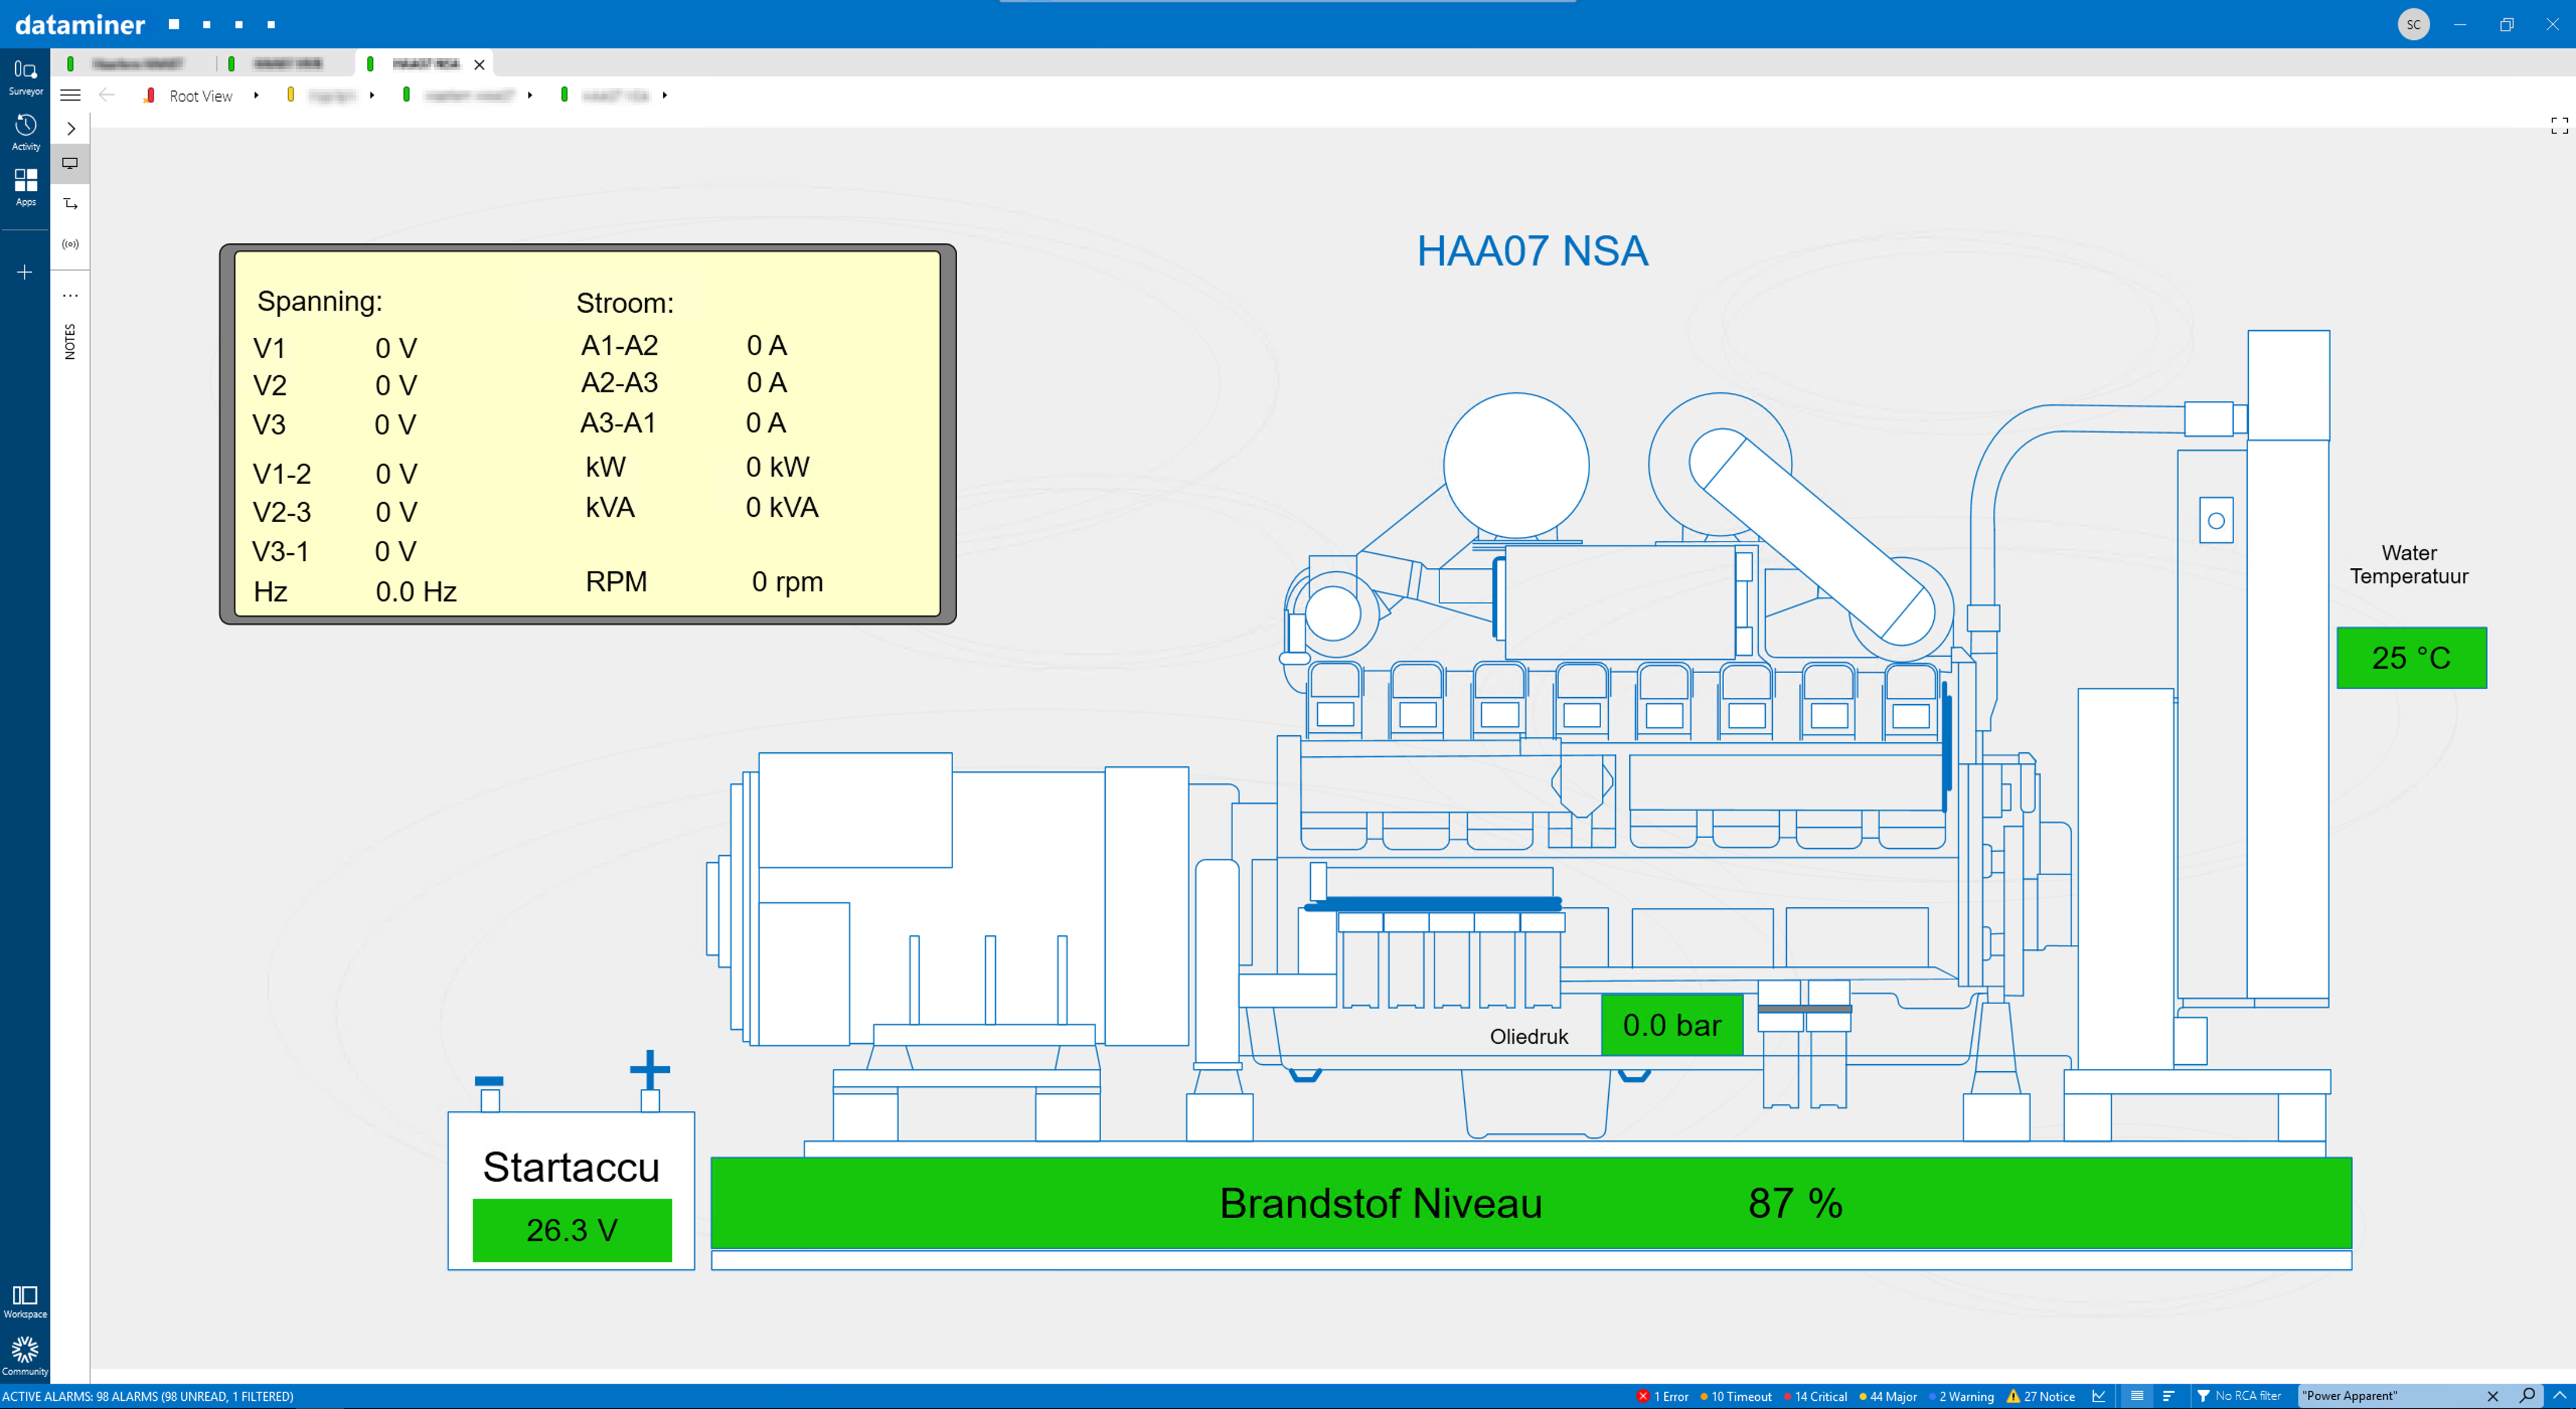 For sites that have an emergency power group on site, the operator can also navigate to a fully detailed overview of this subsystem. Coverage for this typically includes the voltage of the battery, fuel, temperature, RPM and oil pressure for the engine, as well as frequency, voltage, current, and power for the generator.
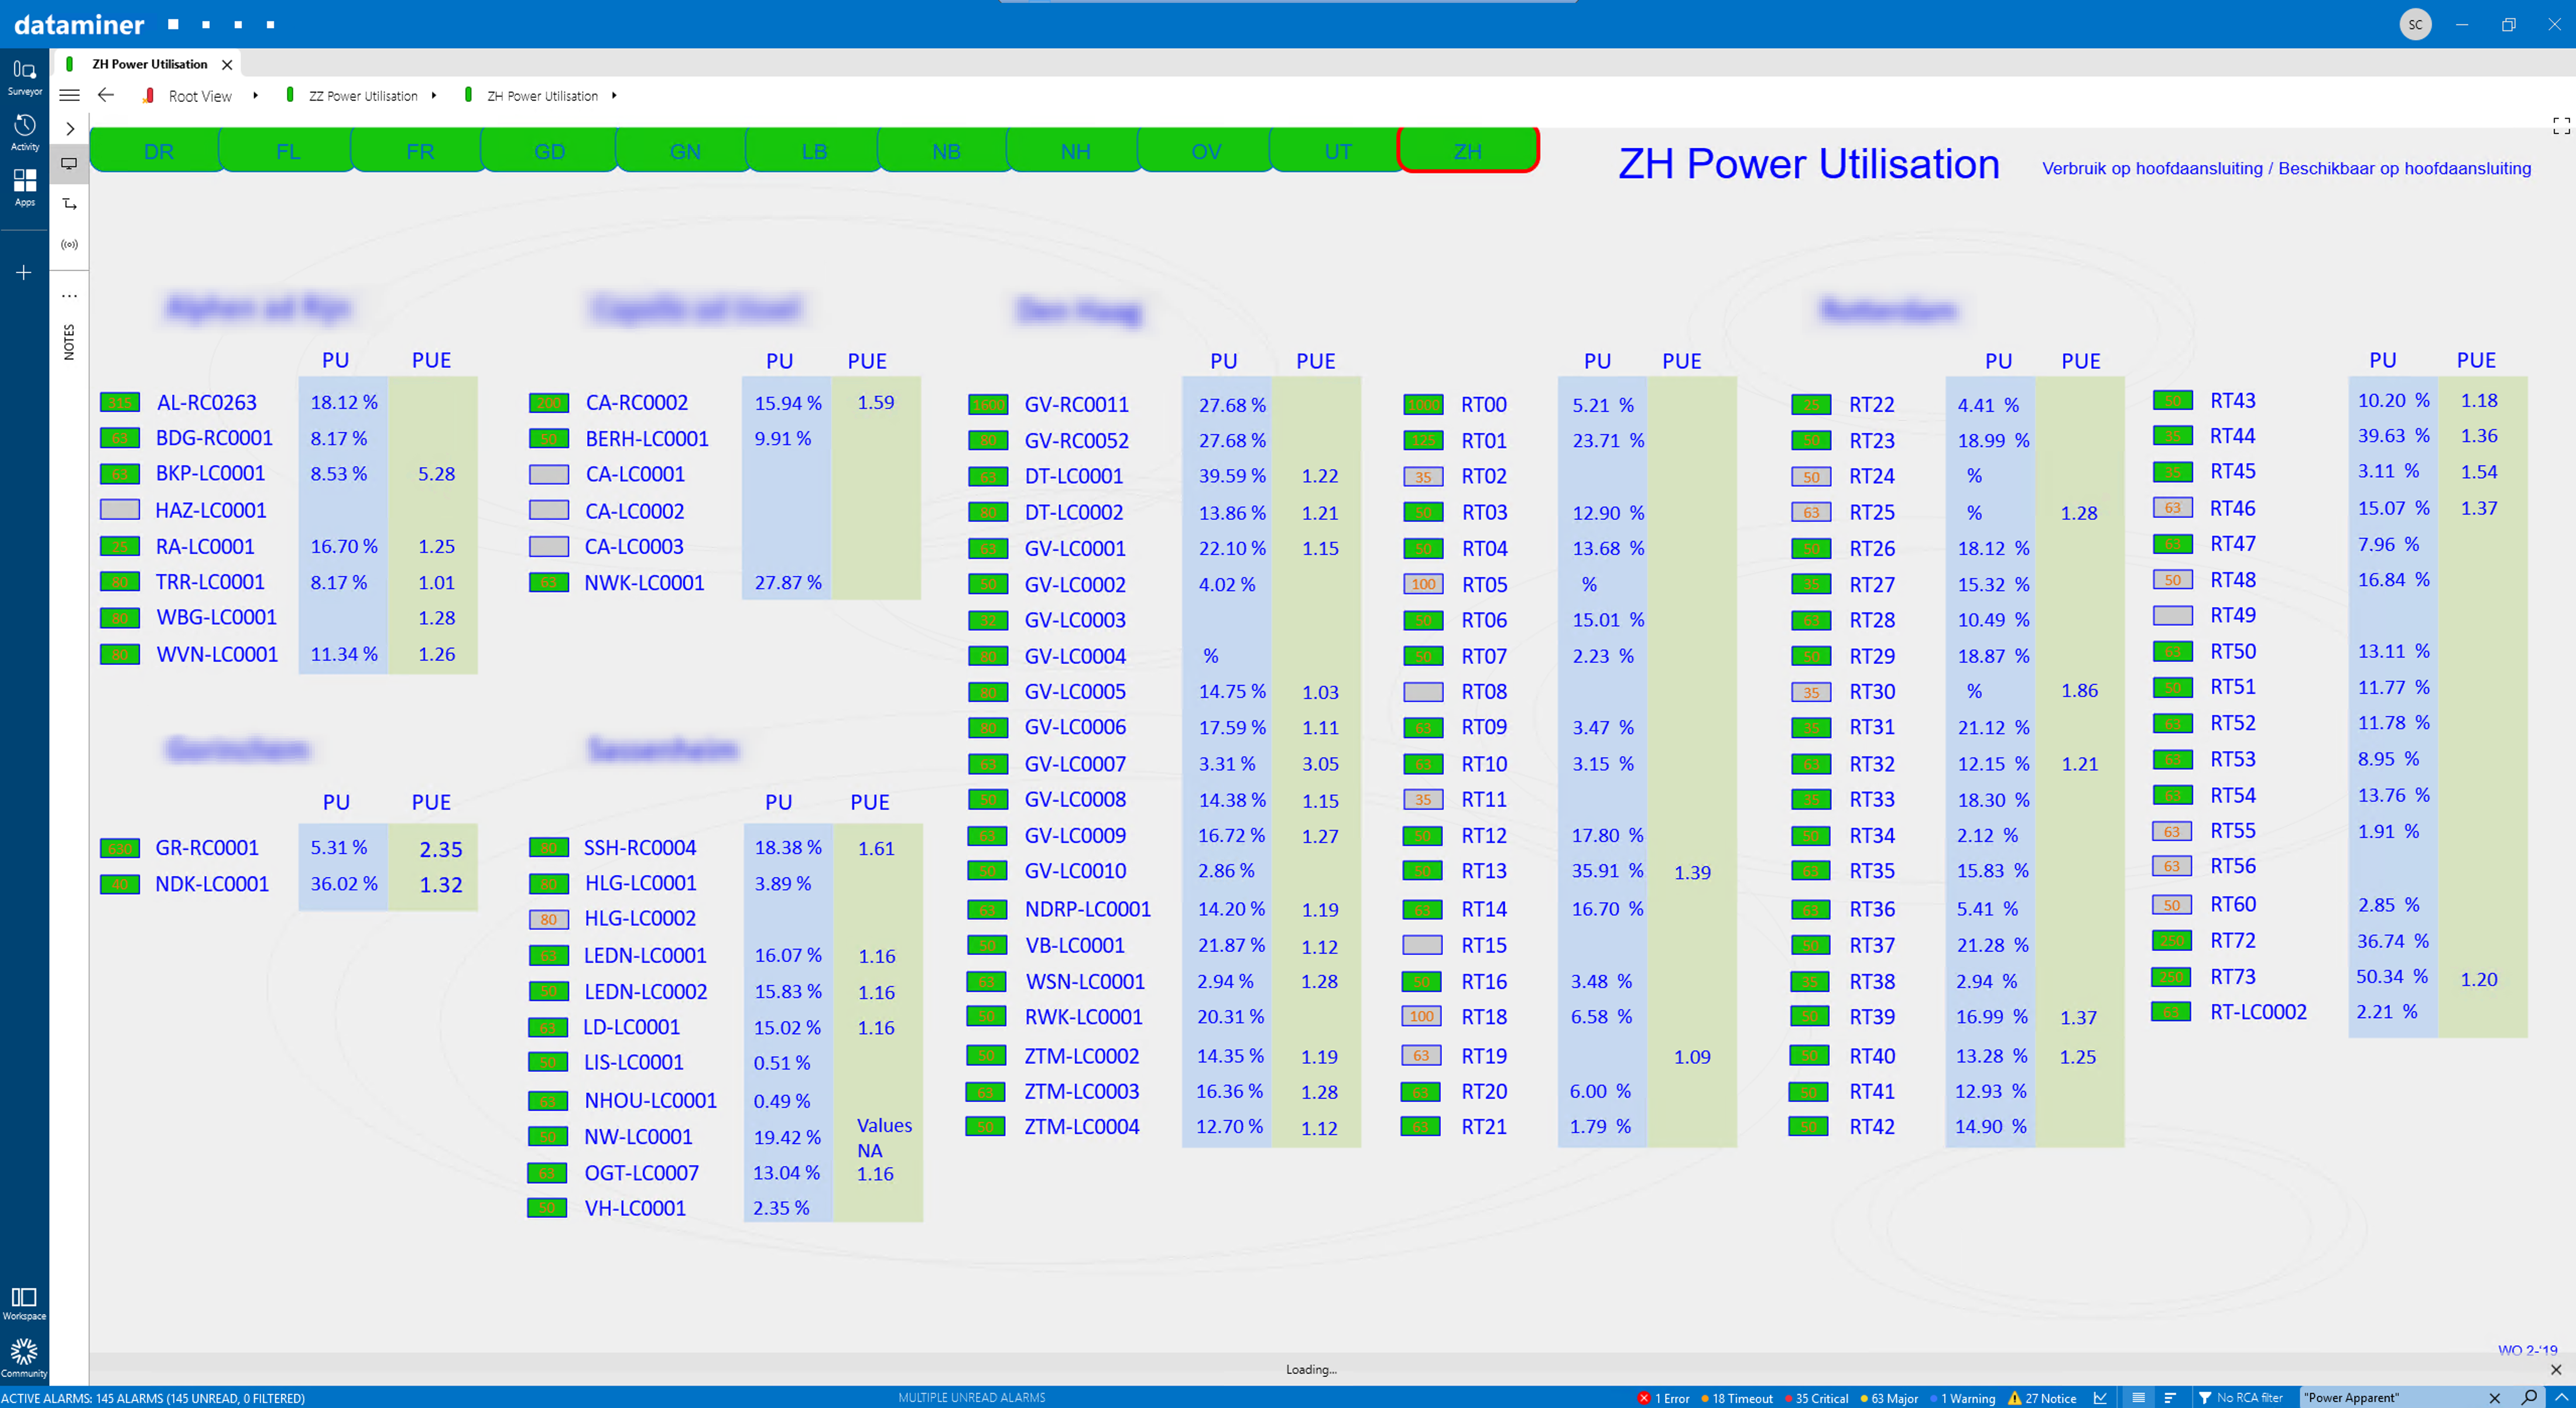 Next to the site details that can be accessed by navigating to a specific site using the maps or Surveyor, from the root visual overview you can also access power utilization overviews for each of the locations. Sorted per city, the actual power consumption is shown, as well as the relative load this represents compared to the maximum power available, and the power usage efficiency (PUE) for every site.
1 thought on “Technical Infrastructure & Power Management”
Leave a Reply
You must be logged in to post a comment.
Very interesting application of Dataminer.