example Use Case
Monitoring QoS of Live OTT Streaming
We can monitor Quality of Service metrics of live OTT streams across geographic regions through DataMiner’s Telestream Live ABR Monitoring integration. In this example, we used the node-edge visualization component, which comes out-of-the box in the DataMiner Dashboards module, to give a quick overview of the QoS state of the active streams in the different regions.
USE CASE DETAILS
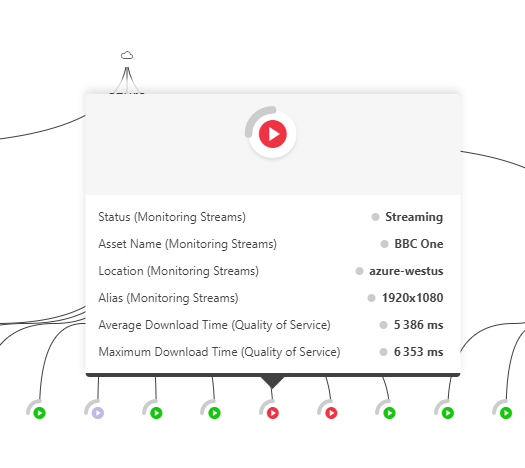 Each monitored stream shows a pop-up card on hovering over with some details and selected QoS KPI's.
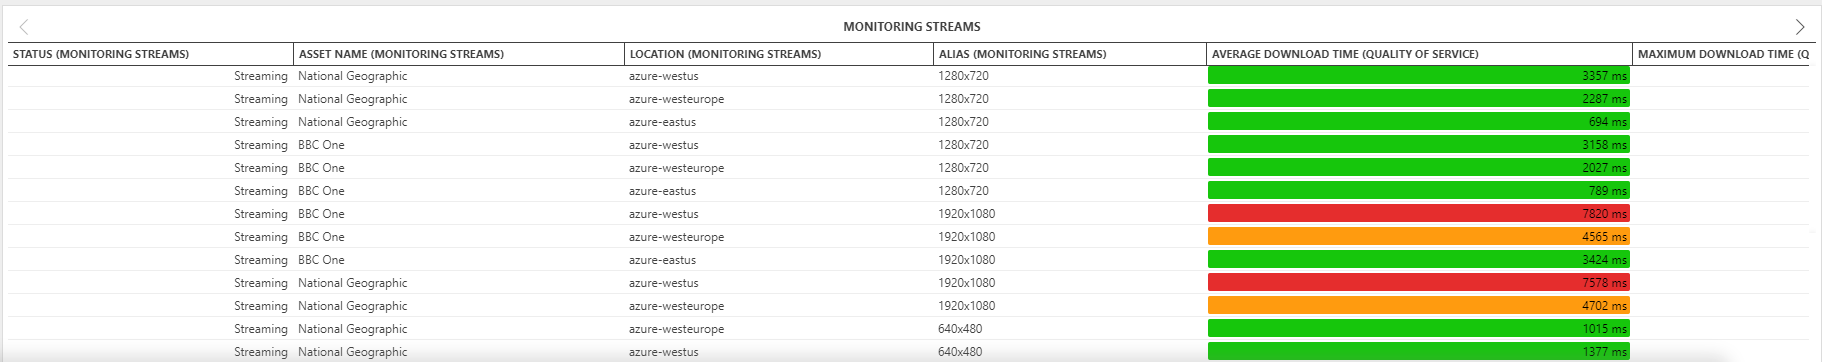 Below the visualization, a table with the monitored streams is shown, following the same filtering and color coding as the visual above.
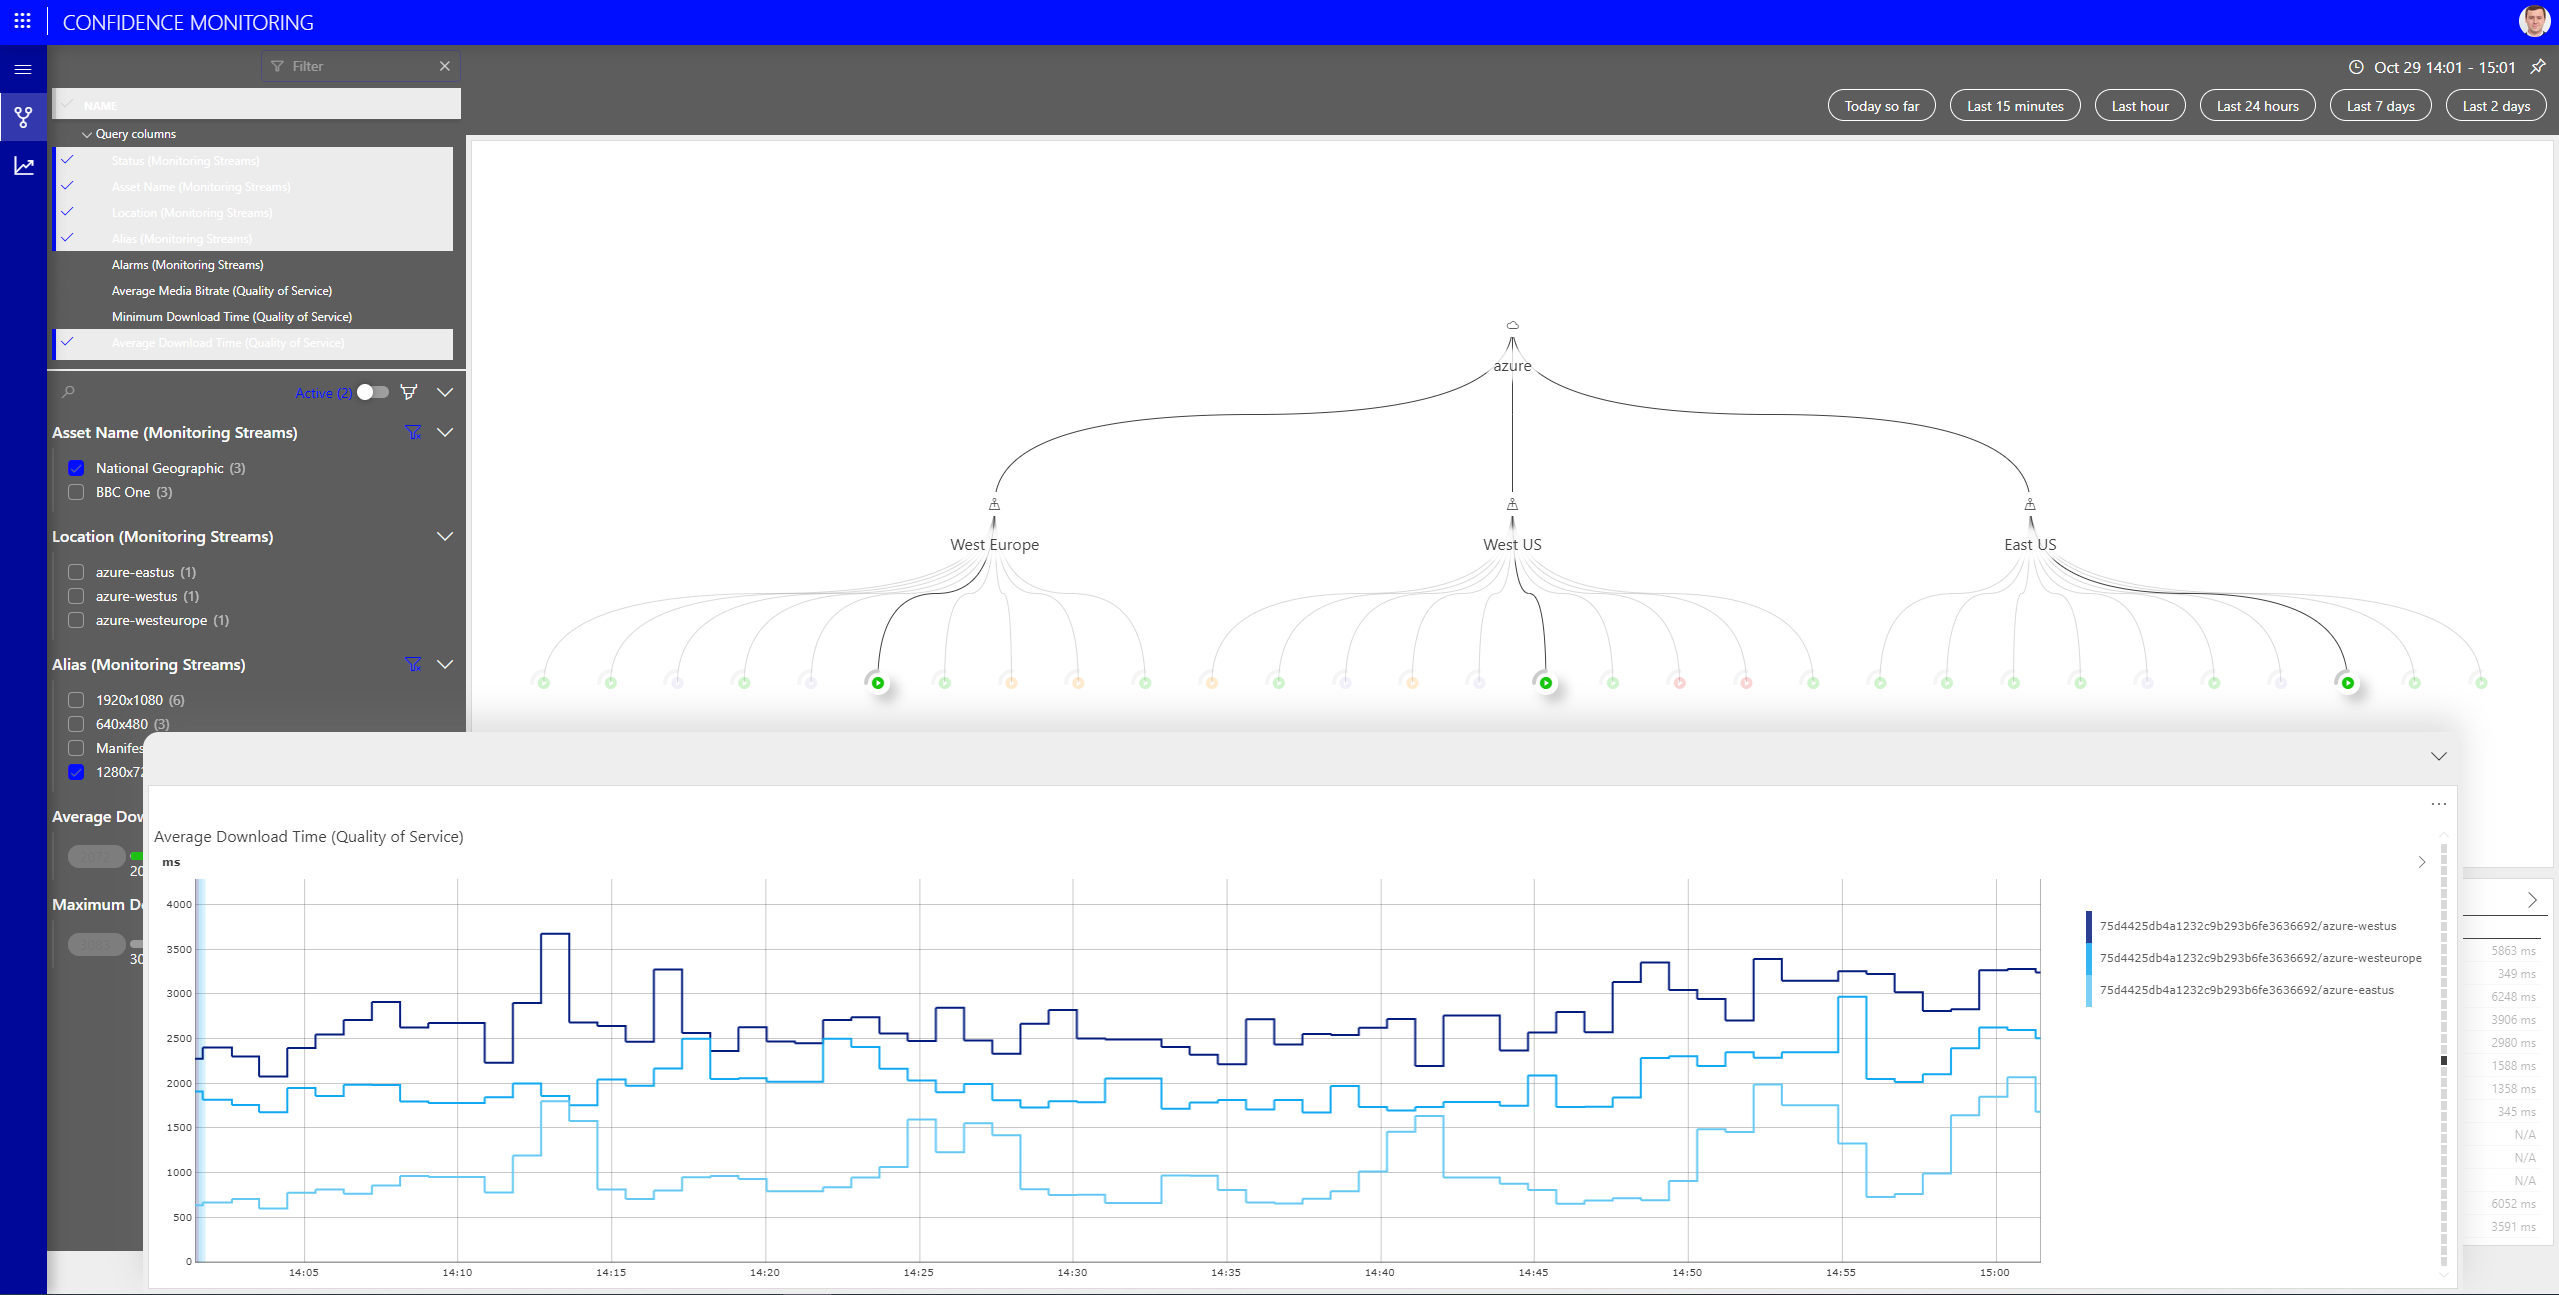 On the bottom of the page, there is an overlay pane showing historical trends of the QoS KPI's for selected streams.
 Using the analytical filter component on the left, we can easily control coloring of the streams on the visual and table for any of the available QoS KPI's.