solution Use Case
Virtual NOC as a Service (vNOCaaS) by MoMe
Many companies rely on a Network Operation Center (NOC) to monitor and manage their network operations. A NOC enables them not only to oversee their networks but also to anticipate potential issues and address them proactively before they impact users. Establishing such a center, however, comes with several requirements: a dedicated room with specific size and environmental conditions, a videowall, a team of skilled and trained technicians working in shifts around the clock (24/7), and a set of advanced monitoring tools. Understandably, not every company can afford or justify the investment required for a traditional NOC.
MoMe, a partner of Skyline for over 20 years, has addressed this challenge by developing a virtual NOC that leverages the powerful capabilities of DataMiner. For organizations lacking the necessary resources to deploy their own NOC, MoMe now offers this as a Service (aaS). The “virtual NOC as a Service” (vNOCaaS) provides comprehensive remote monitoring and control solutions at a fraction of the cost of a standard NOC. Beyond delivering data, alarms, and reports, MoMe employs skilled broadcast and media technicians who can operate networks on behalf of clients as needed.
This monitoring and control platform is constructed using Low-Code Apps and is fully hosted on third-party cloud infrastructure. Through existing connectors or by developing new ones, the platform can interface with virtually any piece of equipment. It processes data gathered from the system and presents it using customizable dashboards tailored to each user’s specific needs. In the future, DOM will be integrated to supply additional data from devices that are not manageable through connectors.
Several of MoMe’s customers are already utilizing vNOCaaS to manage content distribution streaming services via the Nimbra Edge and Zixi Broadcaster platforms in the cloud. Reported benefits extend beyond cost savings; clients’ technicians are able to focus on their core business activities without needing additional training in monitoring and control tools, or spending nights and weekends on call for potential issues.
USE CASE DETAILS
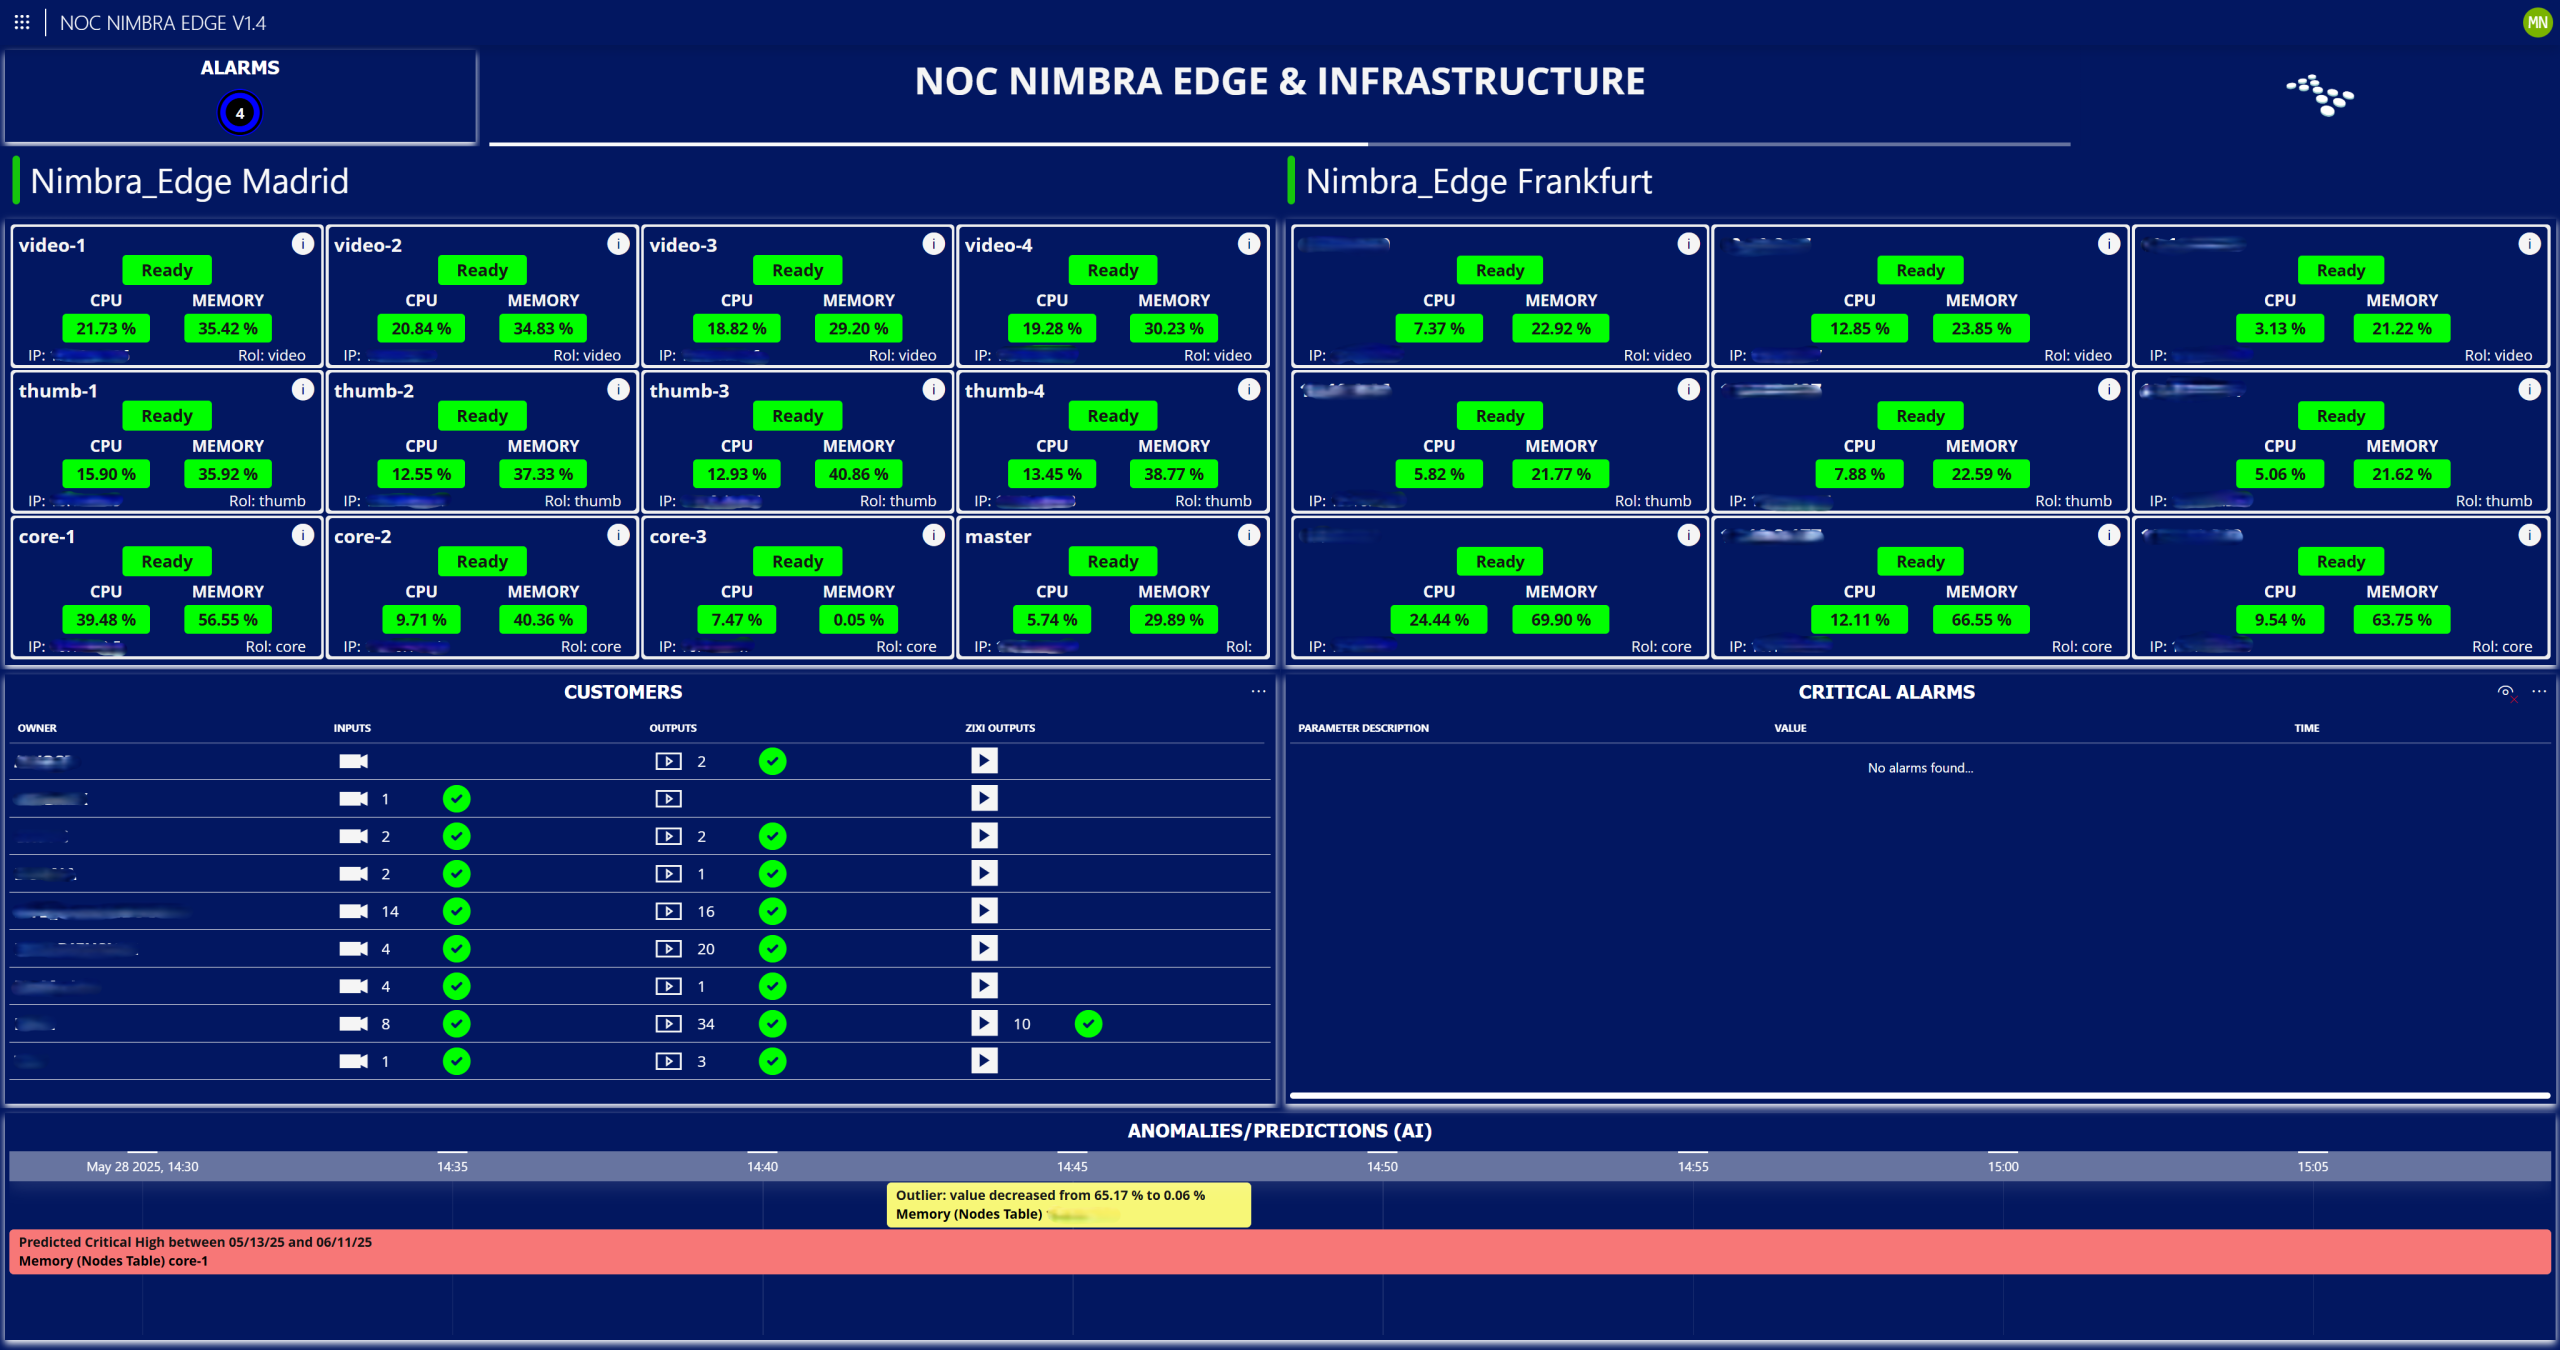
The main page displays the status of all nodes deployed in the cloud, a list of all clients registered on the platform, as well as the number and status of their inputs and outputs. It also enables a quick detection of critical alarms present in the system and provides visibility into anomalies and predictions generated by the DataMiner System’s AI engine.
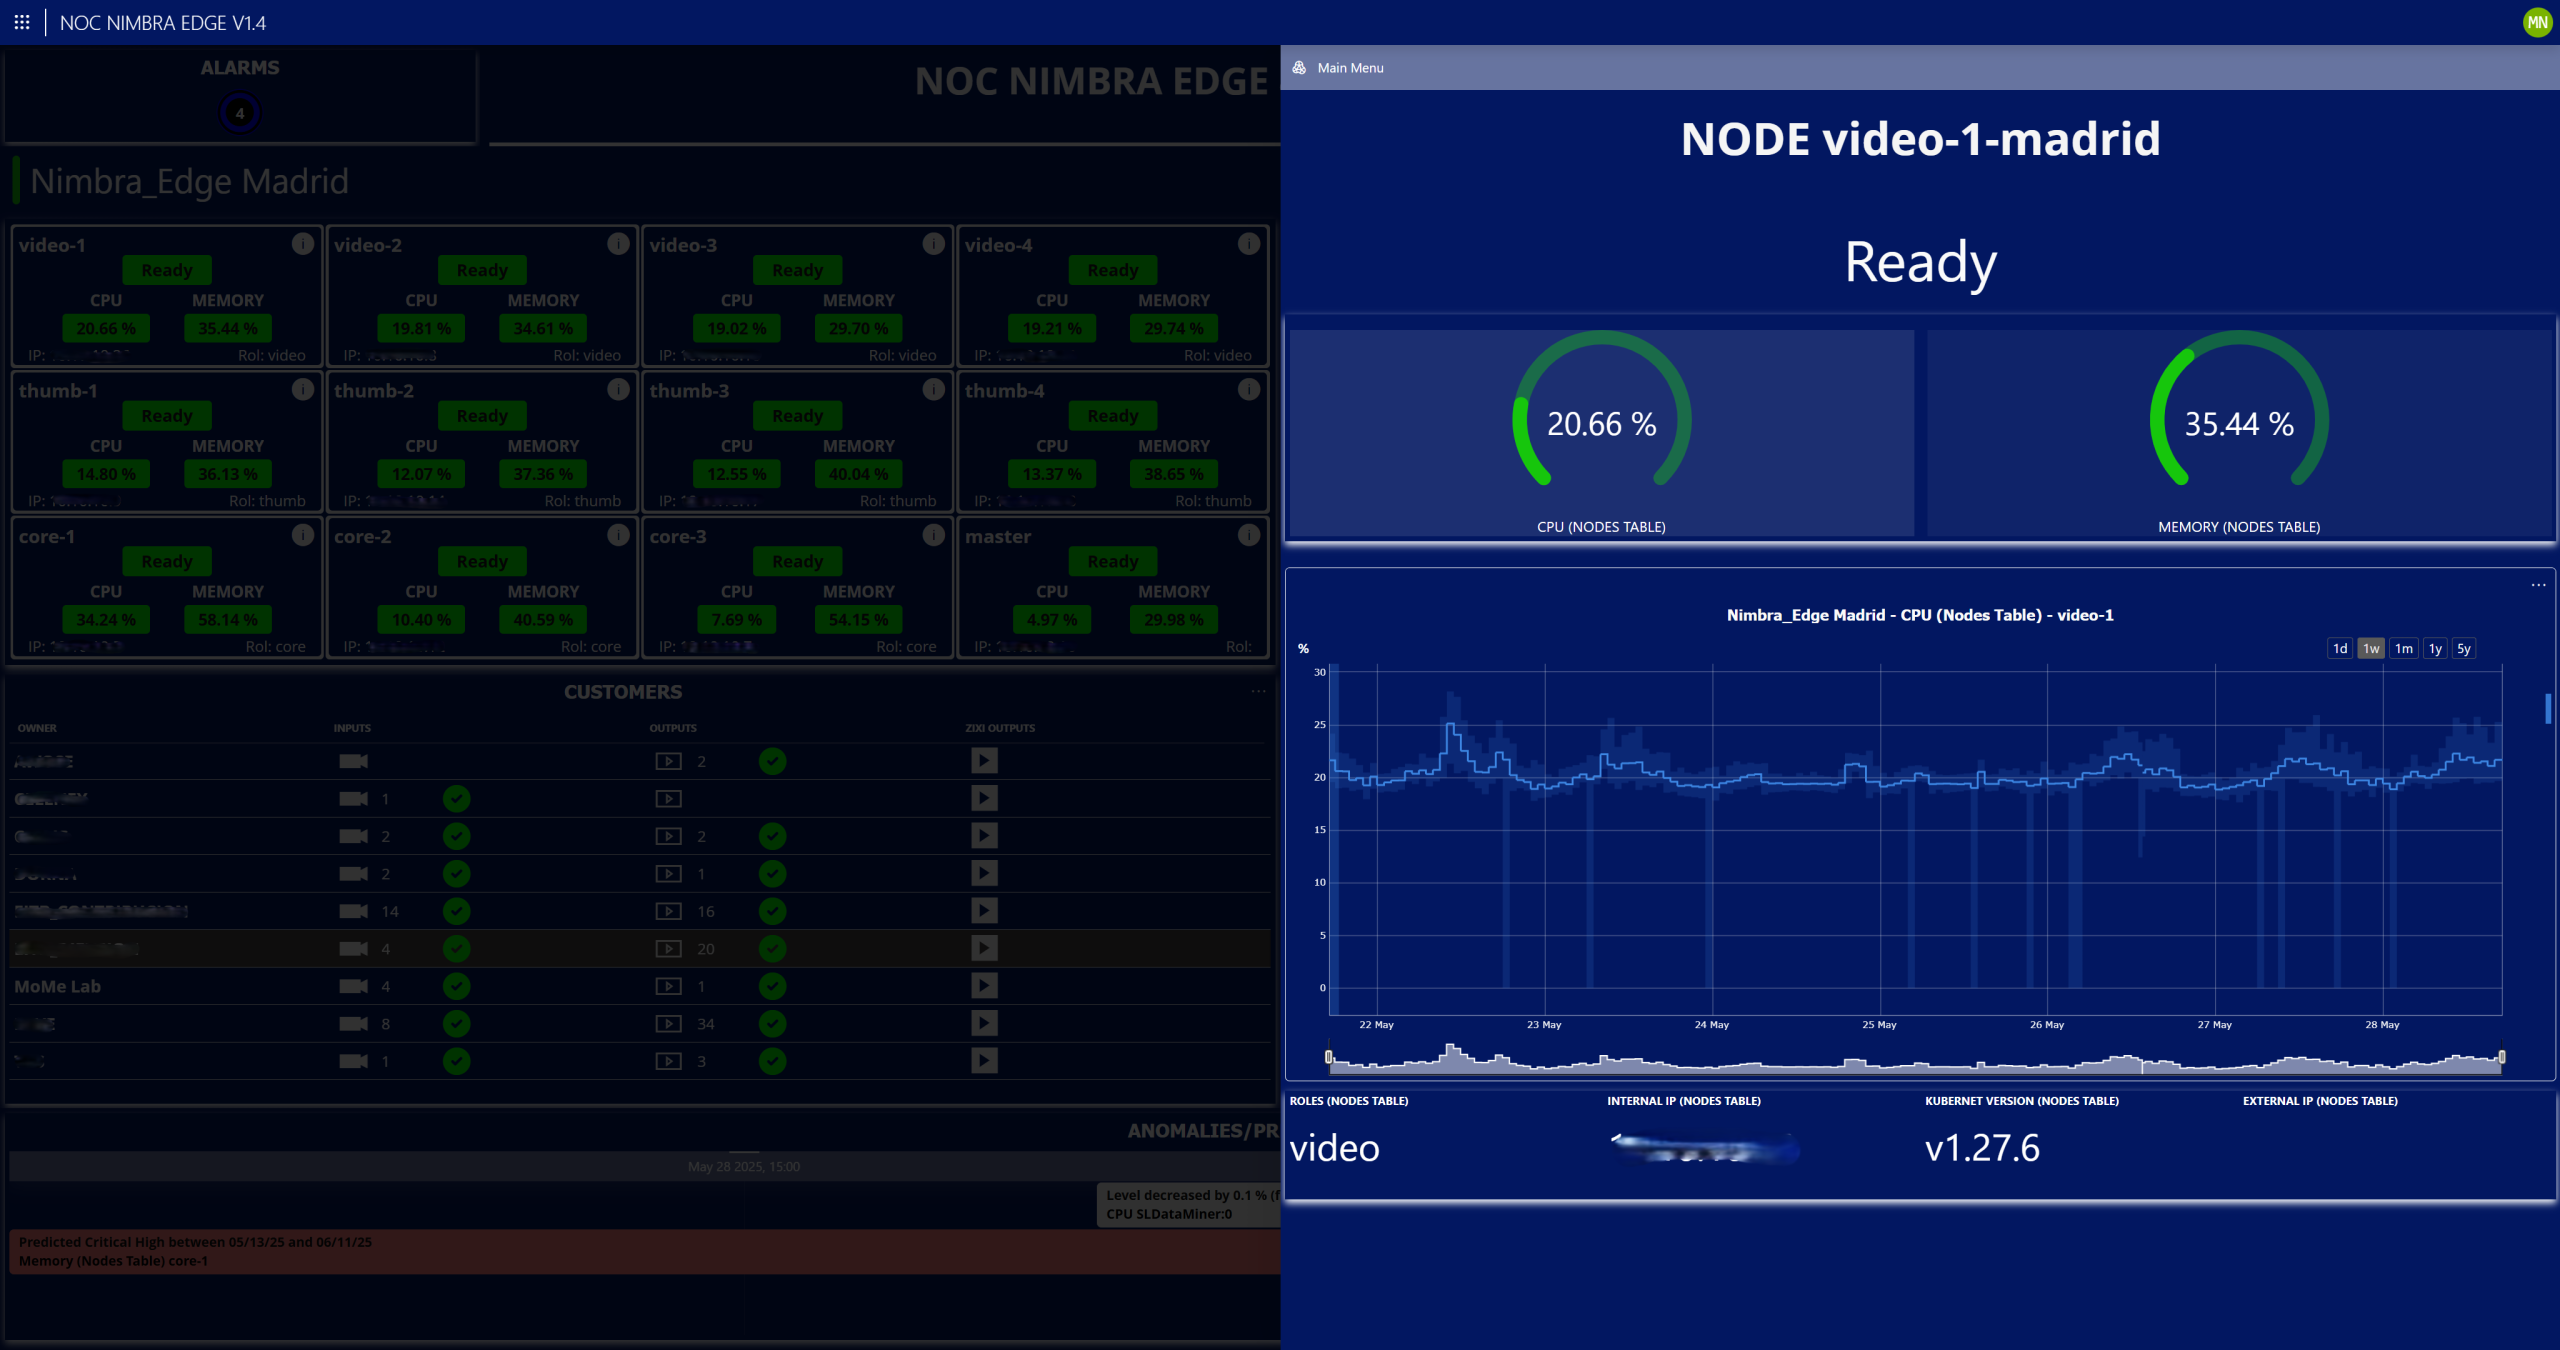 By clicking on the information icon of any node, the Details tab for the selected node will open. This section displays the CPU and memory status, which allows users to visualize trending graphs by selecting one of the metrics, and provides key node information such as type, IP address, Kubernetes version, and external IP (if applicable).
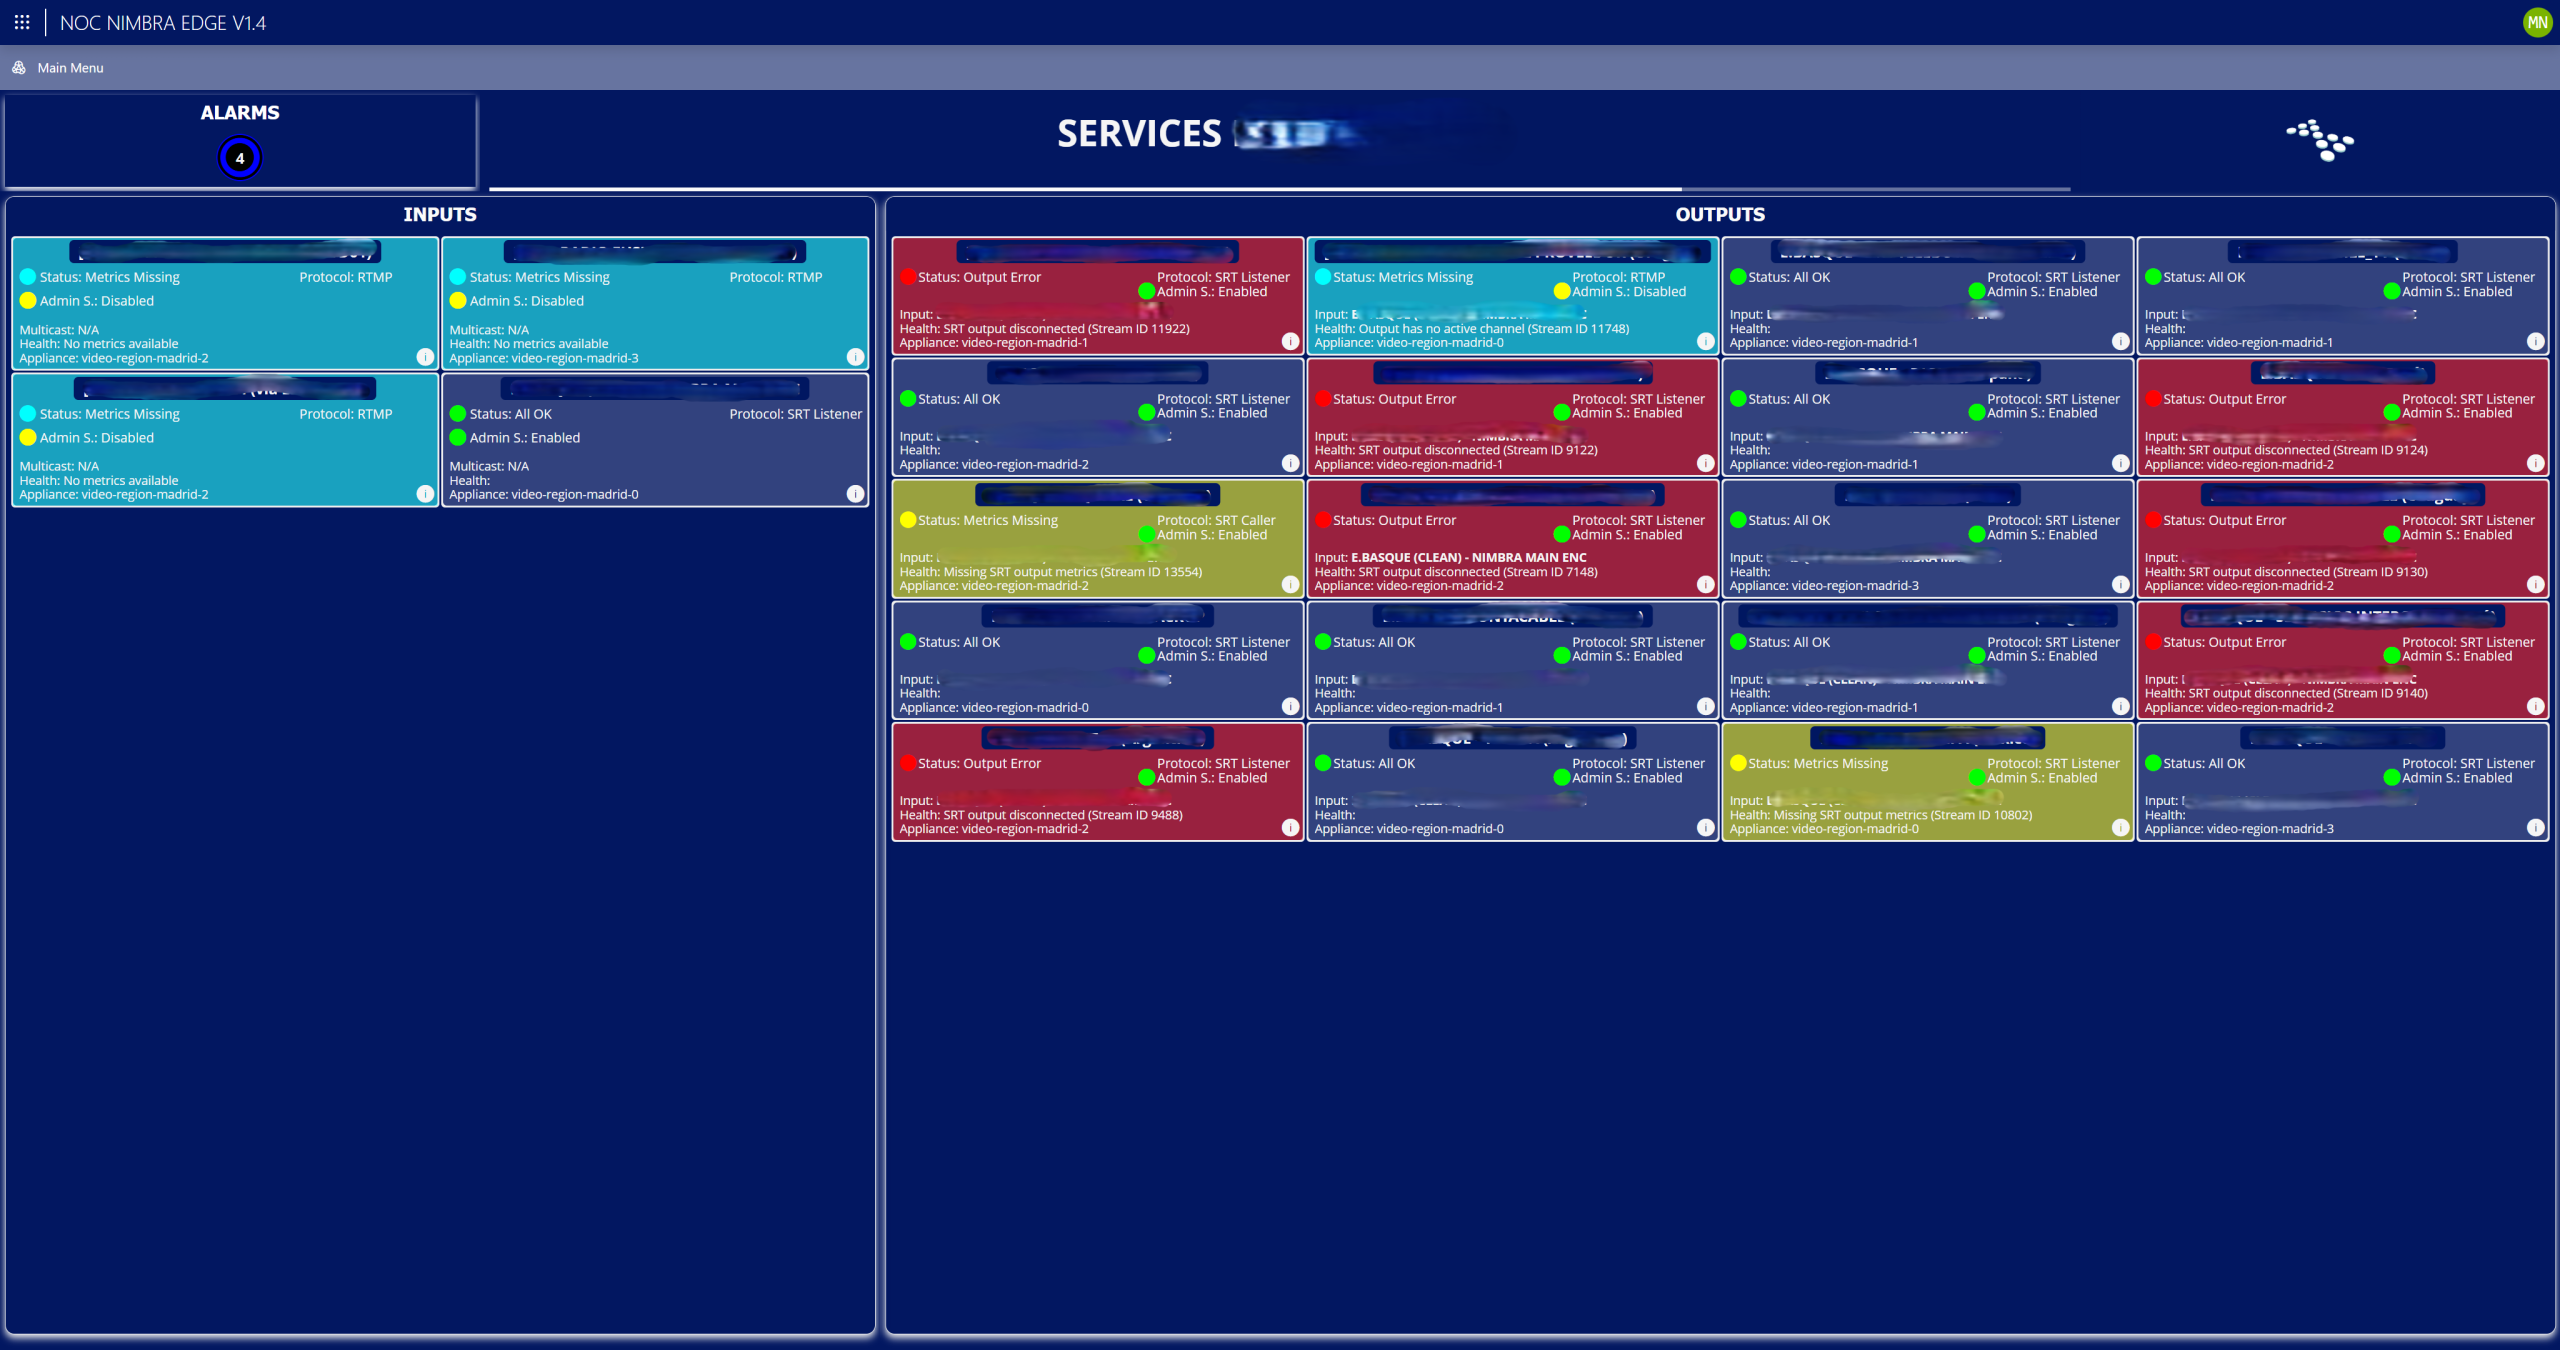 By clicking any client's name, the Services page will open. This page shows all inputs and outputs linked to the client, with their status, which can be observed quickly thanks to a background color-coding system. It also displays relevant information such as the input name, the protocol in use, and the appliance through which the service enters or exits, among other details.
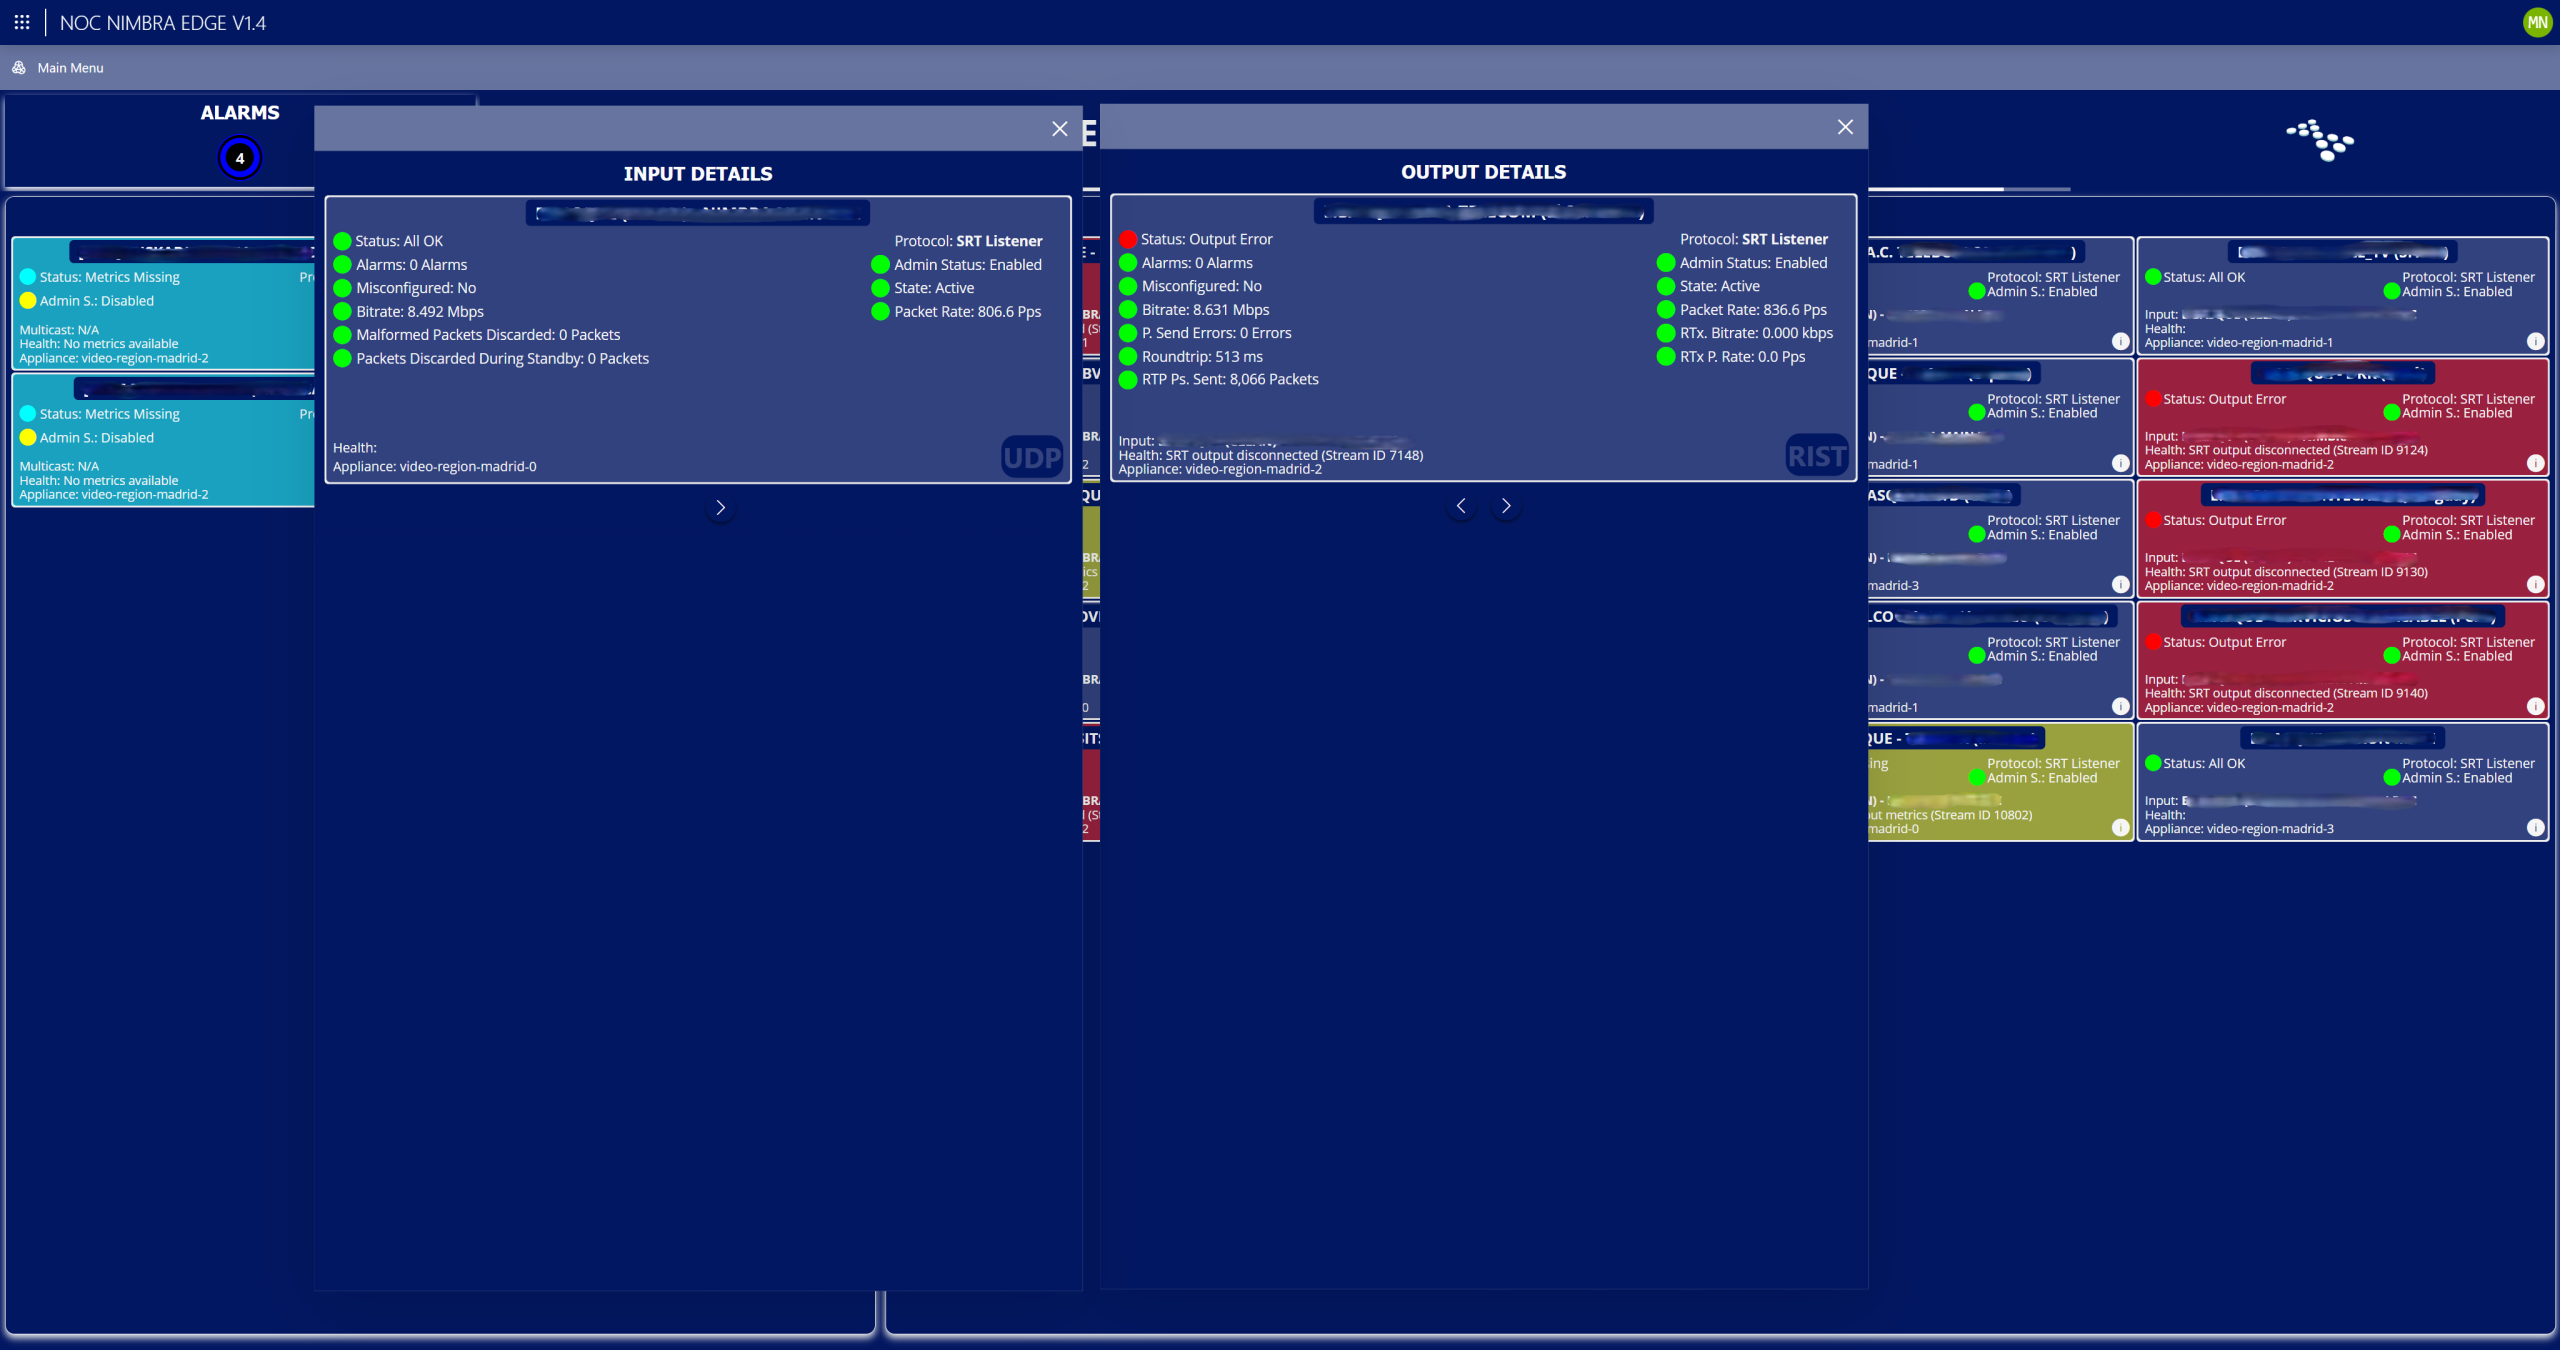 By clicking the information icon of any input or output, a window with detailed information will open. The data displayed depends on the transmission protocol. For a single input or output, it is possible to view data from multiple protocols. The protocols supported by the application include UDP, RIST, SRT, and Zixi.
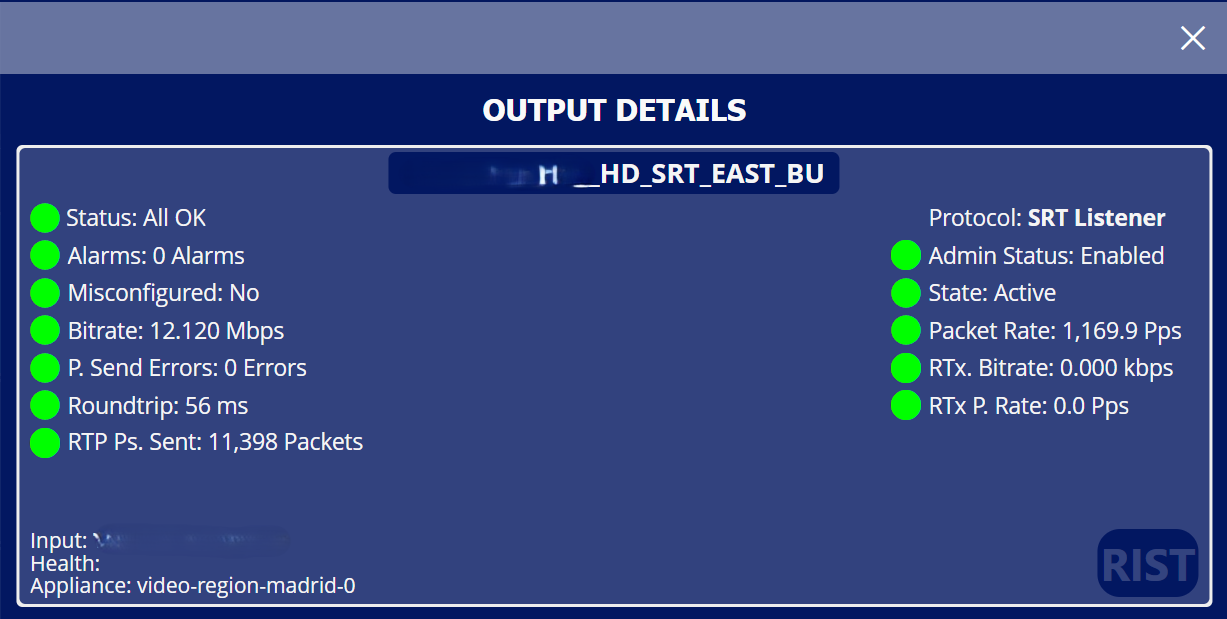 This window shows the detailed parameters for output using the RIST protocol.
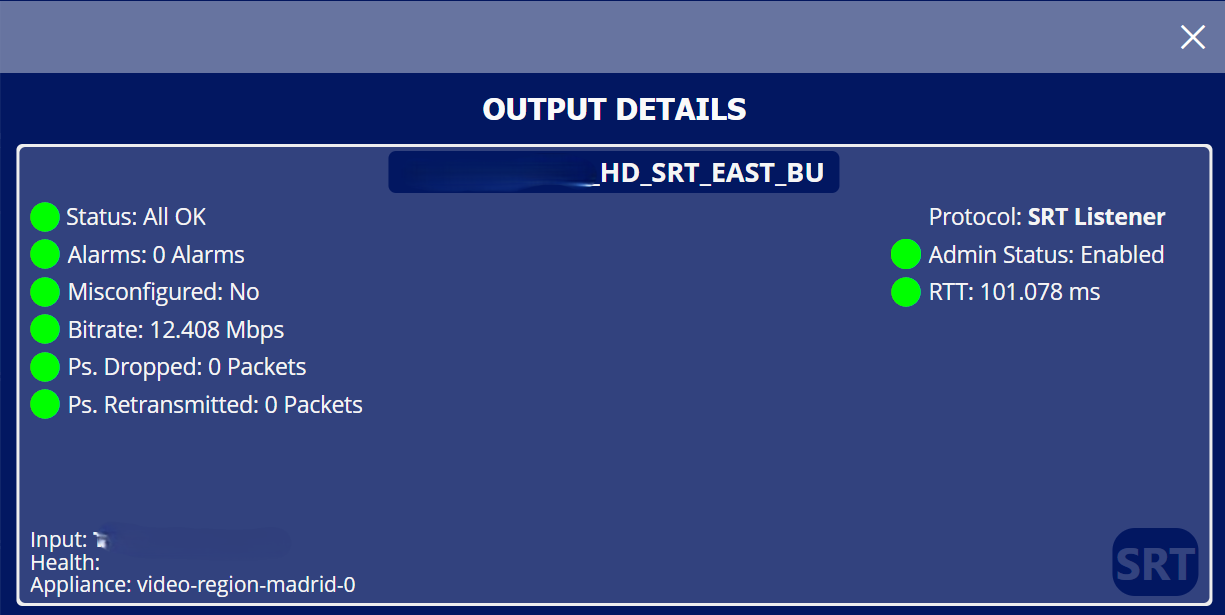 This window shows the detailed parameters for output using the SRT protocol.
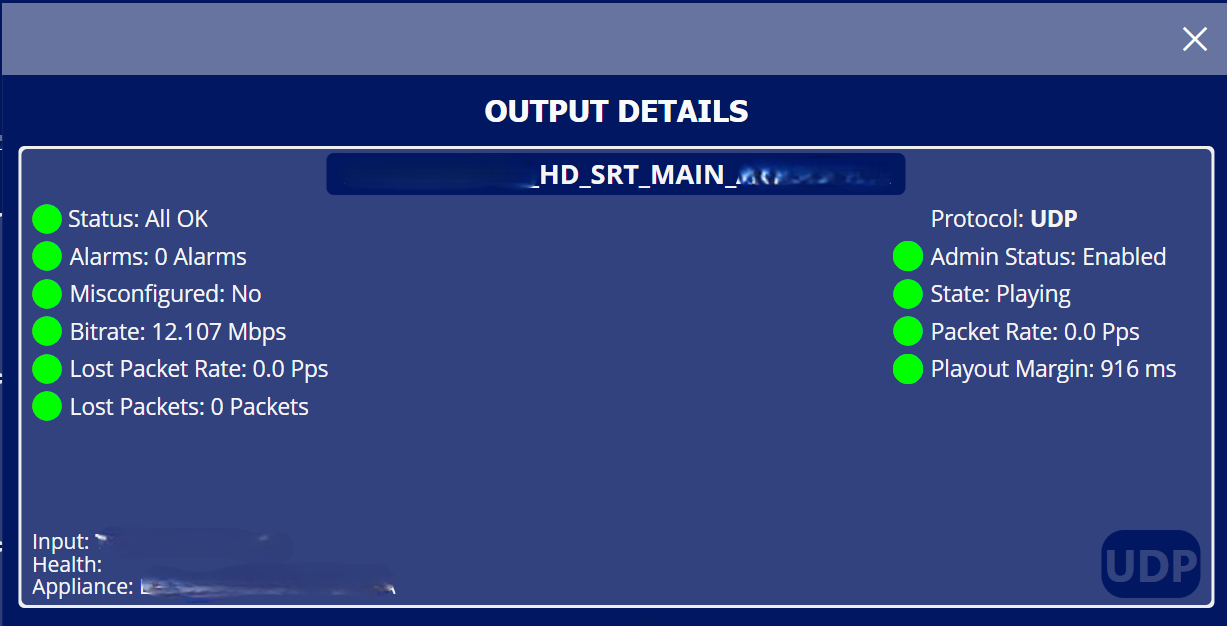 This window shows the detailed parameters for output using the UDP protocol.
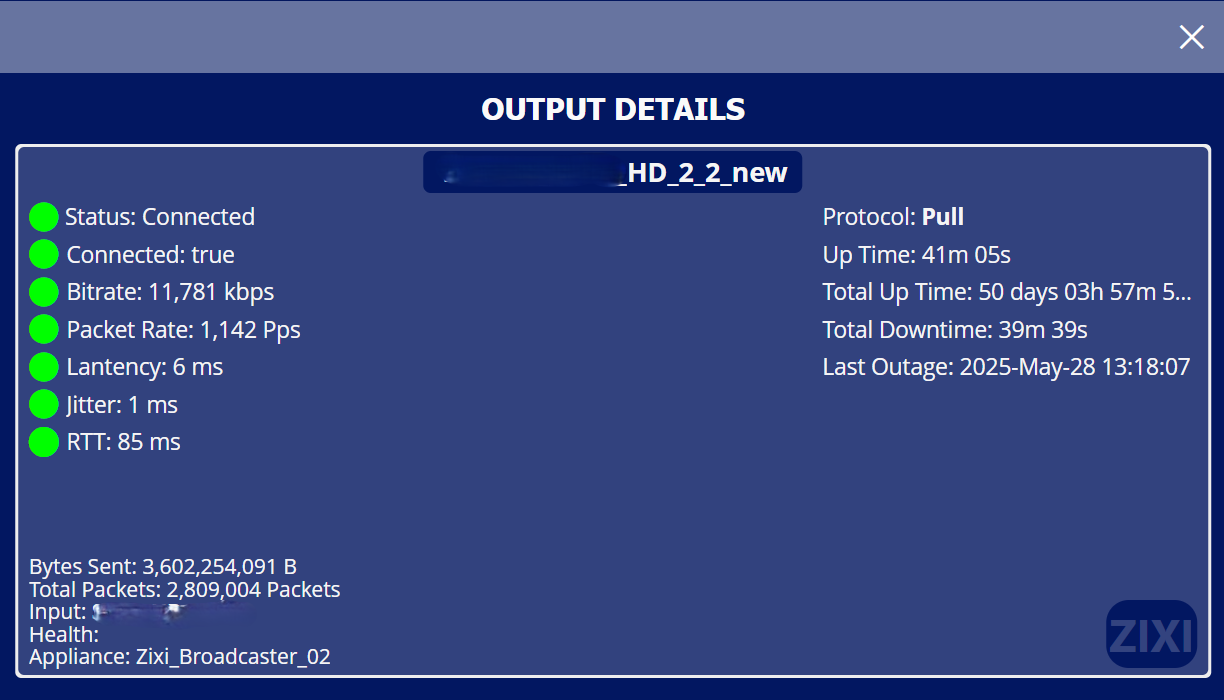 This window shows the detailed parameters for output using the Zixi protocol.
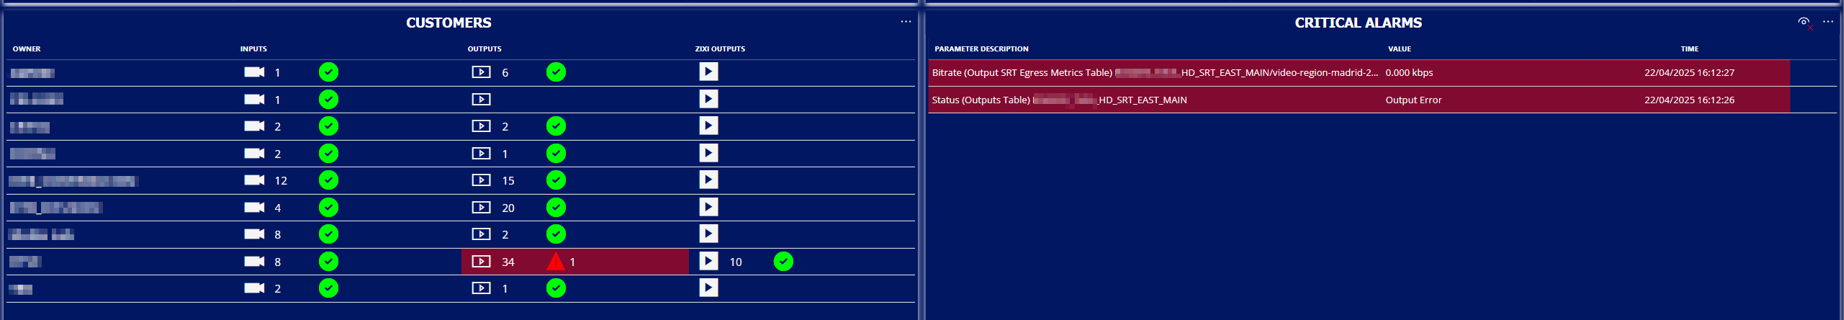 Thanks to the power of GQI and the customization of UI components, a visual method has been developed to quickly identify the impact of a detected critical alarm. When virtual NOC detects a critical alarm affecting a client’s service, the main page highlights the affected client in red, indicating whether the issue is related to an input, a Nimbra Edge output, or a Zixi Broadcaster output. This allows an extremely fast detection of any issue on the platform by operators.
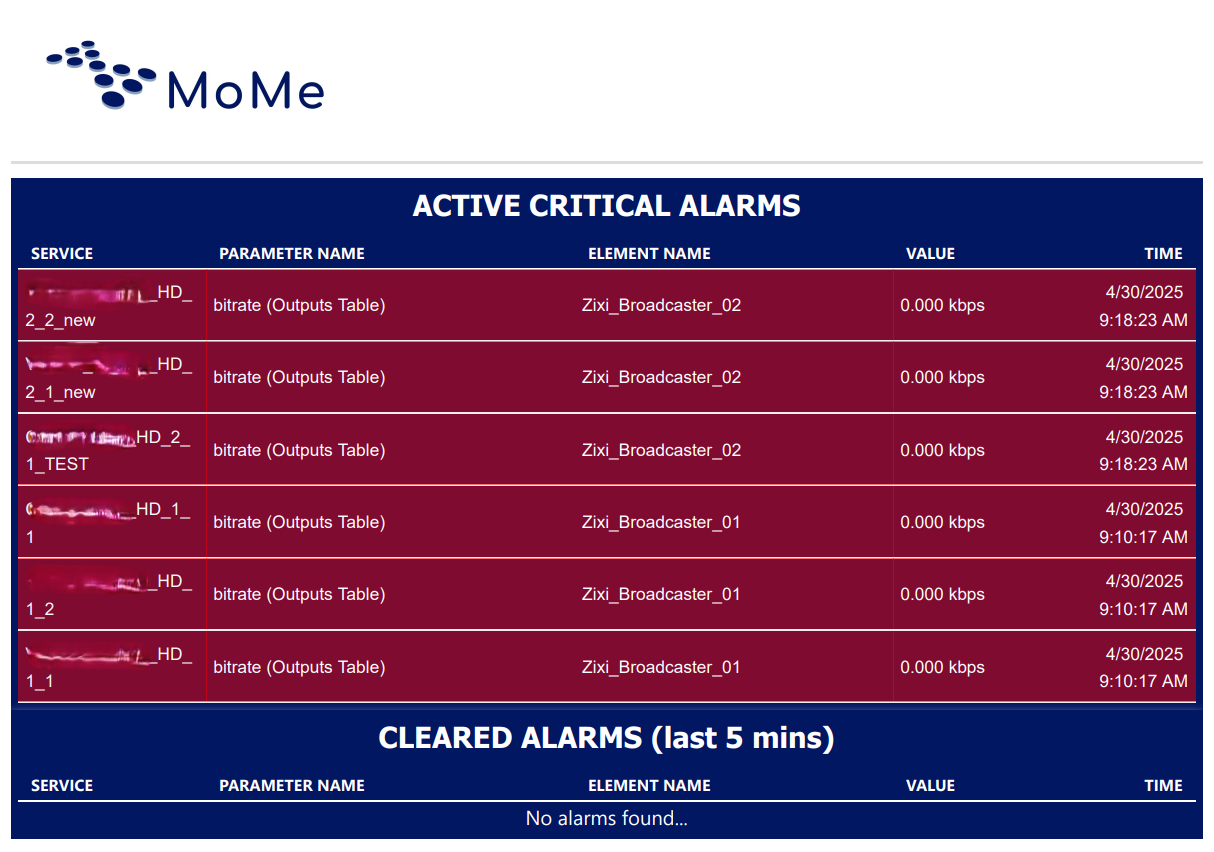 In addition to the virtual NOC visualization, critical alarms trigger automatic emails with a report listing all critical alarms or cleared alarms detected in the system.
This helps virtual NOC operators quickly resolve any issues that may arise.
In addition to the virtual NOC visualization, critical alarms trigger automatic emails with a report listing all critical alarms or cleared alarms detected in the system.
This helps virtual NOC operators quickly resolve any issues that may arise.
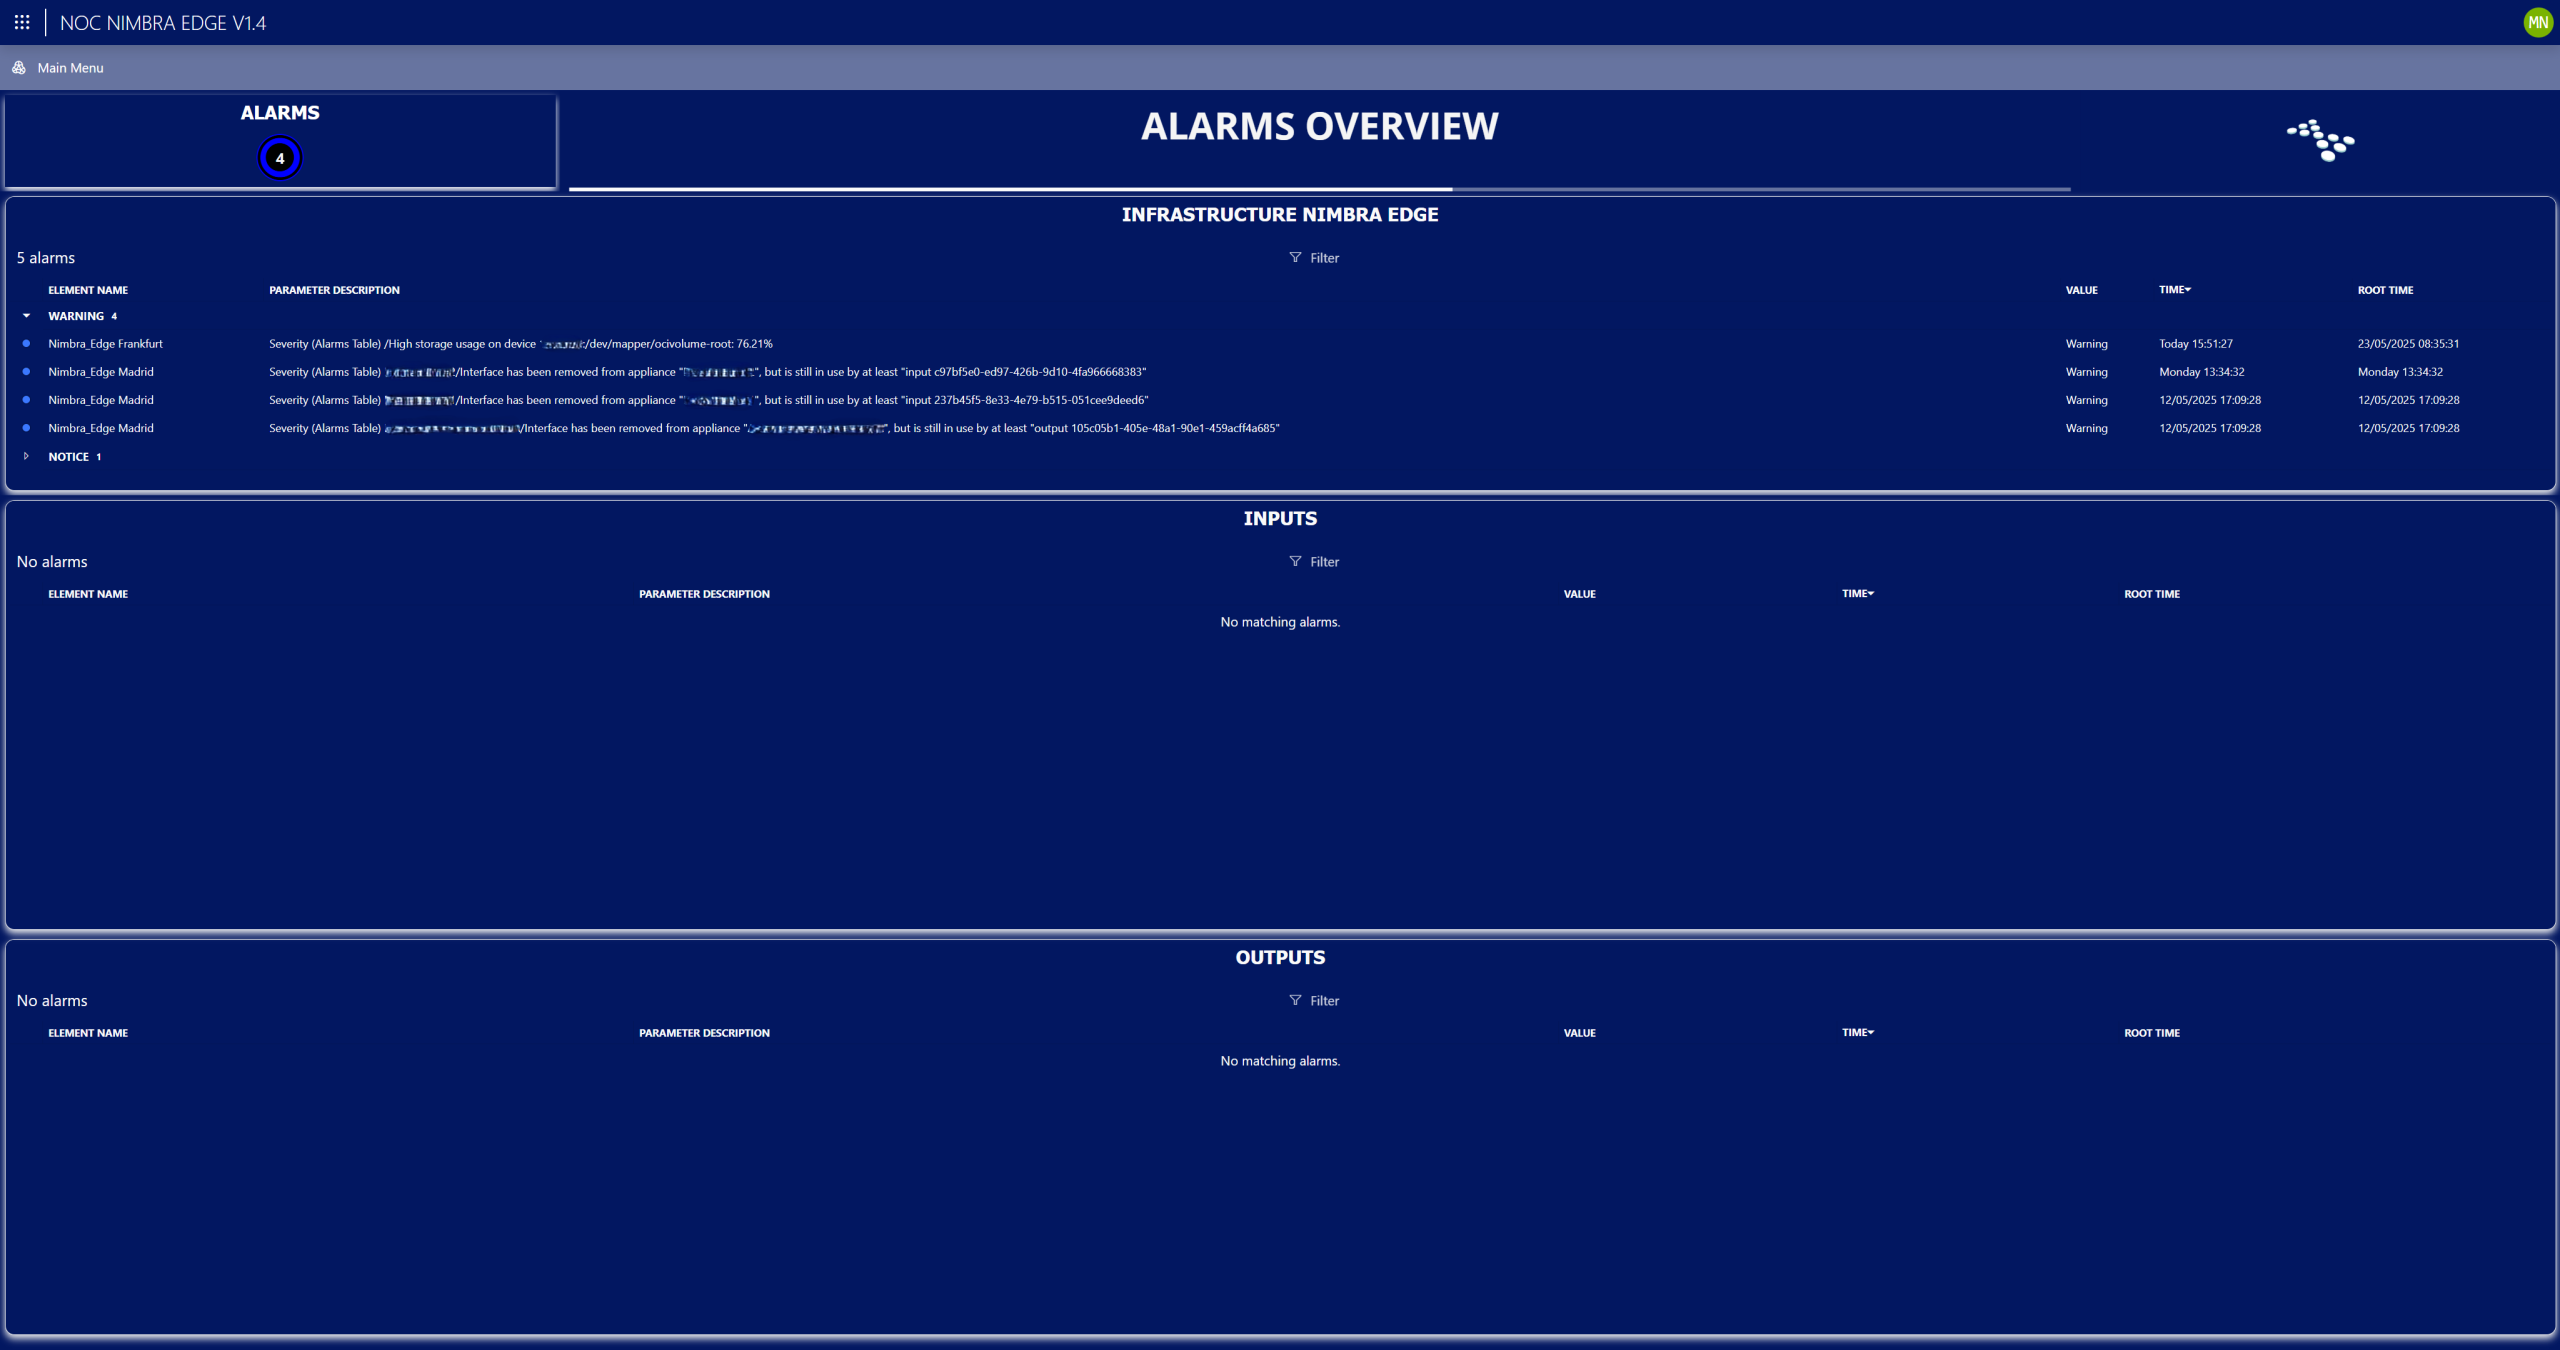 And finally, the virtual NOC provides a dedicated page that shows three distinct alarm lists: infrastructure alarms related to the distribution platforms, input alarms for signals going into the platforms and output alarms for signals coming from the platforms.