solution Use Case
Dataminer CityOps – Smart Parking and Multimodal Transport
Smart occupancy, charging, and bike sharing, stitched into one live city view
This use case brings together parking, EV charging, and bike sharing into a single DataMiner CityOps module that helps citizens spots faster while enabling operations teams to maintain high availability. It works with the DataMiner CityOps Communication Hub to push automated availability and occupancy messages to citywide digital signage, mobile apps, and web. It also connects with DataMiner CityOps Planned Maintenance, Asset Management, and Work Orders so field teams act on issues before they impact service.
How it works across the city
Live sensor feeds from meters, gates, EV chargers, and bike stations flow into DataMiner. The DataMiner CityOps module fuses occupancy, power, and health telemetry with GIS layers to produce a street-level picture of supply and demand. The DataMiner CityOps Communication Hub publishes machine-generated messages to digital signage, social media, and subscribed channels so citizens always see current availability. Integration with DataMiner CityOps Planned Maintenance, Asset Management, and Work Orders closes the loop by turning detected faults and threshold breaches into actionable tasks with location, asset ID, and SLA context.
USE CASE DETAILS
Parking lot drill-down
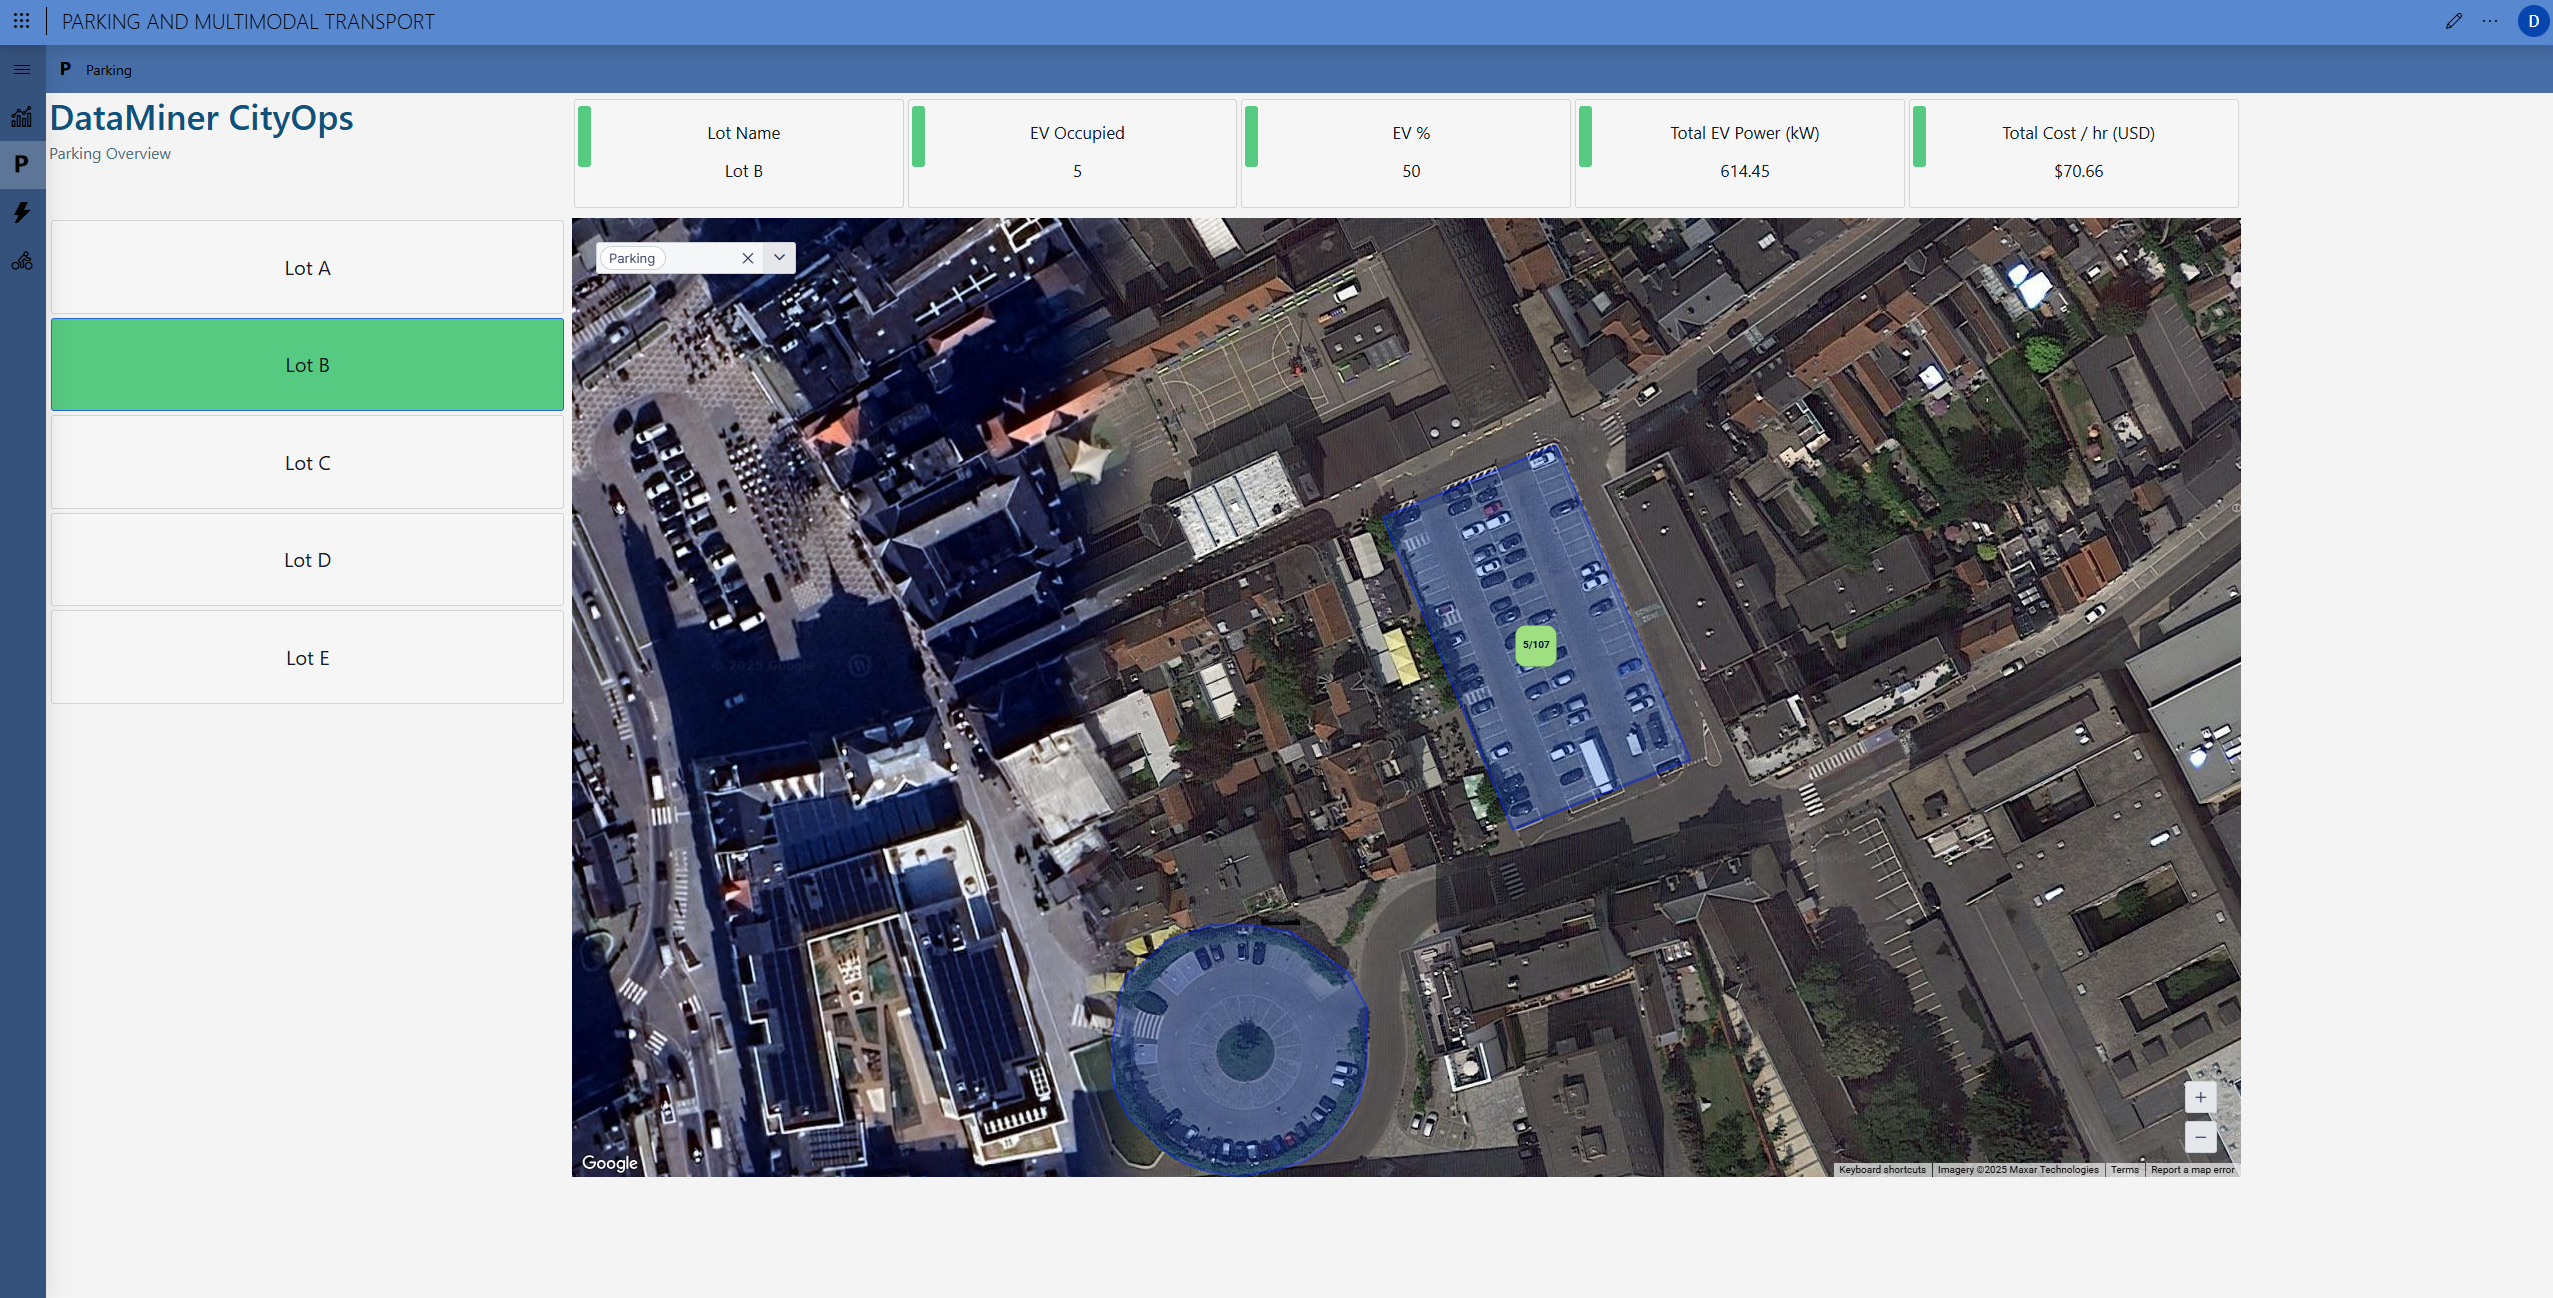
This page lets you switch between lots using the list on the left while the map centers on the selected area. At the top, operational KPIs display lot name, EV occupied count, EV percentage, total EV power, and current cost per hour. This view is ideal for energy and cost optimization on EV bays and to schedule off-peak charging windows via DataMiner CityOps Planned Maintenance.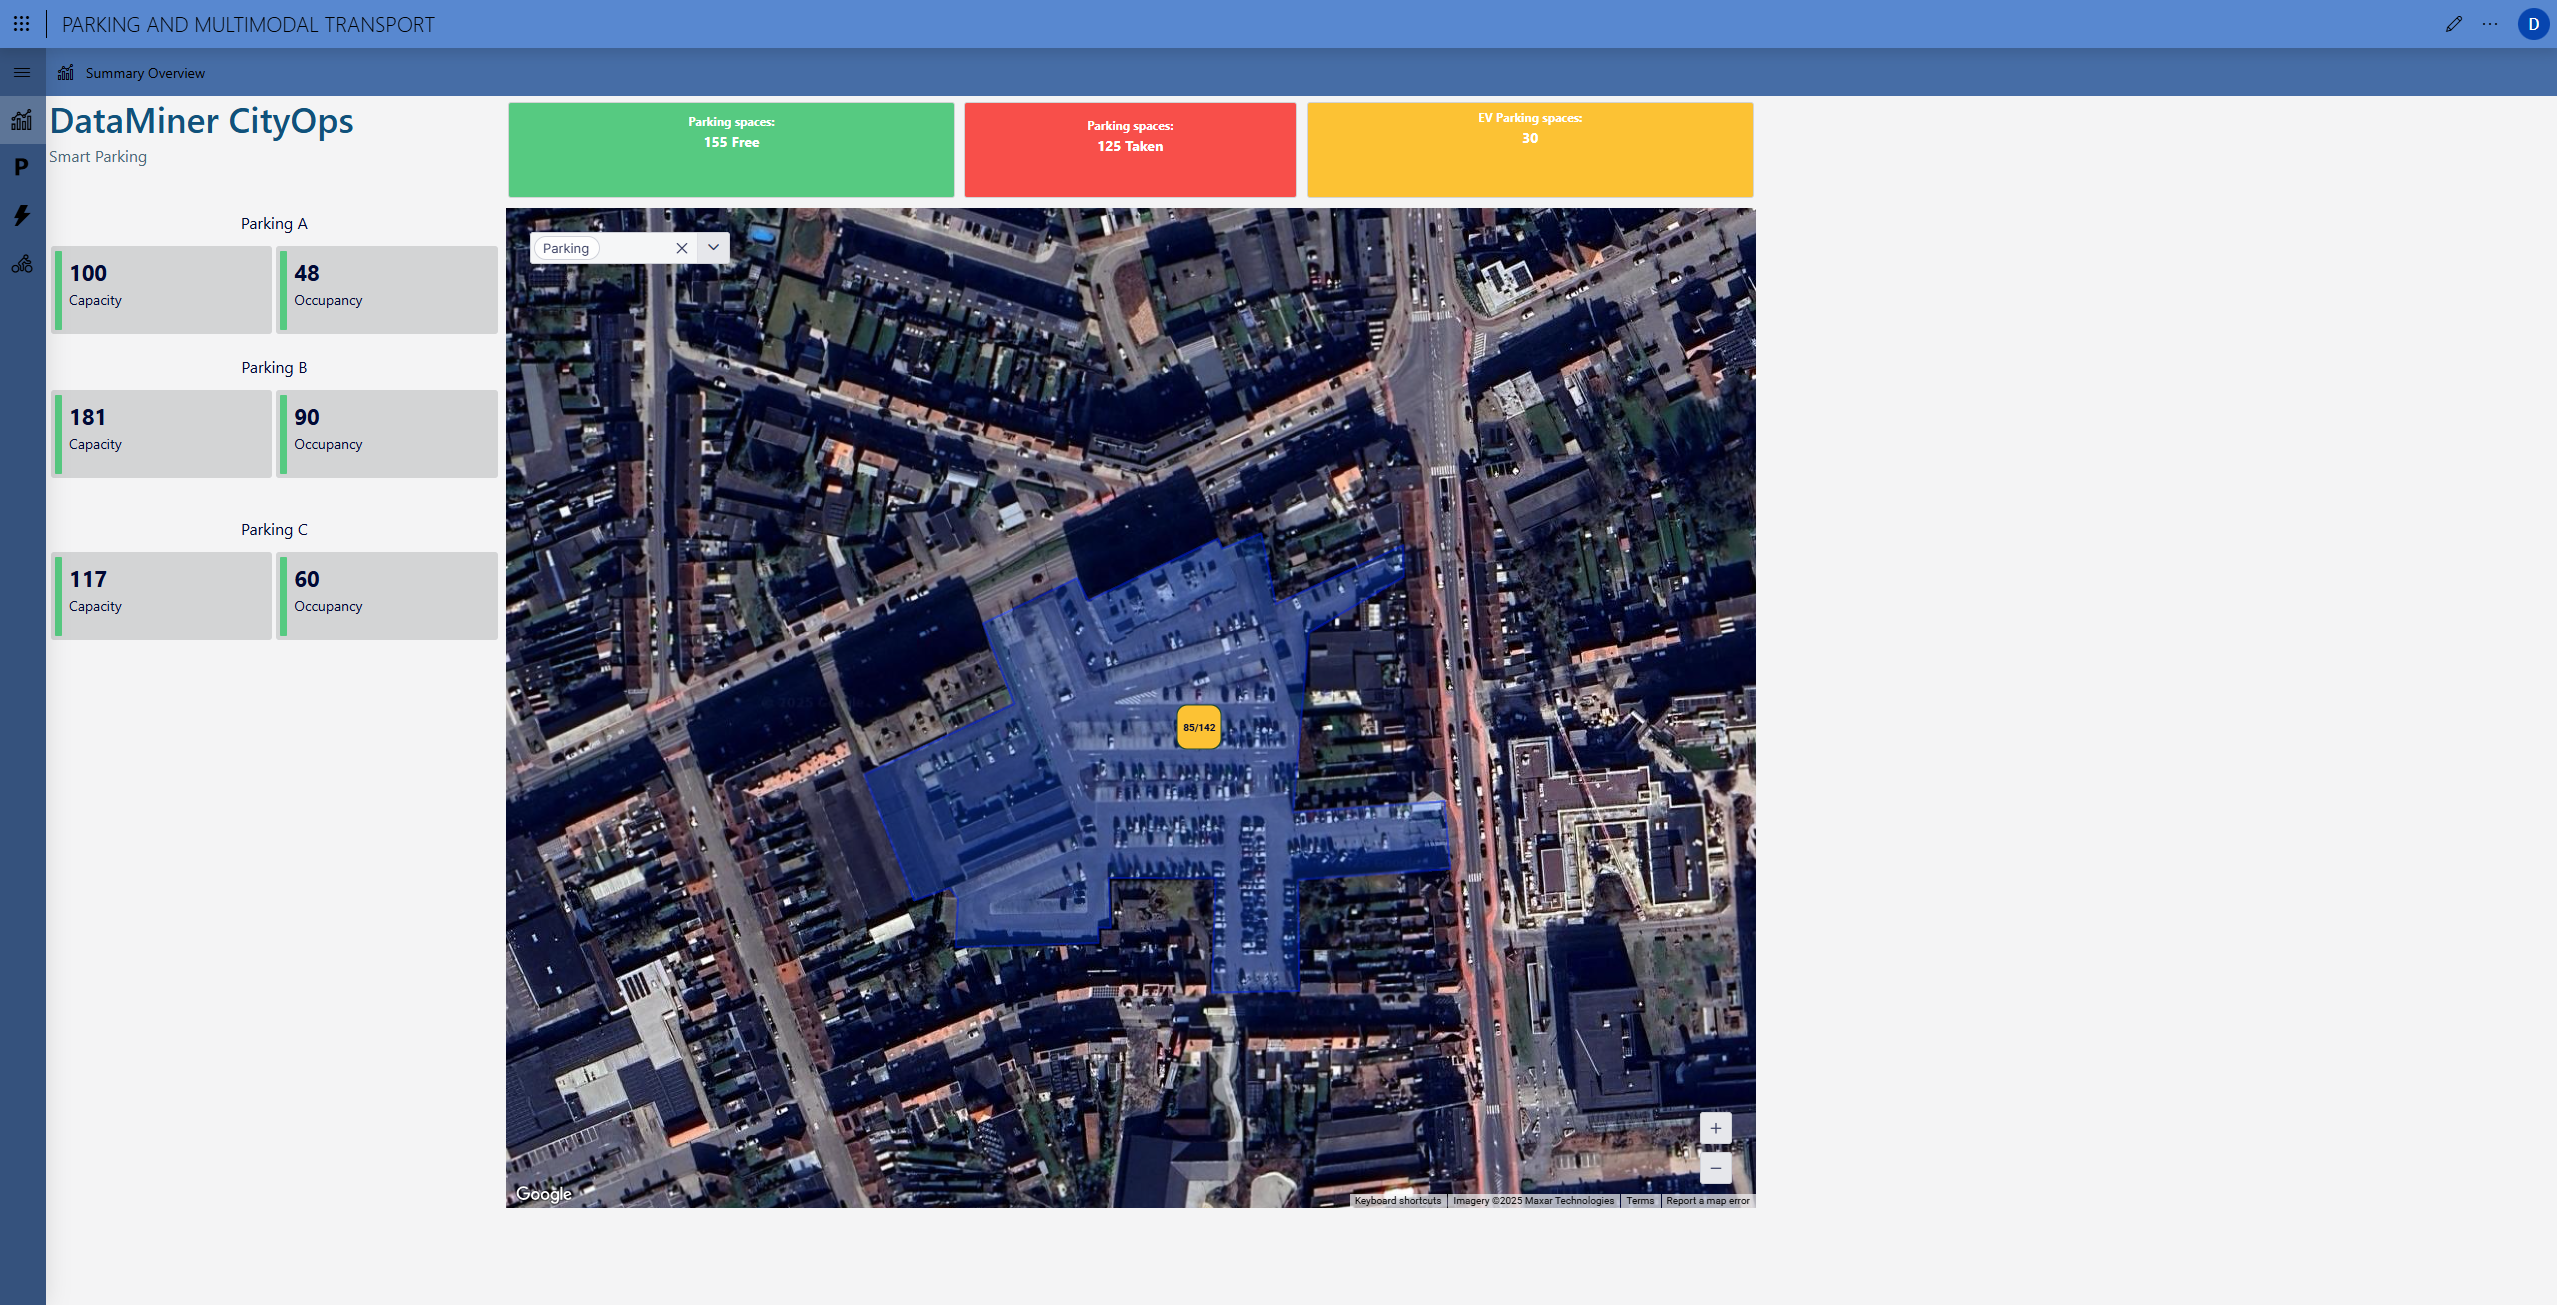
Lot focus with polygon boundaries
This screen zooms into a single car park with geofenced polygons. The highlighted boundary and the badge in the center expose live taken versus capacity values. Managers can validate that a zone’s occupancy aligns with policy and, when thresholds are exceeded, the module can automatically route drivers to nearby alternatives through DataMiner CityOps Communication Hub digital signs and apps.
Smart parking summary
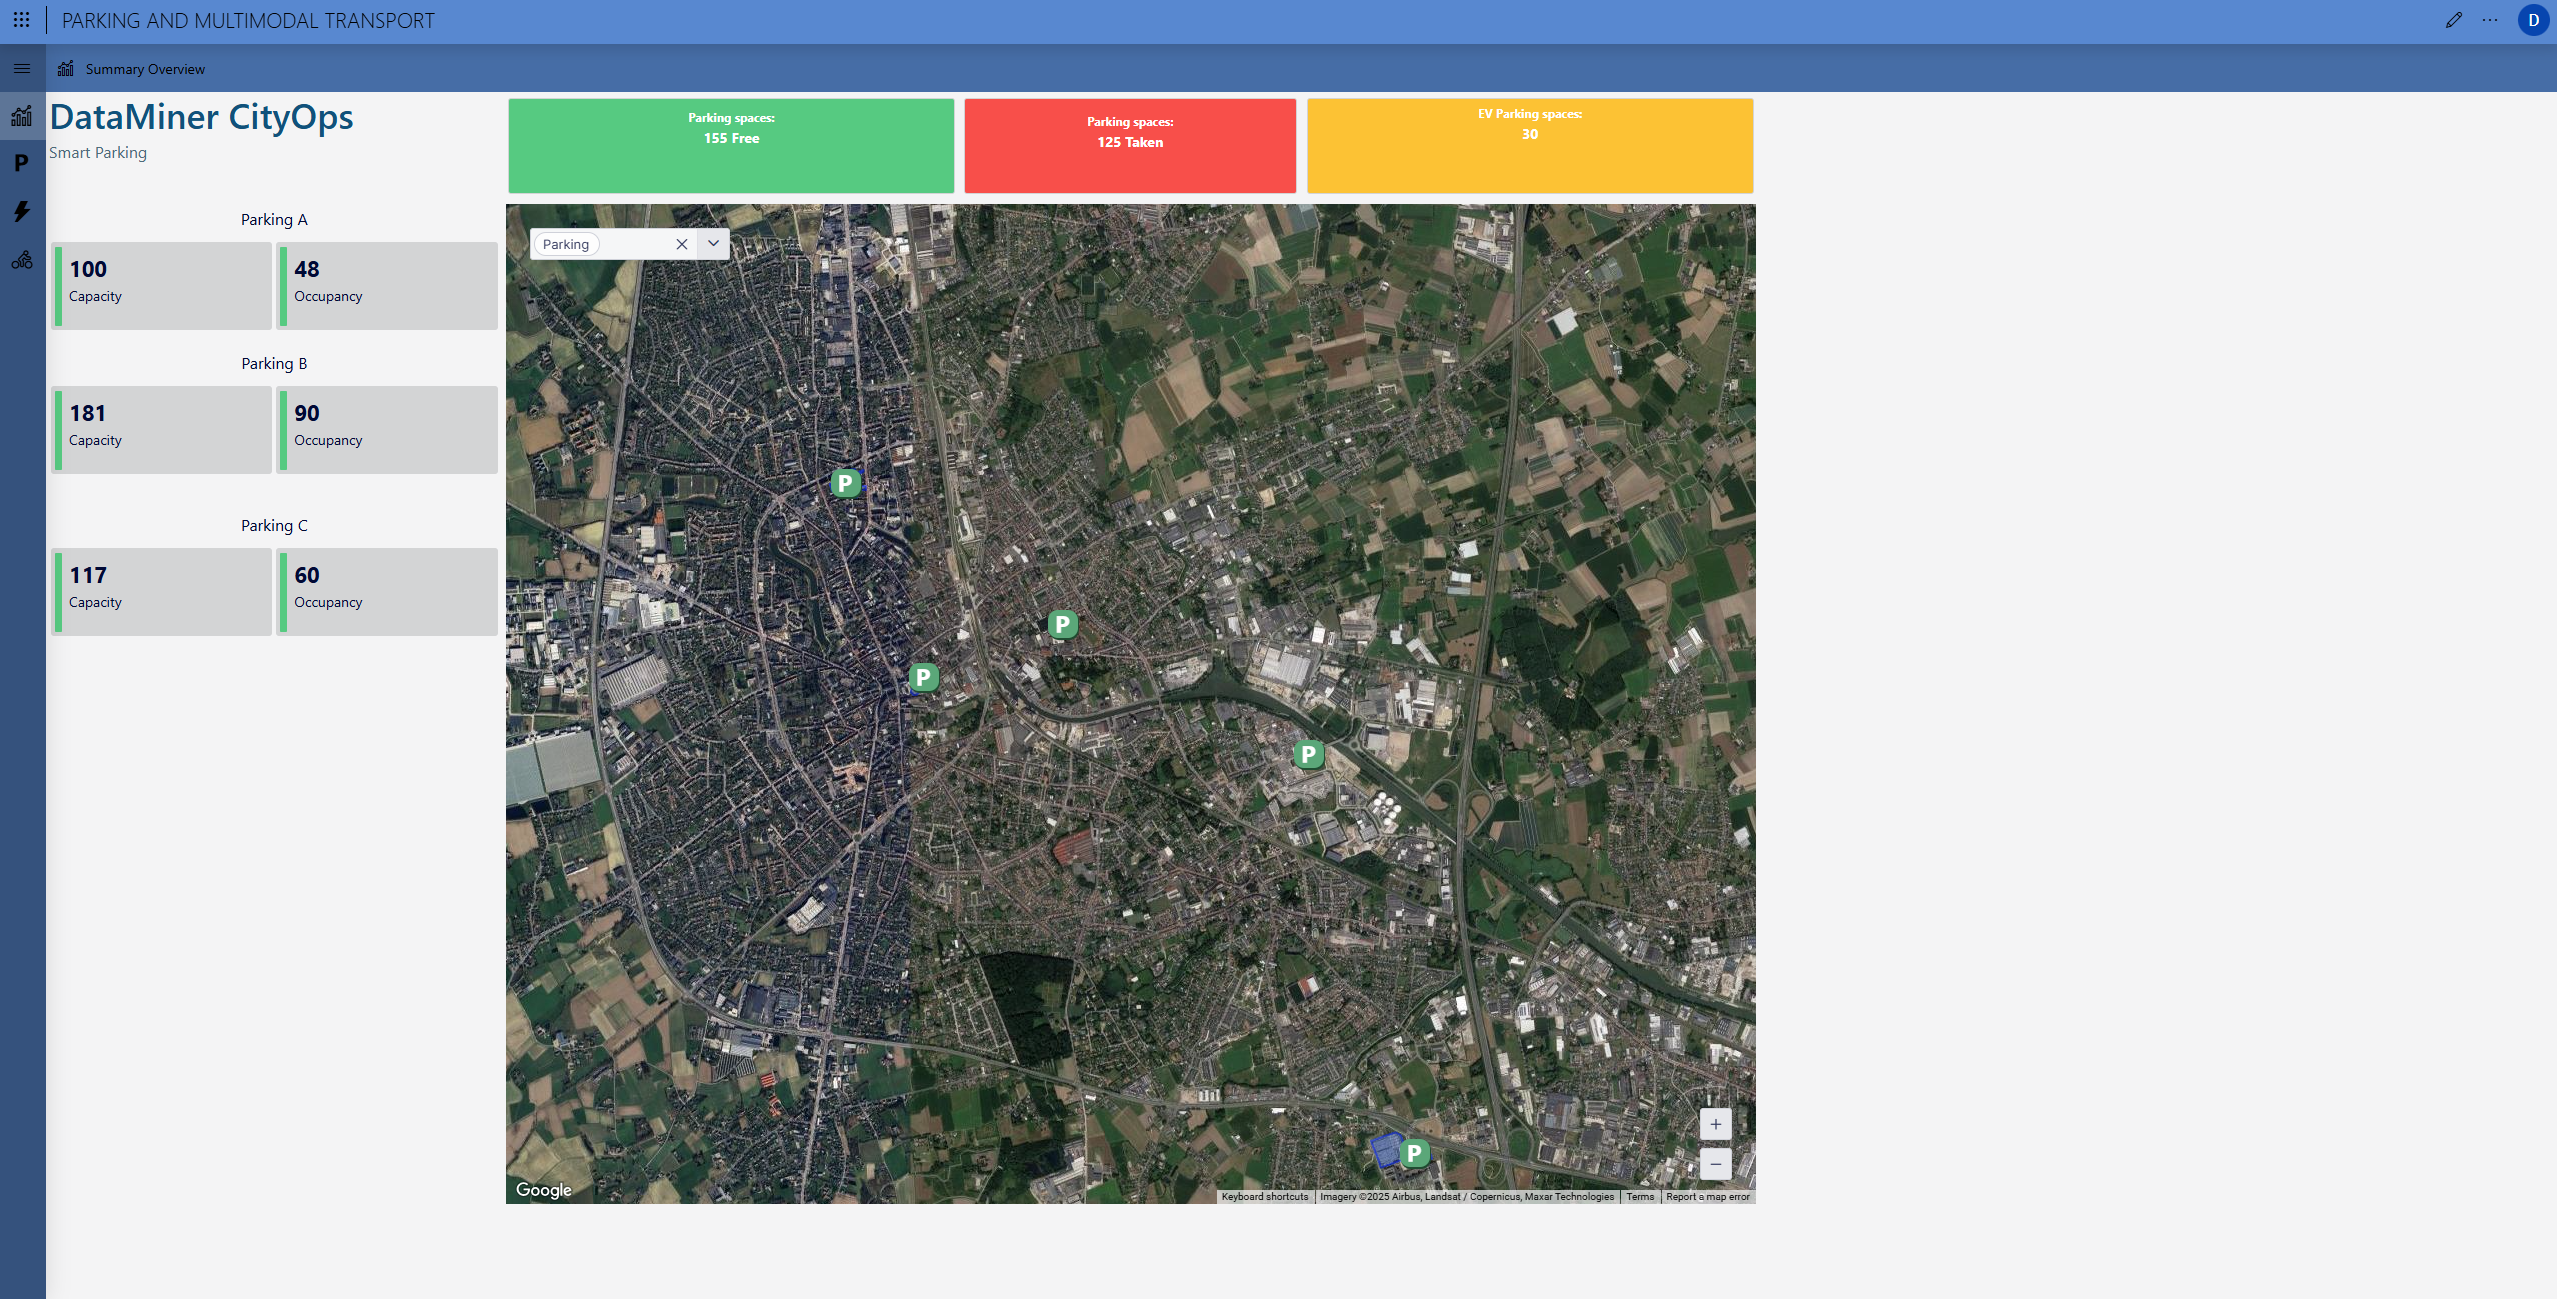
This citywide snapshot combines capacity and live occupancy data per area. The map displays each parking site with contextual layers, while the top ribbon shows instant counts of free, taken, and EV-dedicated spaces. The signage service automatically publishes this data to roadside displays through the DataMiner CityOps Communication Hub, ensuring real-time updates without manual action.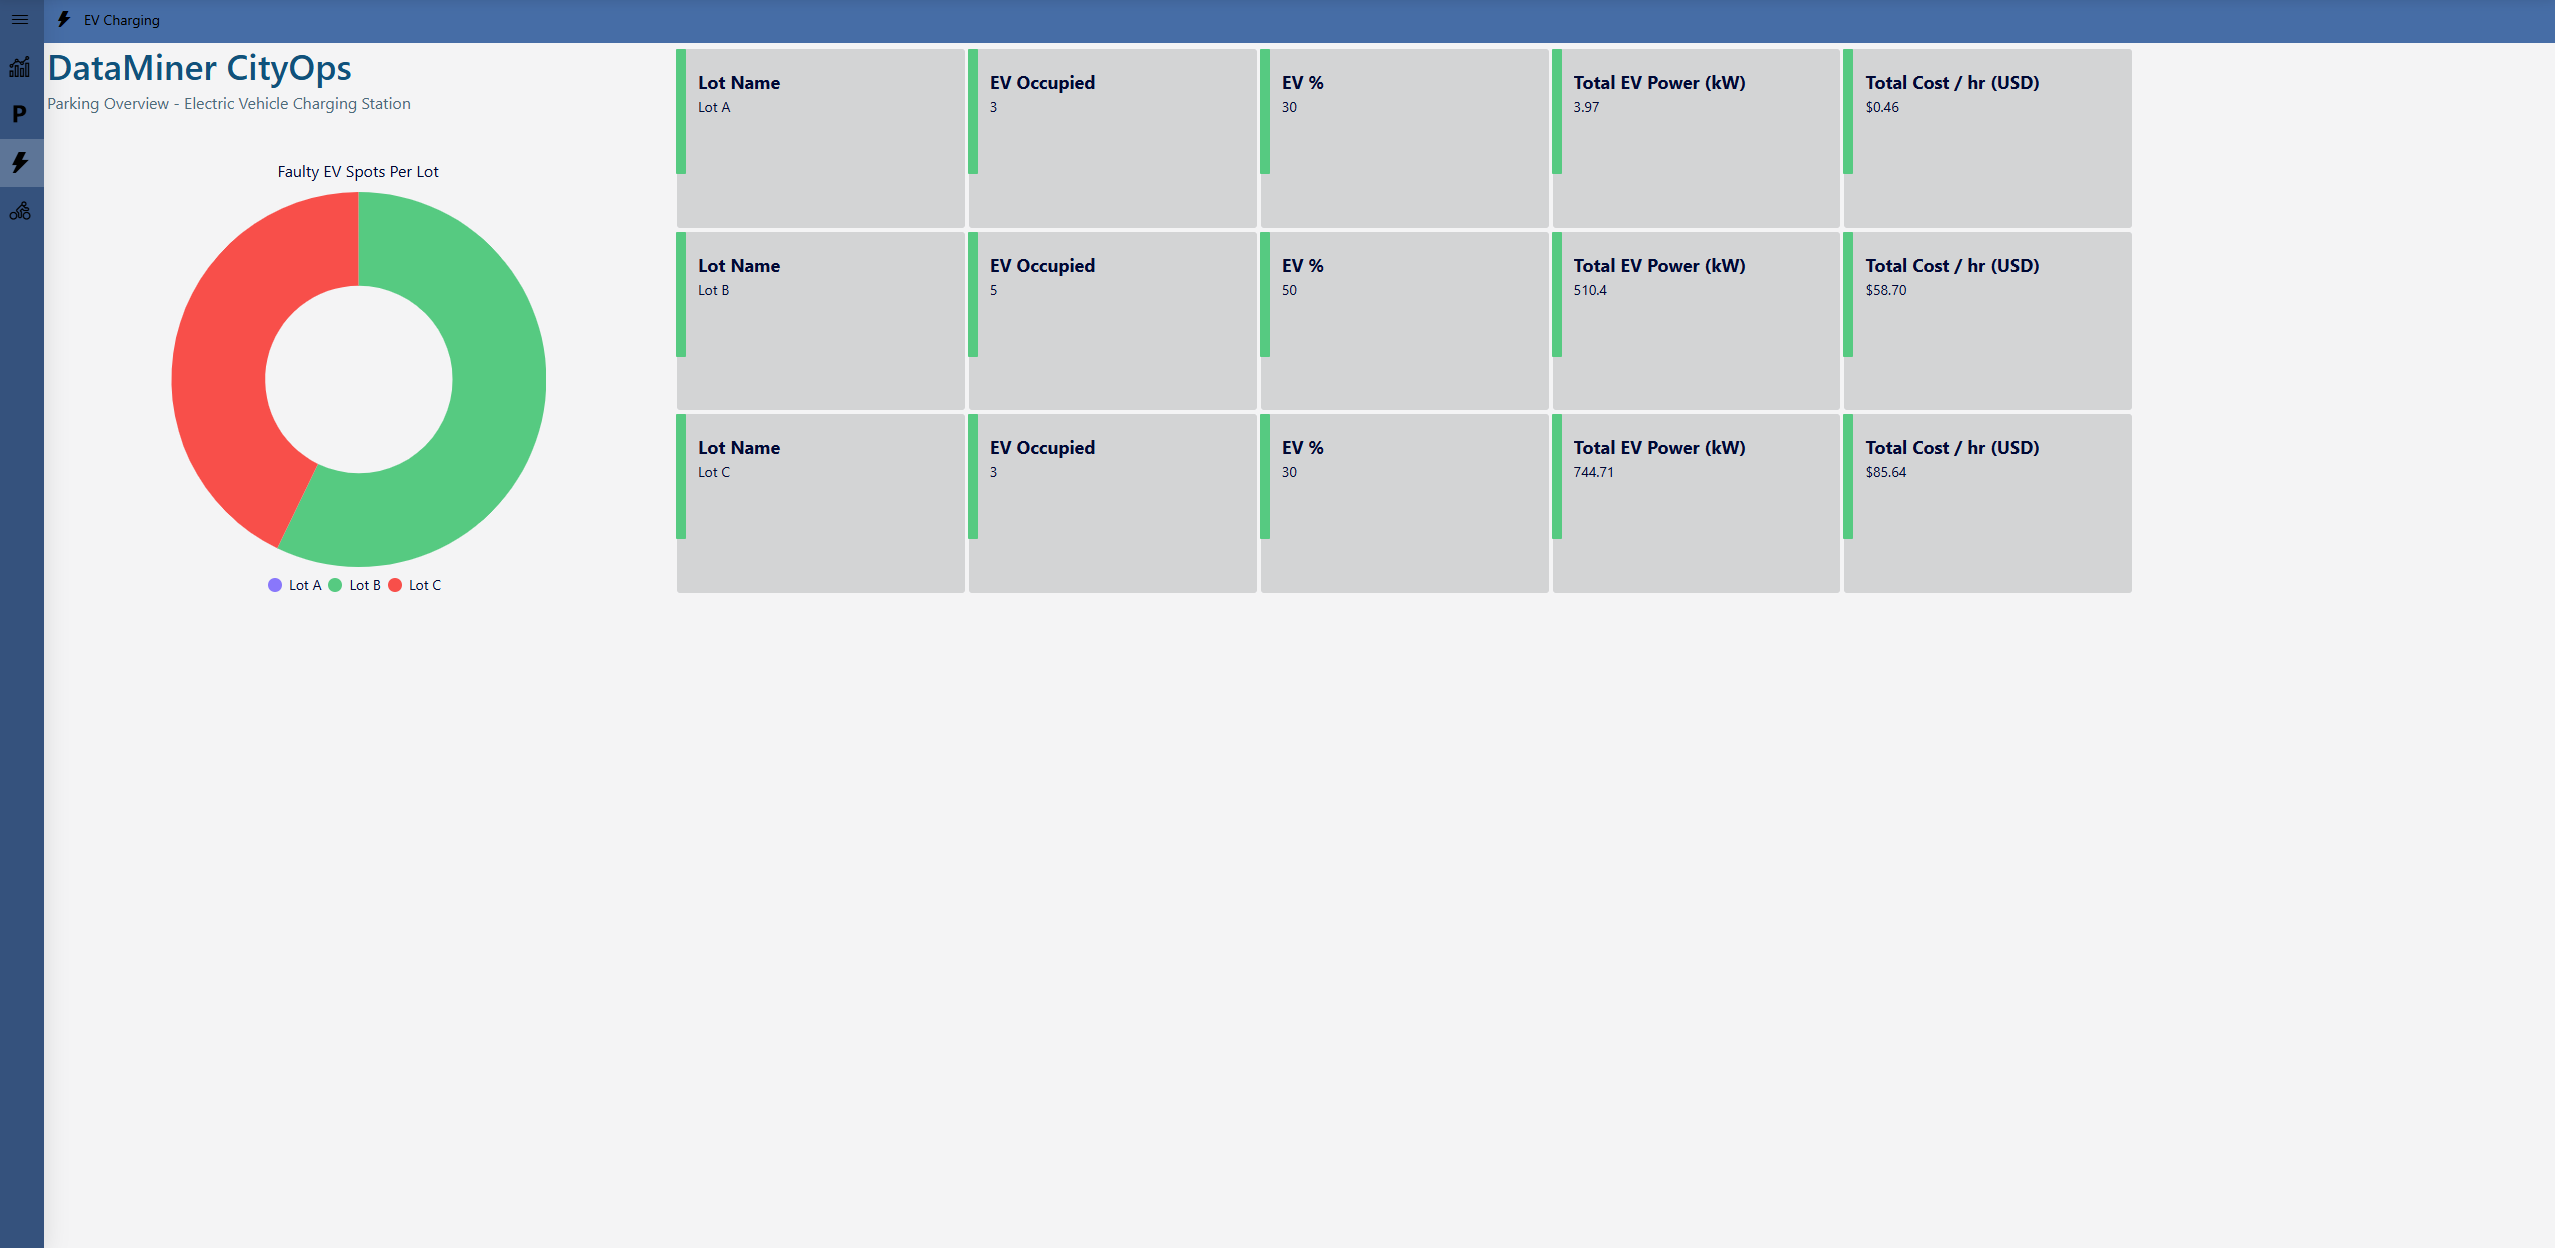
EV charging and parking overview
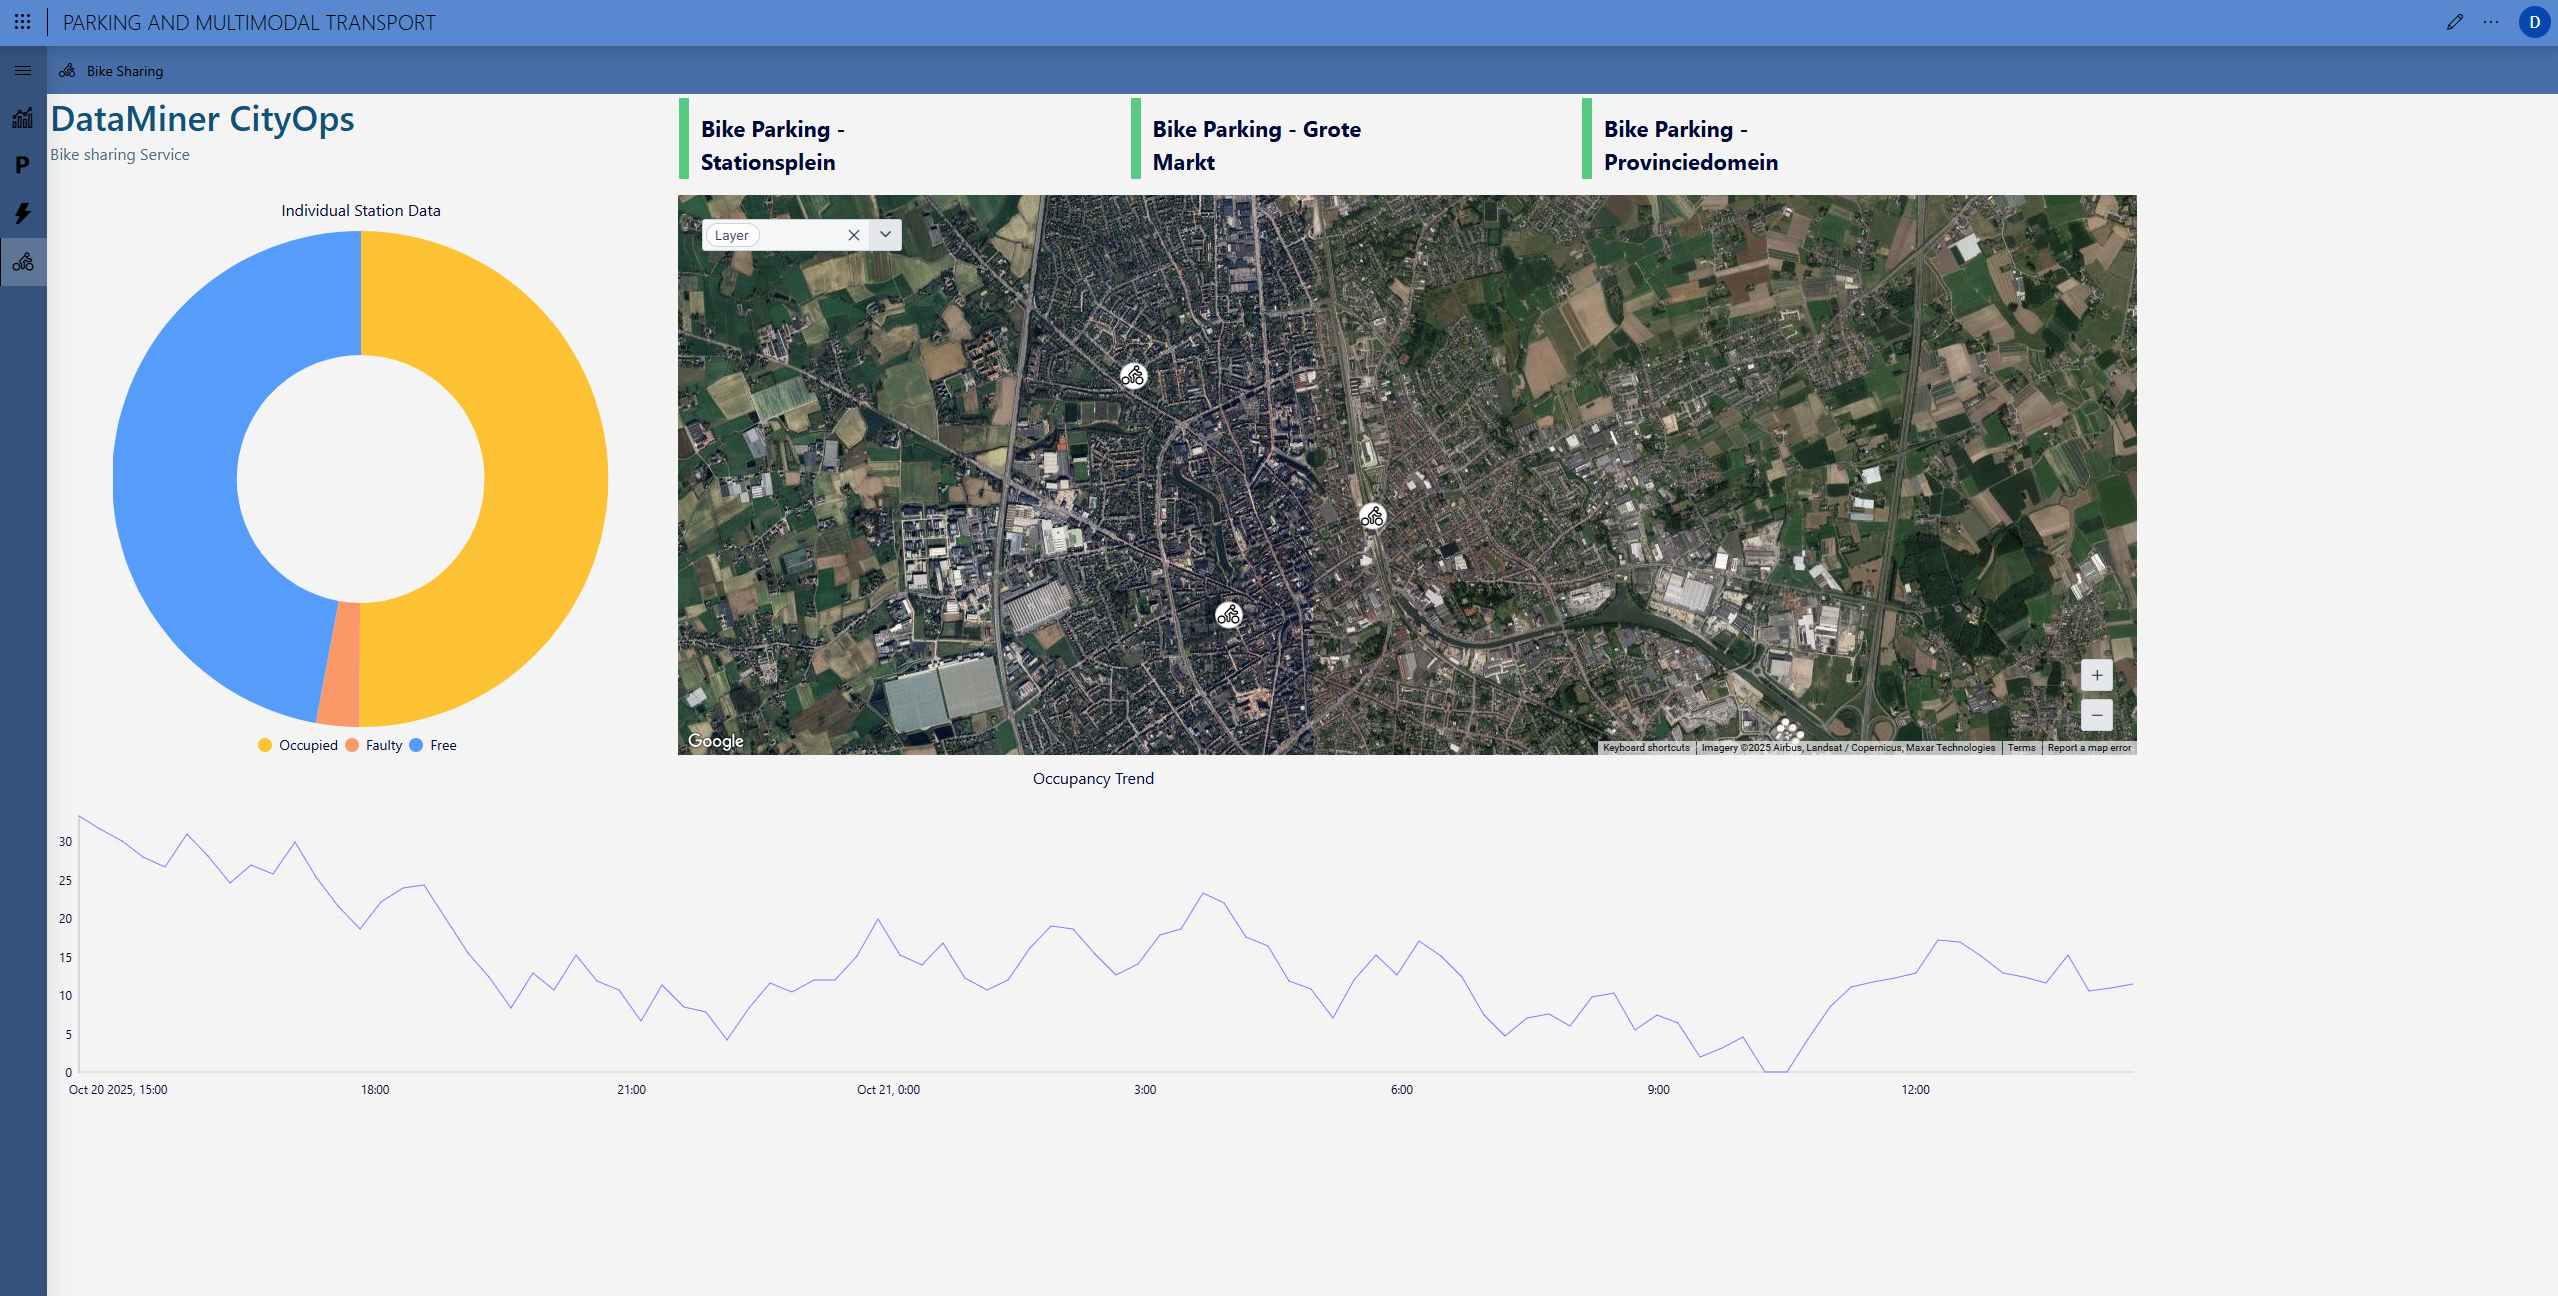
This page aggregates EV charger activity per parking lot. The donut chart reveals faulty EV spots by lot for immediate awareness, while tiles display EV occupancy, utilization percentage, total EV power in kilowatts, and cost per hour. Any abnormal power or cost trend can trigger a work order in DataMiner CityOps Planned Maintenance to ensure uptime and energy efficiency.