solution Use Case
DataMiner CityOps ESG Monitoring
Real-time insight into environmental, social, and governance performance
The ESG Monitoring module provides a live, data-driven view of sustainability performance across the city. It continuously collects and aggregates live data from all connected systems, IoT sensors, and digital services, enriching it with contextual intelligence for governance and strategic planning. The system delivers real-time visibility into environmental impact, workforce conditions, and governance indicators, allowing city leaders to make informed decisions that align with ESG goals and compliance requirements.
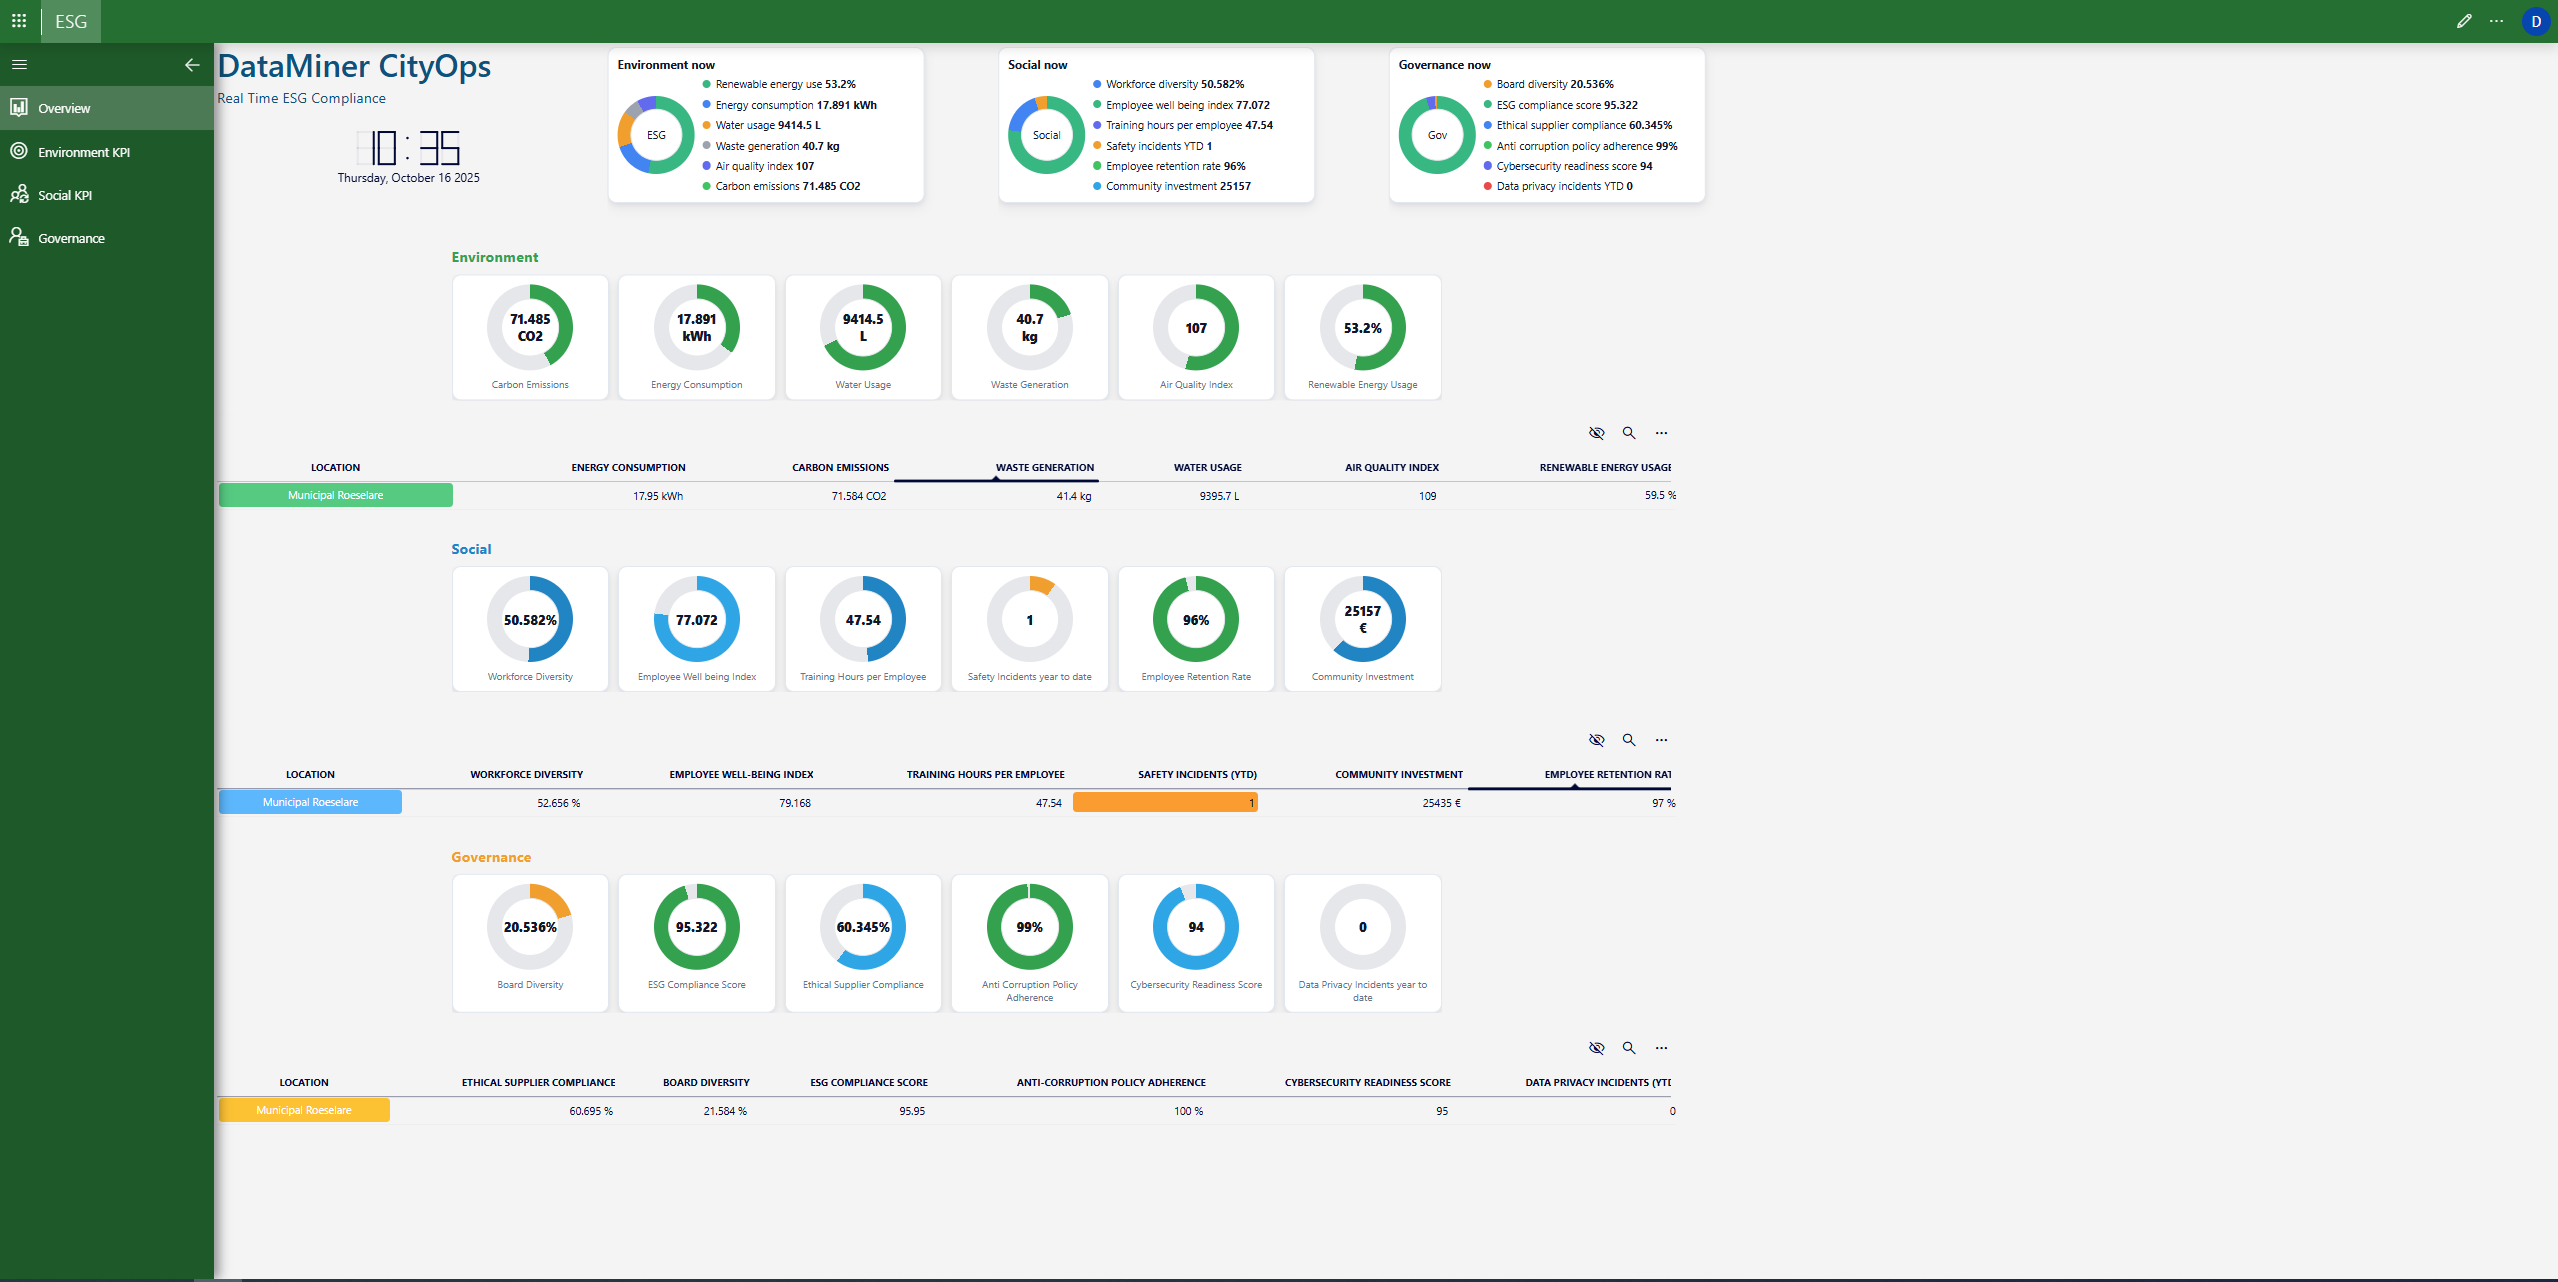
The main dashboard displays a real-time overview of combined ESG performance, offering city-wide visibility into energy consumption, water usage, waste generation, air quality, renewable energy utilization, workforce diversity, and governance compliance. Each category can be explored in detail through dedicated KPI sections that reveal historical patterns and live performance fluctuations.
USE CASE DETAILS
On the Environment Overview page, aggregated metrics for carbon emissions, energy and water use, waste generation, and renewable energy contribution are presented together in a unified view. This provides instant access to the overall environmental footprint of the city, helping identify consumption patterns, sustainability progress, and the influence of efficiency measures.
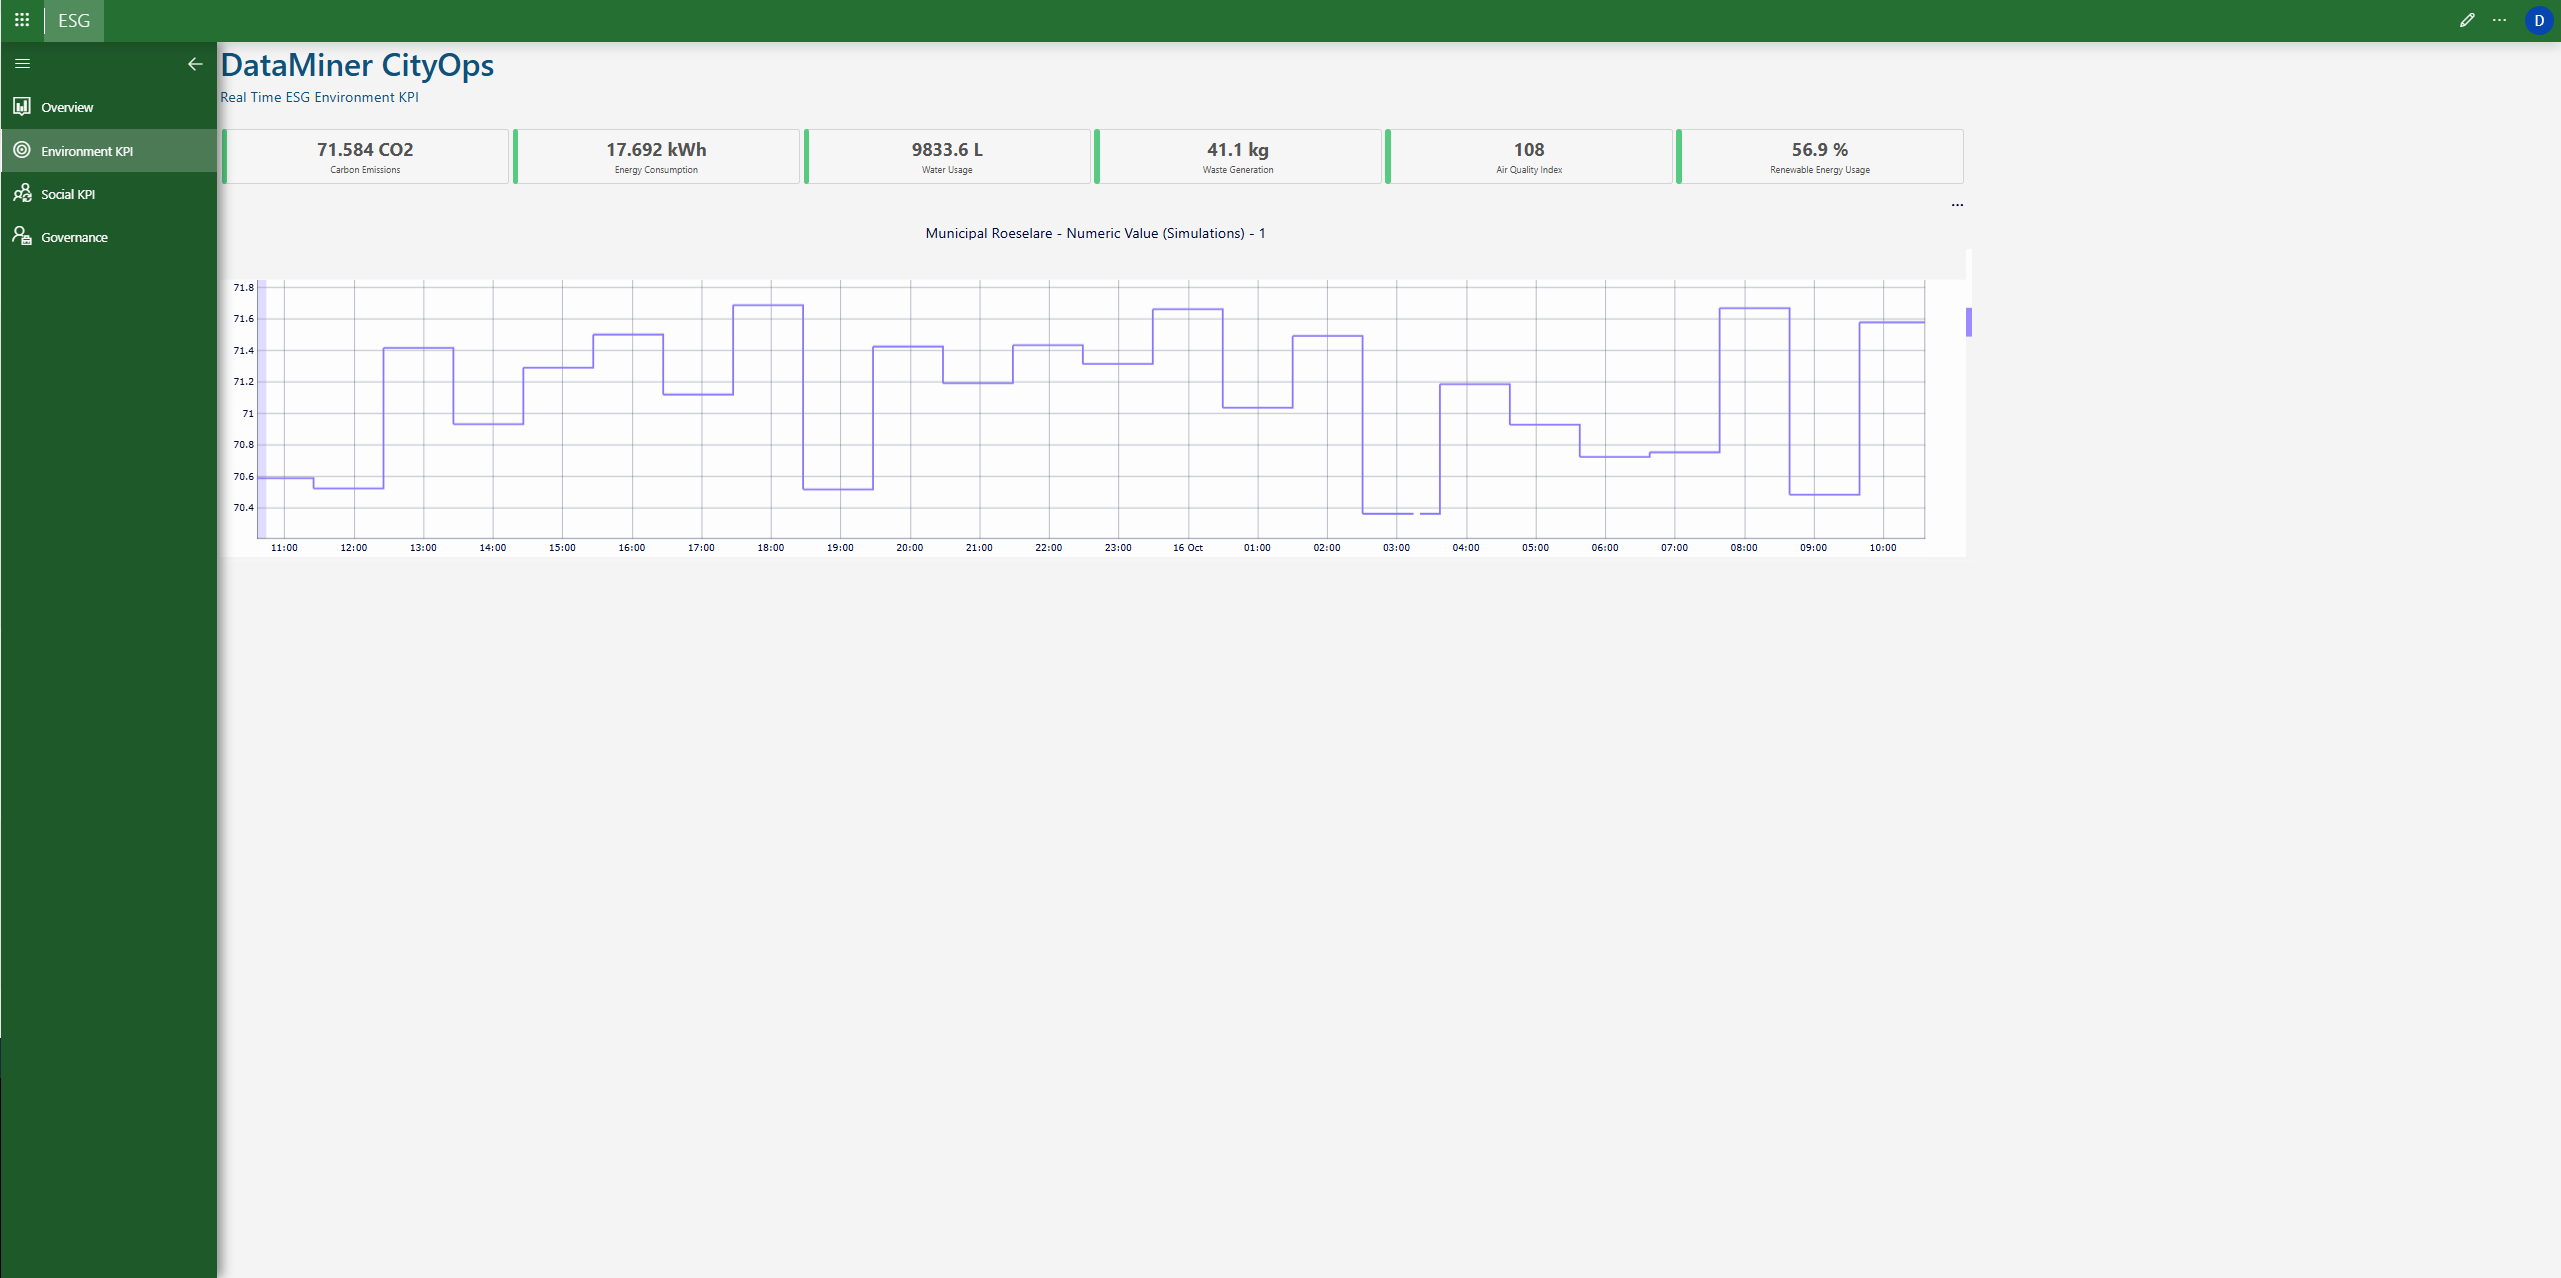 On the Environmental KPI page, trend data over time is visualized through dynamic charts that track continuous performance changes. Real-time sensor data feeds the graphs, allowing users to observe variations, seasonal shifts, and anomalies as they occur. This enables early detection of irregularities, optimization of resource use, and validation of long-term sustainability efforts.
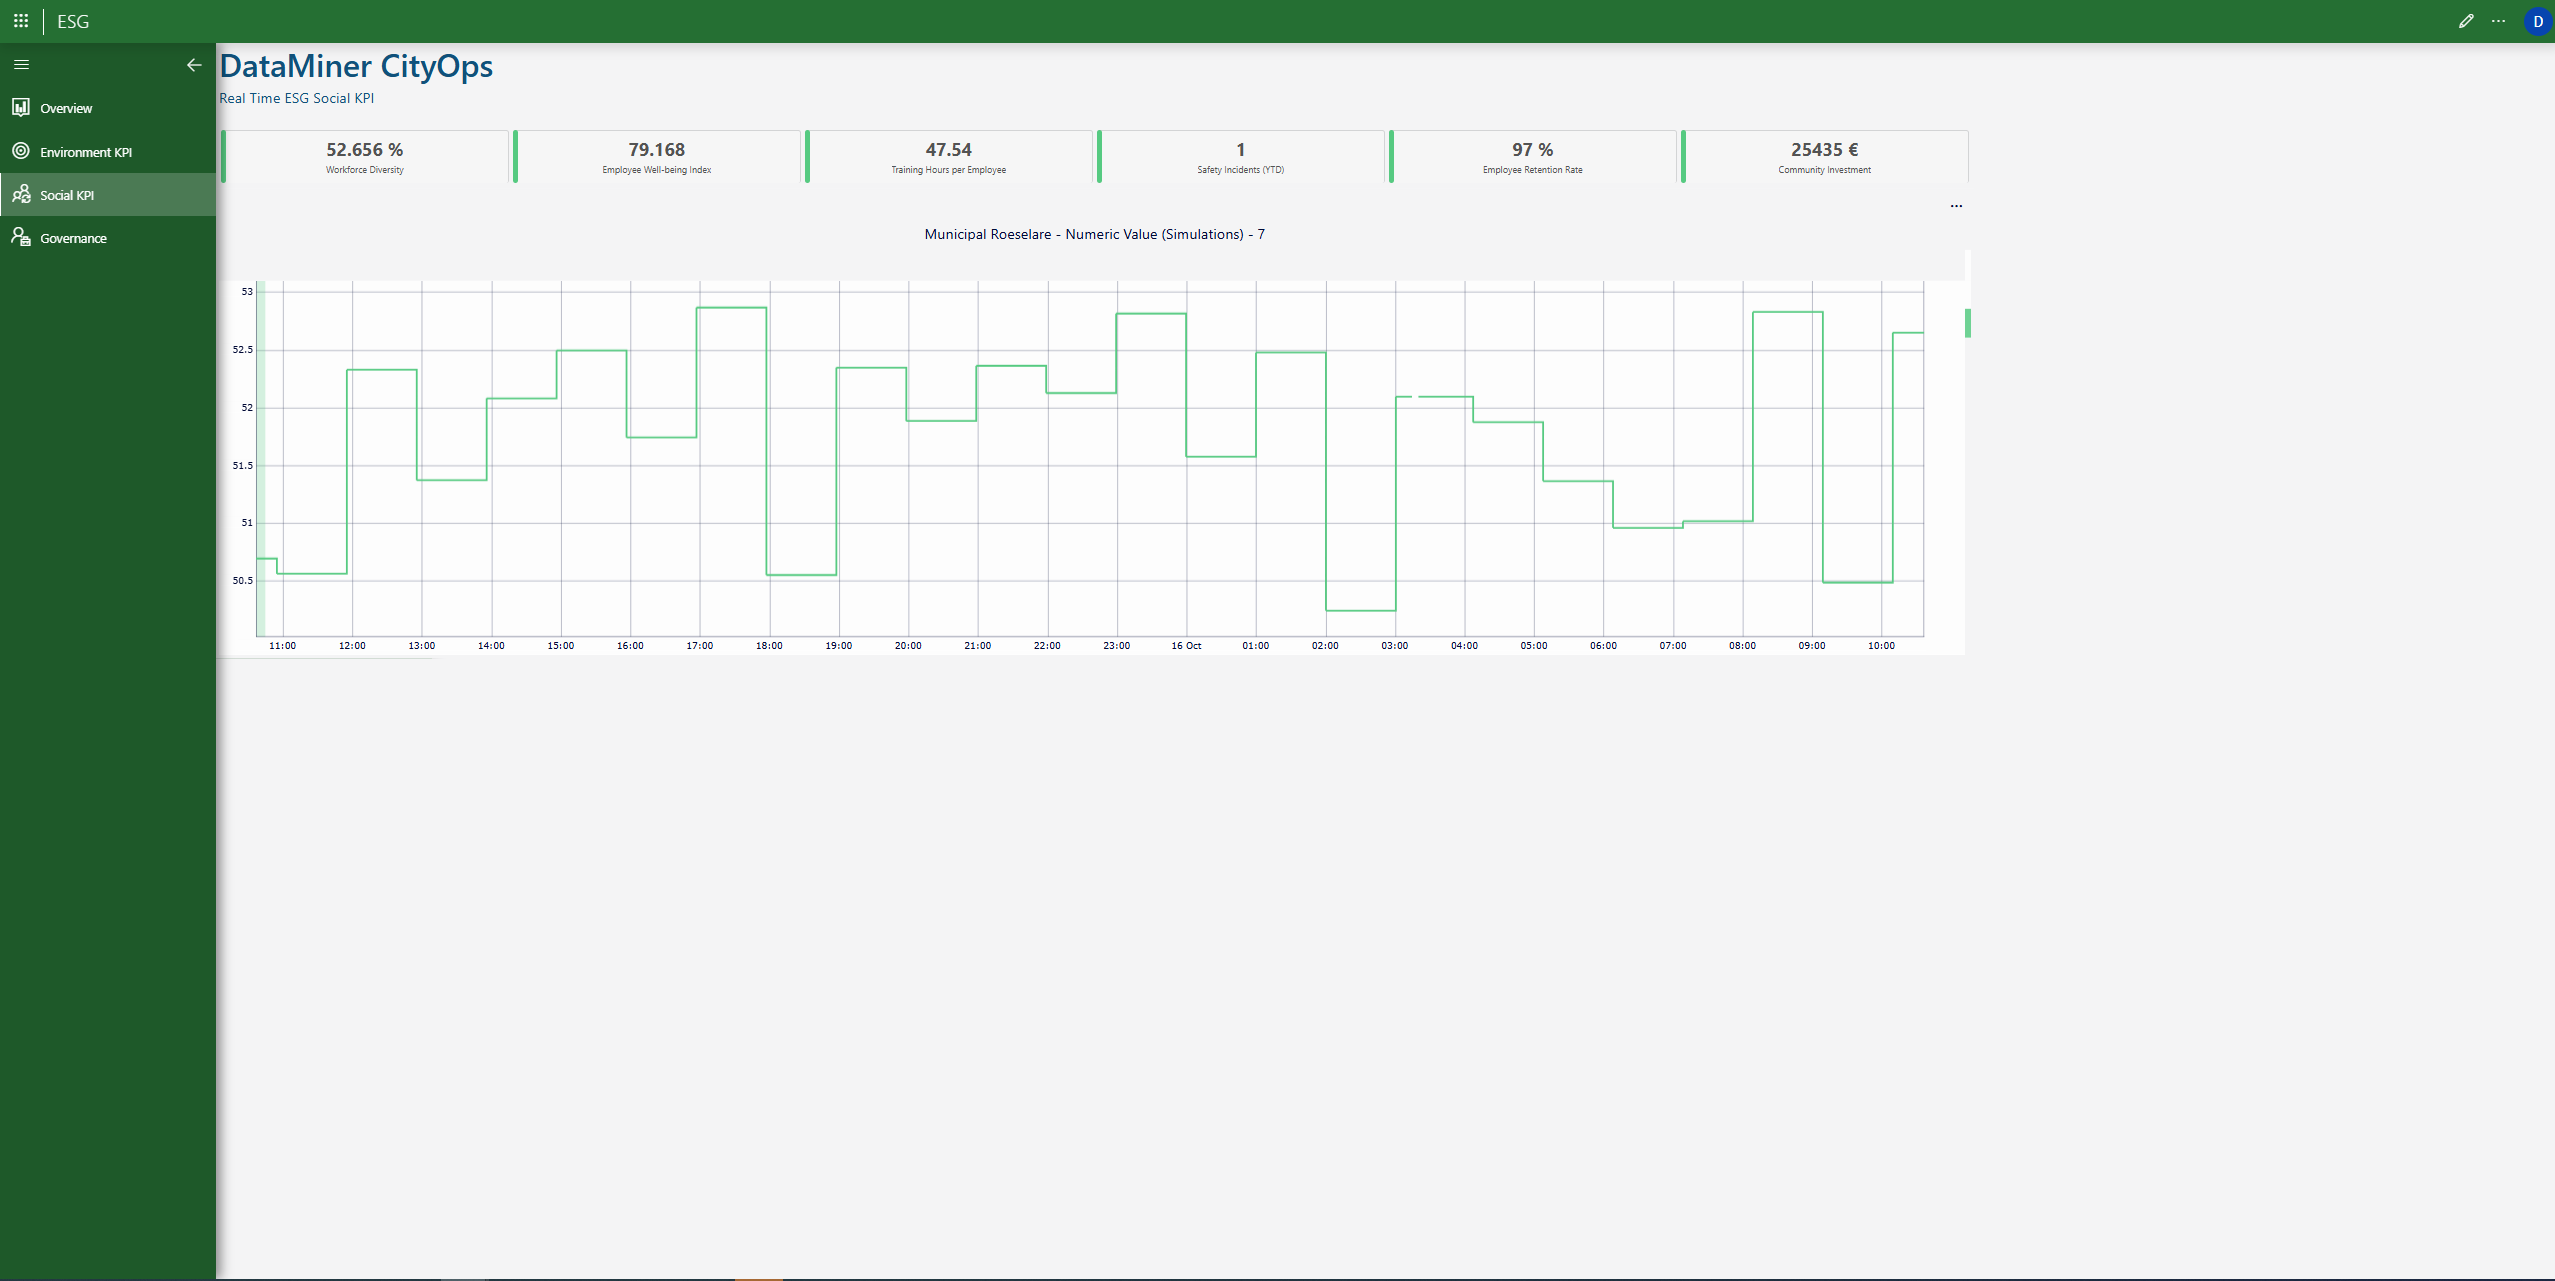 On the Social KPI page, indicators such as "workforce diversity", "employee well-being", "training levels", and "safety performance" are displayed with historical context. Trends over time reveal how city workforce programs evolve, how engagement levels respond to policy changes, and how social investments impact the local community.
 On the Governance KPI page, data on board diversity, ethical supplier compliance, cybersecurity readiness, and data privacy management is combined with temporal insights. Viewing governance performance over time strengthens transparency and ensures continuous compliance improvement across all departments and city institutions.