solution Use Case
Targeted customer QoE tracking
Regardless of the industry, activity, or customer offering, success is often directly tied to how customers perceive the experience delivered to them. The more value customers place on their experience, the more likely they are to remain loyal and recommend the service to colleagues, contacts, and friends.
It’s therefore crucial to understand both what drives the quality of that experience and how well the organization performs in these areas. While it’s impossible to account for individual differences in perception, it’s essential to have a setup that can adapt to evolving expectations. These expectations are often influenced by factors such as service type, pricing, and the natural evolution of the market over time.
As a result, service providers must manage at least one Quality of Experience (QoE) benchmark per service, with the flexibility to define and adjust these benchmarks as needed. In most QoE management platforms, carefully selected sets of KPIs (Key Performance Indicators), KQIs (Key Quality Indicators), and aggregated data are used to monitor performance. However, to address the dynamic nature of customer expectations, it’s important for operators to have the ability to freely define, adjust, and evolve their KPI sets and KQI definitions.
This flexibility allows service providers to easily adapt to changes in service offerings, access technologies, service topologies, or data sets available for analysis.
In this use case, a telecom operator in the Nordics has been using DataMiner for several years to manage its converged television and video streaming ecosystem. Leveraging the Experience and Performance Management module, the operator collects and aggregates performance data related to subscriber sessions across three dimensions: device, infrastructure, and service endpoints.
Recently, they expanded their setup by integrating the Data Aggregator DxM to enable targeted QoE tracking for all new subscribers. This tracking applies for 30 days, focusing initially on subscribers of the operator’s latest OTT (Over-the-Top) service delivered via fixed wireless access (FWA). By utilizing fully customizable KQI definitions, the operator gains immediate visibility into any subscriber who is not receiving the desired Quality of Experience.
This enhanced visibility includes detailed insights into the type and frequency of incidents or errors encountered, as well as the specific service endpoints associated with these issues. The decision to use Data Aggregator DxM was driven by its ability to easily manage differing KPI sets and KQI definitions across various service offerings, including OTT (over FWA), IPTV (over FTTH), and DVB-C (over HFC).
Additionally, a low-code app serves as the data presentation layer, which was developed and is maintained by the operator itself. Powered by DataMiner GQI queries and custom data sources, this setup provides further insights into the number and types of issues reported, the total number of impacted customers on any given day, and which customers were most affected.
USE CASE DETAILS
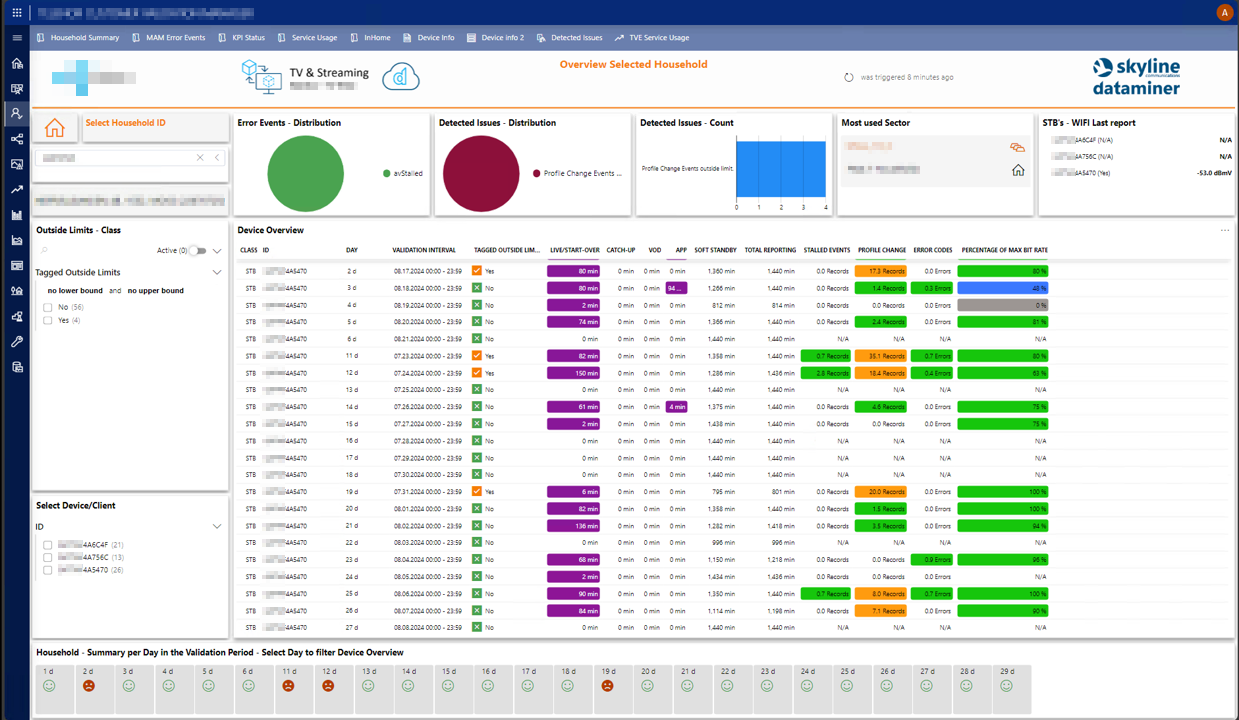
On this page, the quality of experience (QoE) as experienced by a specific subscriber can be consulted. In the center of the page, you will find an overview of the QoE records associated with this customer. Each record corresponds to a specific day and service endpoint related to the customer. Any instances where the QoE falls was below the target are highlighted, with color-coded flags indicating which KQI(s) are in breach.
At the bottom of the page, you can see which days have shown a QoE breach. The operator can zoom in on the records for any specific day by simply clicking the icon for that day.
On the left side, there is an option to filter QoE records based on the endpoint class, ID, or those tagged as “OUTSIDE LIMITS” due to a breach.
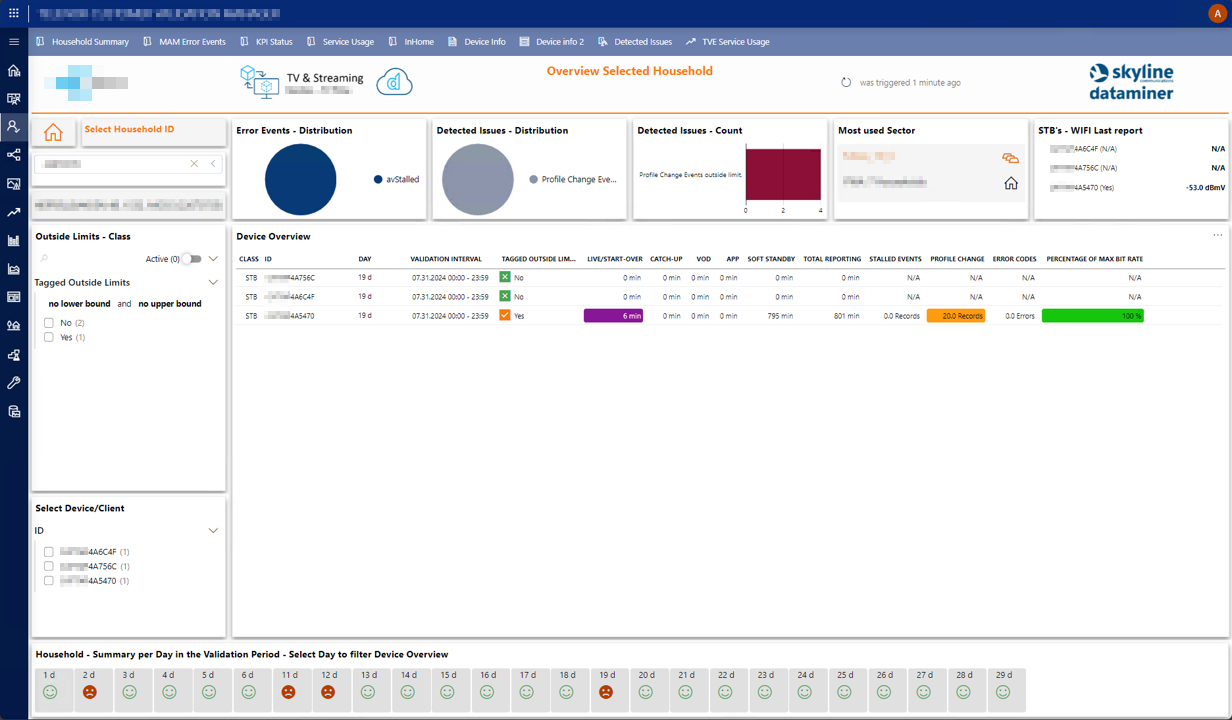 Here you have the same page, now filtered for a specific day. For this day, there are QoE records for three different service endpoints. Only the last endpoint shows a breach of the targets set by the customer.
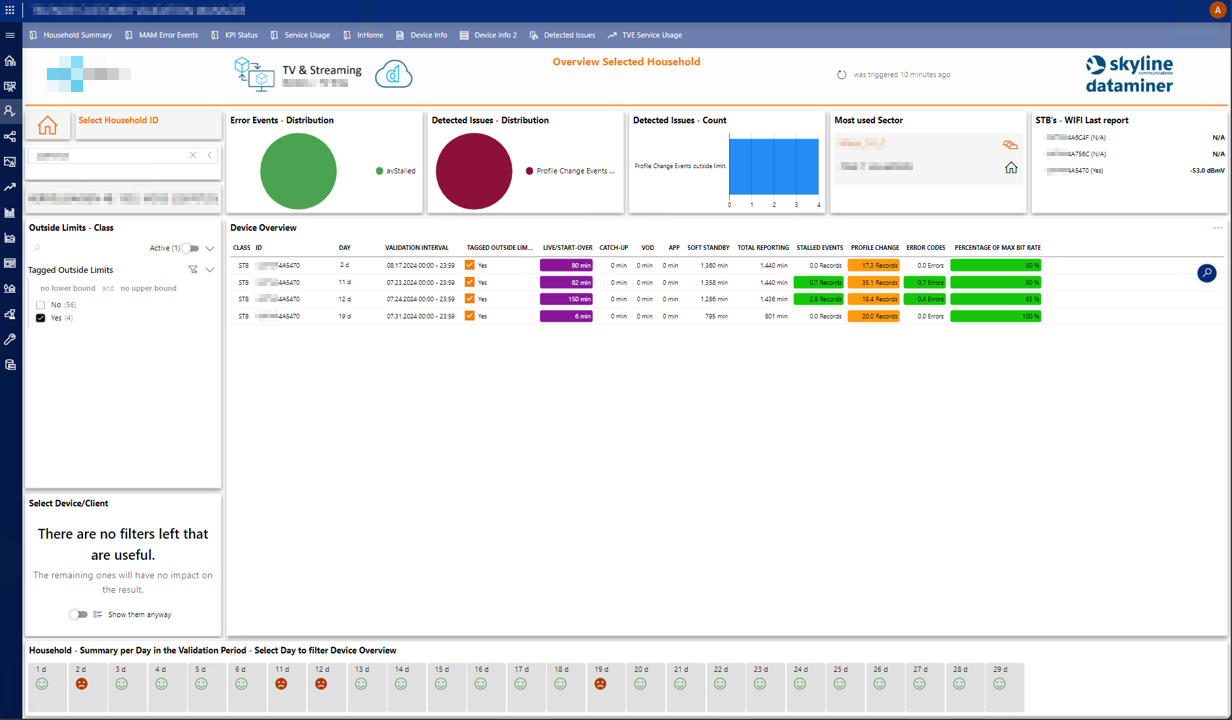 The subscriber’s QoE records have now been filtered to show only instances where there is a breach. All of these breaches are associated with the same ID as seen in the previous screenshot and are triggered by excessive profile changes.
This info allows the operator to determine that the QoE issues are likely related to poor Wi-Fi or an unstable connection of this specific STB to the in-home Wi-Fi network, which is otherwise serving all other STBs correctly.
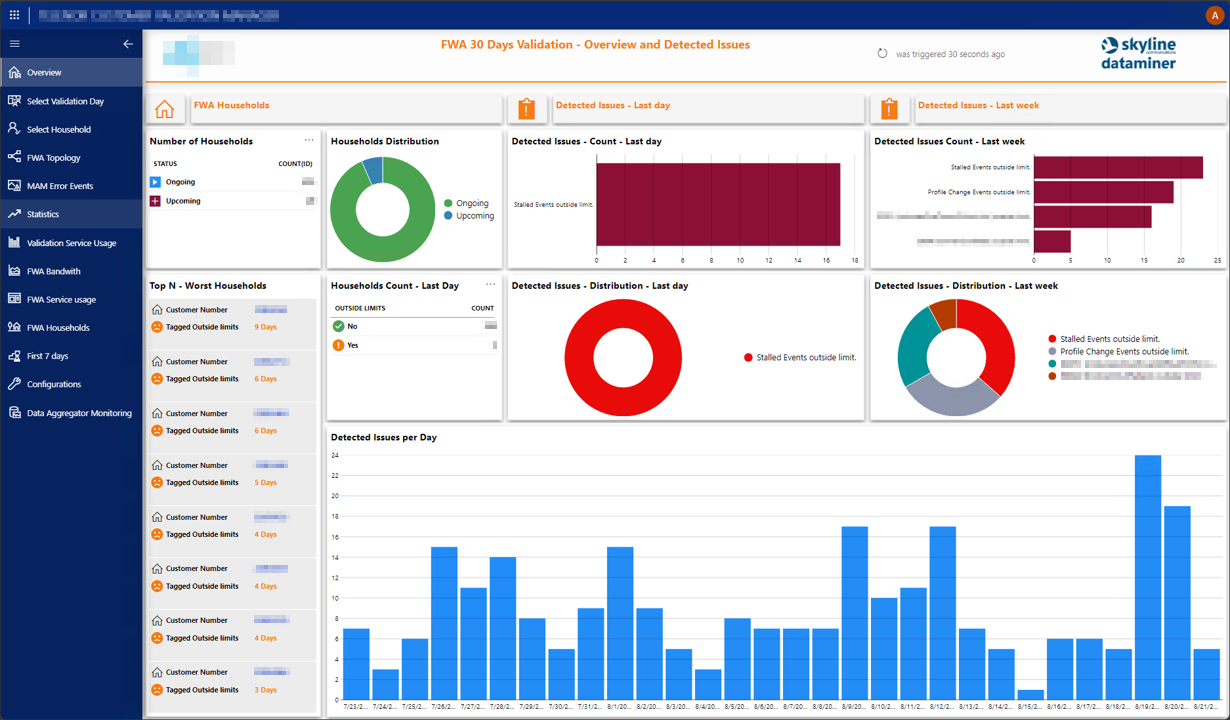 The application features more than ten different tabs; here, we are viewing the overview page.
At the bottom of this page, you’ll find an overview of the number of QoE KQI threshold breaches observed over the last 30 days. Above this trend graph, additional information is provided, breaking down these QOE incidents by the different KPIs/KQIs that can trigger them.
Finally, to help the team prioritize their follow-up actions, a list of households experiencing the most incidents is displayed on the left side of the page.
1 thought on “Targeted customer QoE tracking”
Leave a Reply
You must be logged in to post a comment.
Great dashboards that will truly impact how engineering, operations and commercial teams will priority their work to meet the UEx target levels!